



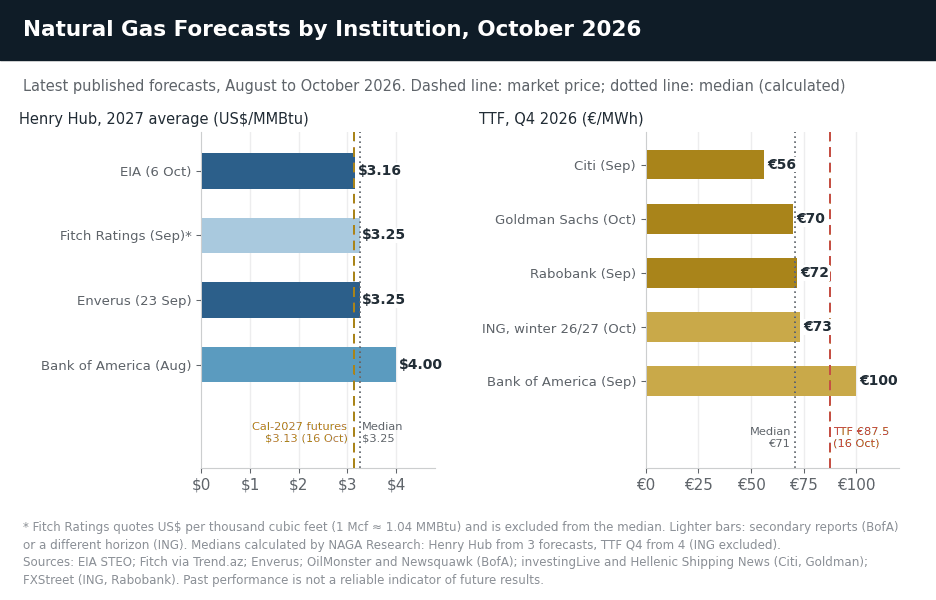
Are natural gas prices expected to rise? A little this winter, then not much further, according to most forecasters. The EIA expects the Henry Hub spot price to average $3.30 in Q4 2026 and $3.47 in Q1 2027 as heating demand picks up, then $3.16 for 2027 as a whole as production growth outpaces new LNG demand. The median of three 2027 forecasts in US$/MMBtu published since August, from the EIA, Enverus and Bank of America, is $3.25. In Europe, most banks expect the TTF benchmark to ease from its highest level since 2022: the median of four Q4 2026 bank forecasts is €71 per megawatt hour (MWh), against a market close of €87.55 on October 16.
Natural gas prices at Henry Hub have swung widely in 2026. Winter Storm Fern sent the spot price to an all-time daily record of $30.72 on January 23, and front-month futures jumped from $3.10 on January 16 to $7.46 on January 28, their highest settlement since September 2022. Prices collapsed as soon as the cold passed: the March contract fell 26% on February 2, its biggest one-day drop in about 30 years, and futures settled at $2.52 on April 24, their lowest since late 2024. Since May, the front month has traded mostly between $2.60 and $3.35.
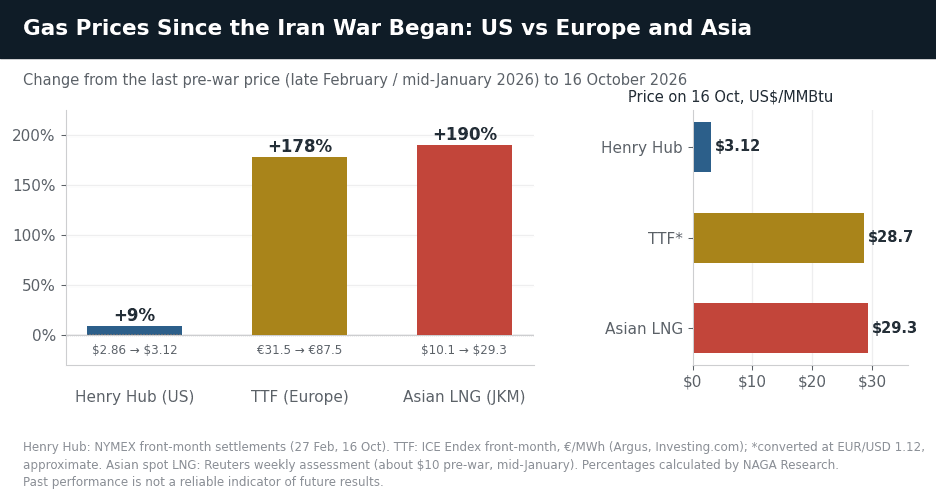
The bigger story is the gap between the US and the rest of the world. Since the US–Israel–Iran war began on February 28, Iranian strikes have damaged about 17% of Qatar’s LNG capacity at Ras Laffan, according to QatarEnergy’s chief executive, and LNG tanker traffic through the Strait of Hormuz, which carried about a fifth of the world’s LNG, has collapsed. Europe’s TTF benchmark is up about 178% since the war began and Asian spot LNG is about 190% above its pre-war level of about $10, while Henry Hub futures are up about 9%. US export plants were already running near full capacity, so they cannot ship much more gas to capture those higher prices: “Our Henry Hub assumptions remain unchanged due to limited spare US liquefaction capacity,” Fitch Ratings said in September.
“Natural gas could become increasingly relevant as the Northern Hemisphere moves deeper into the winter period,” says Frank Walbaum, Market Analyst at NAGA and a former hedge fund manager, in NAGA’s Q4 2026 Market Outlook. “Seasonality, weather expectations, inventories and energy-market disruptions can all produce significant price movements.”
Natural Gas Price Forecast & Price Prediction – Summary
- Natural gas price forecast for winter 2026–27: Forecasters expect slightly higher and volatile prices. The EIA expects Henry Hub to average $3.30 in Q4 2026 and $3.47 in Q1 2027, close to the futures market: on October 16 the November–March winter strip settled at an average of $3.26. Bank of America’s $3.80 for the second half of 2026 is the most bullish recent forecast. Weather will decide the outcome, and NOAA expects a strong El Niño, which tends to bring milder weather to the northern US.
- FORECASTERS’ BASE CASE: about $3.30–3.50 this winter, $3.15–3.25 in 2027 – Storage is expected to enter winter about 2% above the five-year average, LNG exports stay near record levels and production keeps growing. This is the path behind the EIA ($3.30 in Q4, $3.16 in 2027), Fitch Ratings ($3.25 per Mcf in 2027) and Enverus ($3.25 in 2027) forecasts, and it is close to the futures curve.
- COLD-WINTER SCENARIO (illustrative): back above $4 – An early, cold winter drains storage below the five-year average. January 2026 showed how fast this can happen: Winter Storm Fern caused a record weekly storage draw of 360 Bcf and lifted front-month futures from about $3.10 to $7.46 in seven trading sessions. The January 2027 contract already carries a winter premium ($3.76 on October 16), and a cold snap would add to it.
- MILD-WINTER SCENARIO (illustrative): $2.50–3.00 – A strong El Niño keeps the northern US warm, storage ends winter well above average and record output from the Permian and Haynesville weighs on prices into the spring. Even in its base case the EIA sees Henry Hub at $2.64 in Q2 2027, with monthly lows of $2.60 in April and May, and the futures curve prices April 2027 at $2.56; a mild winter could bring those levels forward.
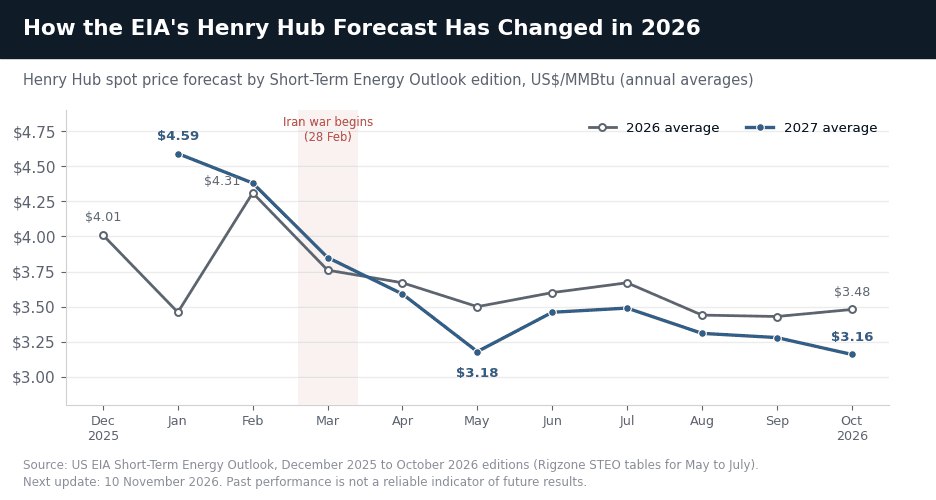
- Natural Gas price prediction 2027: Forecasters expect lower prices on average than in 2026, with a softer spring. The EIA expects Henry Hub to average $3.16 in 2027, down from $3.48 in 2026, as dry gas production rises to a record 116.1 billion cubic feet per day (Bcf/d) and outpaces new LNG demand. Its 2027 forecast has been cut in each of its last three outlooks and is down from $4.59 in January. Forecasts published since August range from about $3.13 (Fitch Ratings’ $3.25 per Mcf, converted) to $4.00 (Bank of America); the median of the three quoted in US$/MMBtu is $3.25, and Calendar 2027 futures settled at an average of $3.13 on October 16.
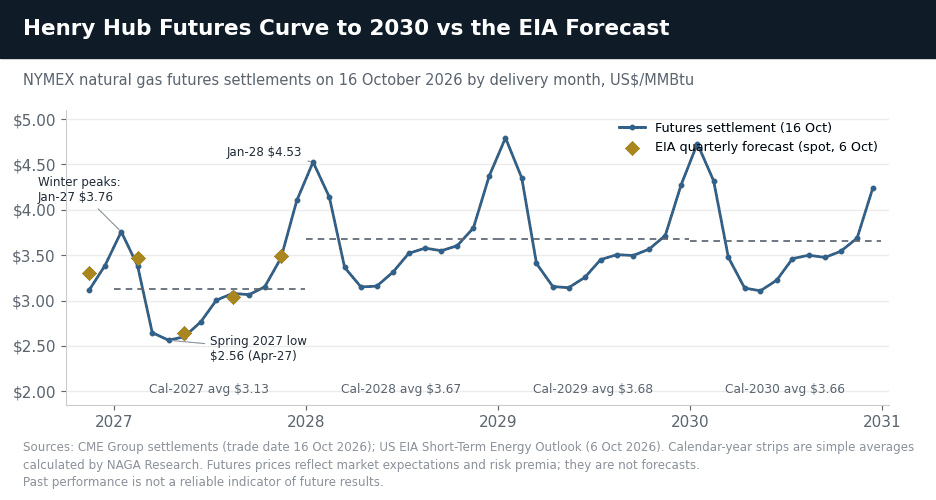
- Natural Gas price prediction for the next 5 years and beyond: Most long-term views point to higher prices than today, but the range is wide. The EIA’s Annual Energy Outlook 2026 sees Henry Hub rising through the early 2030s and then staying between $5 and $6 in most cases, Wood Mackenzie expects about $5 by 2035, and energy executives polled by the Dallas Fed in September expect $4.28 in five years. Fitch Ratings, by contrast, assumes $2.75 per Mcf over the long term, and the futures market prices 2028–2030 at about $3.65–3.70.
Key dates for natural gas in the next two months
Date
Event
Why it matters for natural gas
Every Thursday
EIA Weekly Natural Gas Storage Report
Shows whether US storage is building or drawing faster than normal
Late October
IEA quarterly Gas Market Report (expected)
First IEA update since July, when it assumed Hormuz would reopen in Q3
October 28
November NYMEX contract expires
Futures roll to December, which settled 27 cents above November on October 16
November 10
EIA Short-Term Energy Outlook
Next update of the EIA’s Henry Hub forecasts
November 19
NOAA monthly outlook
Updated December–February temperature outlook; El Niño is the key driver
December 1
End of the EU storage target window
EU countries can meet their storage targets any time from October 1 to December 1
January 1, 2027
EU ban on Russian LNG under long-term contracts
Removes another source of supply from Europe’s market
With NAGA.com, you can trade US Natural Gas through CFDs if you want to speculate on price movements or invest in Energy stocks and ETFs.
Fundamental Natural Gas Forecast: A Tale of Two Markets
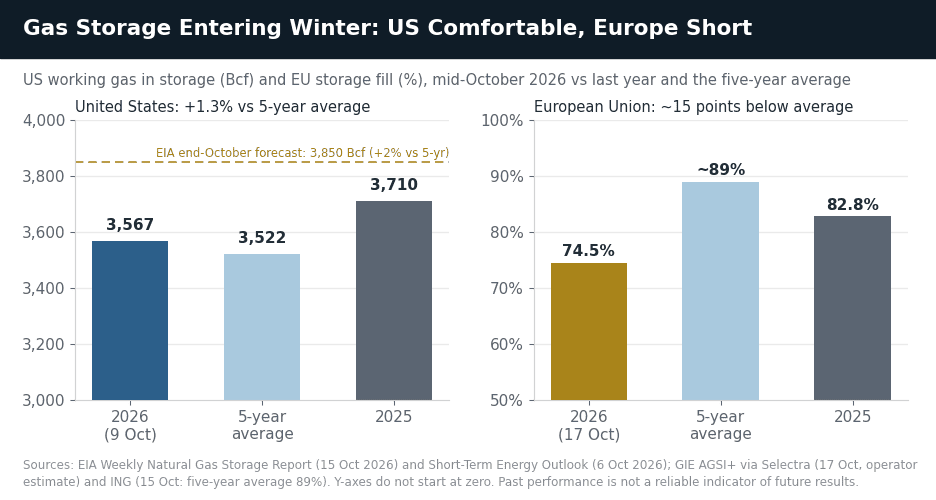
Natural gas enters winter 2026–27 split in two. In the US, storage is slightly above normal, production is near record highs and LNG plants are already exporting almost as much as they can, so the Hormuz shock has barely reached Henry Hub. In Europe and Asia, the loss of most Gulf LNG has pushed prices to their highest since 2022, and Europe enters winter with storage well below normal. Understanding that split is the key to any natural gas price forecast.
US LNG Exports: Record Highs, Little Spare Capacity
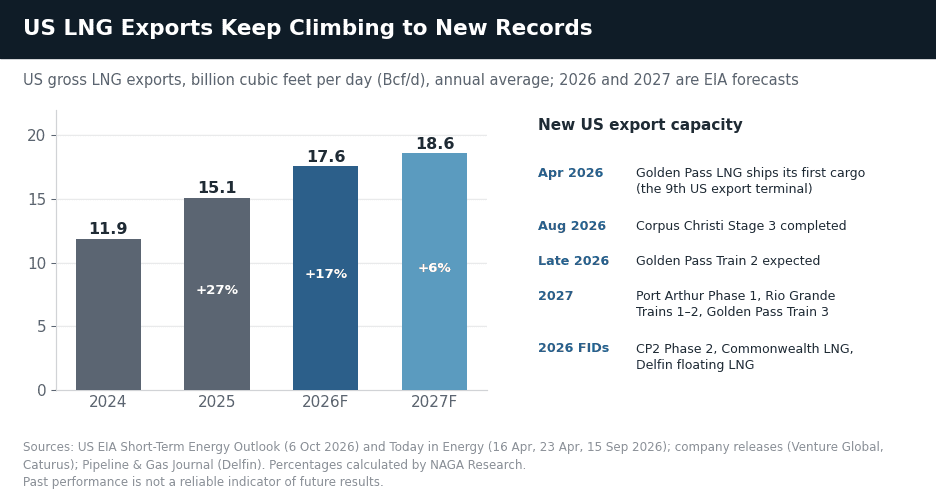
US LNG exports are running near record levels. Golden Pass LNG shipped its first cargo on April 22, becoming the ninth US export terminal, and Corpus Christi Stage 3 was completed on August 28, making Corpus Christi the second-largest US terminal. US plants exported a record 11.7 million tonnes (Mt) in March, as Europe and Asia scrambled to replace Qatari supply, and 10.9 Mt in September, more than half of it to Europe. The EIA expects US LNG exports to average 17.6 Bcf/d in 2026, up 17% on 2025, and 18.6 Bcf/d in 2027, and Energy Secretary Chris Wright said in September that the US is “on track to surpass 120 million tonnes” this year.
Past performance is not a reliable indicator of future results. All historical data, including but not limited to returns, volatility, and other performance metrics, should not be construed as a guarantee of future performance.
That matters for Henry Hub because LNG exports are the largest source of new demand for US gas. Feedgas to US export plants hit a monthly record of 18.8 Bcf/d in April, according to LSEG data, and was on track for about 18.9 Bcf/d on October 16 as Golden Pass ran at record rates. But the plants are close to their limits — the EIA put peak US export capacity at 18.3 Bcf/d in April, before the latest trains started — so higher prices abroad cannot pull much more gas out of the US. The next step comes in 2027, when Port Arthur Phase 1, Rio Grande Trains 1–2 and the third Golden Pass train are due, and three more projects took final investment decisions this year: CP2 Phase 2, Commonwealth LNG and Delfin’s first floating LNG unit.
Production — Record Supply Keeps a Ceiling on Prices
While LNG supports a floor under prices, near-record US production keeps a ceiling on them. Lower 48 output reached records of 113.3 Bcf/d in August and September, according to LSEG data, before Hurricane Isaias and pipeline outages trimmed October volumes. The EIA expects US dry gas production to average 112.2 Bcf/d in 2026 and 116.1 Bcf/d in 2027, with the Permian and Haynesville basins providing most of the growth. Much of the Permian’s gas is a by-product of oil drilling, which high oil prices since the war have encouraged, and Enverus counts 4.7 Bcf/d of new Permian pipeline capacity due between Q4 2026 and Q1 2027.
Producers are responding to price. The number of rigs drilling for gas reached 135 in late September and was 133 in the week to October 16, according to Baker Hughes. “Haynesville and Permian supply is growing ahead of LNG demand and above our initial expectations,” said Jimmy McNamara of Enverus, which cut its 2027 Henry Hub forecast to $3.25 in September. The main risk to this view is a supply shock: Hurricane Isaias shut in 1.26 Bcf/d of offshore Gulf output on October 9, and extreme cold can freeze wells and cut output for days.
Natural Gas Storage Report: Above Average Into Winter
US storage is entering the heating season slightly above normal. The EIA’s weekly natural gas storage report showed 3,567 billion cubic feet (Bcf) of working gas in the week to October 9, 1.3% above the five-year average and 3.9% below last year, after a smaller-than-expected 67 Bcf injection. The EIA expects inventories to reach 3,850 Bcf at the end of October, 2% above average, down from the 7% surplus it expected in May. “Relatively high natural gas inventories entering the winter season provide a cushion for heating demand,” said EIA Administrator Tristan Abbey.
Last winter showed how quickly that cushion can shrink. Withdrawals over the 2025–26 heating season totalled 2,048 Bcf, 5% more than normal, including a record weekly draw of 360 Bcf during Winter Storm Fern, yet storage still ended March at 1,890 Bcf, 3% above average. The thinnest part of the US system today is salt-cavern storage in the South Central region — the gas that can be withdrawn fastest in a cold snap — which was 15.4% below its five-year average on October 9.
Past performance is not a reliable indicator of future results. All historical data, including but not limited to returns, volatility, and other performance metrics, should not be construed as a guarantee of future performance.
AI, Data Centres & Power Demand
Data centres are a genuine new source of gas demand, though estimates of their size vary widely. RBC Capital Markets expects data centres to add about 6.1 Bcf/d of gas demand by 2030 compared with 2024, while Enverus puts the figure at up to 4.1 Bcf/d, of which 2.1 Bcf/d is more certain. In the near term the effect is smaller: the EIA expects the power sector to burn 37.0 Bcf/d of gas in 2026, up from 35.8 Bcf/d in 2025, with electricity demand in the commercial sector, which includes data centres, growing 2.8% a year. “On-site gas generation is being increasingly viewed as a permanent fixture of the digital infrastructure landscape,” said Christopher Louney, commodity strategist at RBC Capital Markets.
Natural Gas Demand Forecast: LNG and Power Drive Growth
The EIA expects total US gas consumption to edge up from 91.9 Bcf/d in 2025 to 92.4 Bcf/d in 2026 and 93.8 Bcf/d in 2027, while LNG exports add 2.5 Bcf/d this year and another 1.0 Bcf/d in 2027. That is not enough to tighten the market. With dry production growing by about 4 Bcf/d a year, the EIA expects storage at the end of 2027 (3,231 Bcf) to be about the same as at the end of 2026 (3,240 Bcf), and gas to keep about 40% of US power generation. That balance is why the EIA and Fitch Ratings both expect lower prices in 2027 than in 2026.
European Natural Gas Prices: TTF at Highest Since 2022
Europe is where the Hormuz shock hits hardest. The Dutch TTF benchmark closed at €87.55 per MWh on October 16 and traded above €89 on October 19, its highest level since December 2022 and nearly three times its pre-war close of €31.51 on February 27. Asian spot LNG prices rose to $29.30 per MMBtu in the week to October 16, the highest in nearly four years. Qatar exported just 1.6 Mt of LNG in September, less than a quarter of its pre-war monthly average, and has extended force majeure on some deliveries into December.
Past performance is not a reliable indicator of future results. All historical data, including but not limited to returns, volatility, and other performance metrics, should not be construed as a guarantee of future performance.
Europe also enters winter with low stocks. EU storage was about 74.5% full on October 17, against a five-year average of about 89% and 82.8% a year earlier, and the EU’s ban on Russian LNG under long-term contracts takes effect on January 1, 2027. “European gas storage remains a concern, at just under 75% full, well below the five-year average of 89%,” ING said on October 15, raising its forecast for the winter average to €73/MWh from €65. Most banks expect TTF to ease in 2027 as Gulf supply recovers — Goldman Sachs sees about €32 from 2027 — but Goldman’s risk case puts TTF at €105/MWh by year-end if Gulf LNG stays constrained.
For Henry Hub, Europe’s shortage matters mainly through LNG: it keeps US export plants running flat out. But because exports are capped by plant capacity, Fitch Ratings left its Henry Hub assumptions unchanged in September while sharply raising its TTF assumptions, and the gap between the two benchmarks was about $25 per MMBtu on October 16.
How to Trade and Invest in Natural Gas
Natural Gas Technical Analysis: Henry Hub Levels to Watch
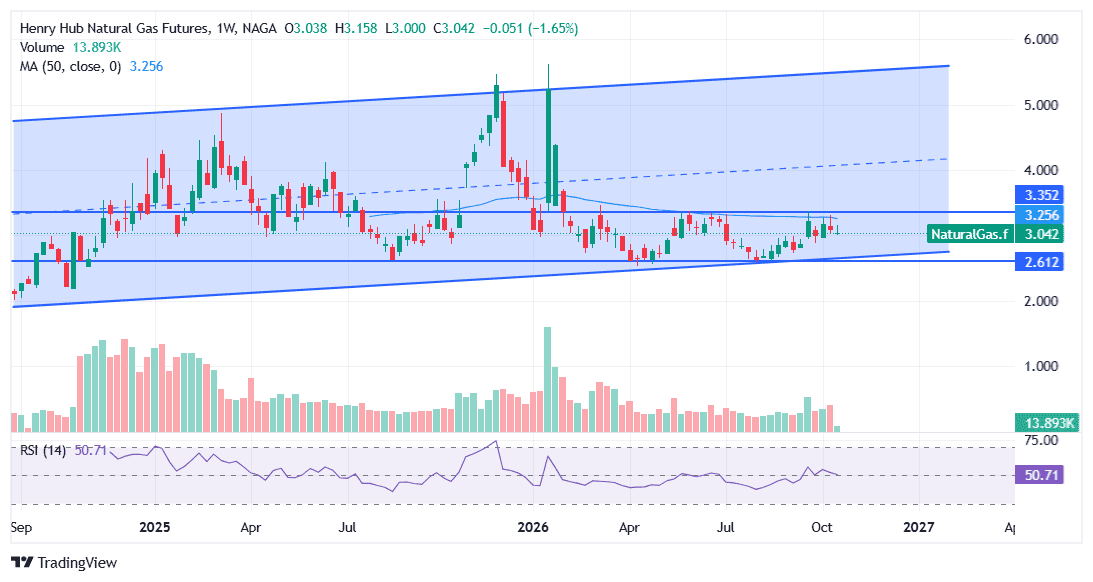
On the weekly chart, US Natural Gas front-month futures show a rising channel that began at the February 2024 low: a support line drawn through that low ($1.58) and the April 2026 low ($2.52) held again on August 6, when the September contract settled at $2.64. The line rises by about 43 cents a year and sits near $2.73 in mid-October, rising to about $2.82 by the end of 2026. January’s spike to $7.46 was a short-lived blow-off far above the channel, and the market has spent the months since building a base in the lower part of the range.
The key level now is $3.30–3.40, where the September and October highs ($3.30 and $3.28 settlements, with about $3.33 intraday in October) meet the 50- and 100-week moving averages ($3.30 and $3.38). A weekly close above it would break the two-month range and bring the channel midline and the 61.8% retracement of the 2024–26 rally, at $3.82–4.00, into view, with the March 2025 high at $4.41–4.65 beyond. Below, the $3 area has turned from resistance in August and September to support since late September, with the 200-week average ($2.95) and the November contract’s August–September lows ($2.90) at $2.90–2.95. A weekly close below the rising trendline, near $2.73 and climbing, would break the channel that has held since 2024 and expose the 2026 lows of $2.52–2.64.
Momentum is neutral. The weekly RSI is around 52, and the weekly MACD turned positive below zero in late August, a sign of basing rather than a new uptrend, while the monthly MACD is still unwinding January’s spike. Seasonality is a tendency, not a floor: over the past 17 winters, December–February Henry Hub spot prices (EIA) averaged a median 9% more than the preceding April–October, but five winters were cheaper than the summer before. “We’re still in this massive basing pattern at the moment, and I don’t think that’s changed, at least not quite yet,” FXEmpire analyst Christopher Lewis wrote on October 2. As Frank Walbaum puts it in the Q4 2026 Market Outlook, the market “should be approached with an expectation of elevated volatility rather than a smooth directional trend.” The levels above are technical reference points, not price forecasts.
Past performance is not a reliable indicator of future results. All historical data, including but not limited to returns, volatility, and other performance metrics, should not be construed as a guarantee of future performance.
Key Technical Levels — Henry Hub (NGAS)
Level (US$/MMBtu, futures) | Significance | What it would signal |
|---|---|---|
$4.41–4.65 | March 2025 high ($4.49), 50% retracement of the 2024–26 rally and 38.2% of the 2026 decline | A weekly close above would bring the December 2025 high ($5.29) and the upper channel line (~$5.19) into view |
$3.82–4.00 | Channel midline (~$3.96) and 61.8% retracement of the 2024–26 rally | A return to the middle of the long-term channel |
$3.30–3.40 | Key pivot: September–October highs and the 50- and 100-week averages ($3.30, $3.38) | A weekly close above would break the two-month range upward |
$3.00–3.07 | ⬤ Current area (about $3.07 intraday on October 19): $3 pivot and 61.8% retracement of the 2024–December 2025 rally (intraday basis) | Support since late September, after capping prices in August and September |
$2.90–2.95 | 200-week average ($2.95) and the November contract’s August–September lows ($2.90) | A break would turn the main trend down, according to FXEmpire analyst James Hyerczyk |
~$2.73; $2.52–2.64 | Rising trendline from the 2024 low; 2026 lows (April $2.52, August $2.64) | A weekly close below the trendline (about $2.73 in mid-October and rising) would break the channel that began in 2024 |
$1.58 | 2024 low, the lowest front-month settlement since 2020 | The base of the long-term channel |
These levels are technical reference points, not price forecasts.
To learn more about technical analysis, visit NAGA Academy.
Will Natural Gas Prices Go Up This Winter?
The futures market prices only a modest winter rise. On October 16 the December 2026 contract settled at $3.386 and January 2027 at $3.759, the winter peak, before the curve falls back to about $2.56–2.60 for April and May 2027. The premium of December over November has been unusually narrow — a record low of about 28 cents on October 7 and 27 cents on October 16 — a sign that traders see limited winter risk, and the EIA’s forecasts are similar: $3.30 in Q4 2026 and $3.47 in Q1 2027. A cold December or January could still lift prices quickly, as in January 2026, but NOAA expects a strong El Niño, which favours a milder winter across much of the northern US.
Past performance is not a reliable indicator of future results. All historical data, including but not limited to returns, volatility, and other performance metrics, should not be construed as a guarantee of future performance.
Will Natural Gas Prices Go Down in 2027?
A softer spring is widely expected, but not a collapse. The EIA sees Henry Hub at $2.64 in Q2 2027, and the futures curve prices April 2027 at $2.56. A mild winter would leave more gas in storage and could pull prices back toward the 2026 lows of $2.52–2.64, and Enverus expects supply growth to outpace new LNG demand through 2027. The EIA expects prices to climb again to $3.49 in Q4 2027 and $3.90 in December 2027.
Natural Gas Price Predictions 2026–2027: Institution Forecasts
Here are the latest natural gas price predictions from the EIA, banks and other forecasters, published between August and October 2026 unless stated. Most see Henry Hub at $3.15–3.50 into 2027. Forecasts for Europe’s TTF are far more spread out, reflecting uncertainty over how fast Gulf LNG returns.
Forecaster | Henry Hub forecast (US$/MMBtu) | Date |
|---|---|---|
EIA (Short-Term Energy Outlook) | Q4 2026 $3.30; 2026 $3.48; 2027 $3.16 | October 6, 2026 |
Fitch Ratings | 2026 $3.50; 2027 $3.25; 2028 $3.00; long term $2.75 (per Mcf) | September 2026 |
Enverus | 2027 $3.25 (from $3.50) | September 23, 2026 |
Bank of America (press reports) | H2 2026 $3.80; 2027 $4.00 | August 6, 2026 |
Citi | Q3 2026 $2.90 | September 3, 2026 |
Morgan Stanley | Q4 2026 $3.75; 2026 about $3.40 | June 4, 2026 |
IMF (futures-based) | 2026 $3.1, rising to $3.6 in 2031 | October 13, 2026 |
Dallas Fed Energy Survey (executives) | End-2026 $3.29; in 2 years $3.82; in 5 years $4.28 | September 30, 2026 |
Median (calculated) | 2027: $3.25 (EIA, Enverus, Bank of America; Fitch Ratings quotes per Mcf) | October 19, 2026 |
Past performance is not a reliable indicator of future results. All historical data, including but not limited to returns, volatility, and other performance metrics, should not be construed as a guarantee of future performance.
EIA Natural Gas Price Forecast: $3.16 for 2027 (October 2026)
The US Energy Information Administration’s October Short-Term Energy Outlook (October 6) expects Henry Hub to average $3.48/MMBtu in 2026 and $3.16 in 2027, with $3.30 in Q4 2026 and $3.47 in Q1 2027. Its 2027 forecast is down from $4.59 in January and was cut in each of the last three outlooks; in August the EIA cited robust production and lower LNG feedgas demand. “Ample natural gas inventories, relative to the previous five-year average, limit upward price pressures in our forecast,” the EIA said. It expects prices to dip to $2.60 in April and May 2027 before rising to $3.90 in December 2027. The next outlook is due on November 10.
Past performance is not a reliable indicator of future results. All historical data, including but not limited to returns, volatility, and other performance metrics, should not be construed as a guarantee of future performance.
Goldman Sachs, ING and Rabobank: TTF Price Forecasts
The big banks’ recent gas calls focus on Europe. Goldman Sachs raised its Q4 2026 TTF forecast to €70/MWh from €53 in September and reiterated it on October 13, flagging upside risks; its risk case, if Gulf LNG stays constrained, sees TTF at €105/MWh and Asian LNG at $35/MMBtu by year-end. Goldman now expects Hormuz LNG flows to normalise in February 2027, and TTF to fall to about €44 in Q1 2027 and about €32 from 2027. ING raised its forecast for the winter 2026–27 average to €73/MWh from €65 on October 15, and Rabobank expects €72 in Q4 2026, €58 in Q1 2027 and the mid-€40s for 2027 as a whole.
Bank of America, Citi and Morgan Stanley Gas Forecasts
Bank of America is the most bullish on US gas among recent forecasts. It raised its Henry Hub forecast for the second half of 2026 to $3.80 from $3.60 in August and expects $4.00 in 2027, citing strong LNG feedgas demand and new export trains, according to press reports; in September it lifted its Q4 2026 TTF forecast to €100/MWh. Citi is at the other end: in early September it put Henry Hub at $2.90 for Q3 2026, citing production growth, and TTF at €56 in Q4 and €41 in 2027, arguing that European prices may be pricing in too much risk. Morgan Stanley’s latest public figures, from June, are $3.75 for Q4 2026 and about $3.40 for 2026; “we do see oversupply risks into 2027,” wrote analyst Devin McDermott.
Fitch Ratings and Enverus: $3.25 for 2027
Fitch Ratings kept its Henry Hub price assumptions unchanged in September at $3.50 per thousand cubic feet (Mcf) for 2026, $3.25 for 2027, $3.00 for 2028 and $2.75 over the long term (1 Mcf is about 1.04 MMBtu), because US export plants have little room to send more gas abroad. It raised its TTF assumptions sharply, to $17/Mcf for 2026 and $11 for 2027, noting that the Strait of Hormuz carried about a fifth of global LNG and that EU storage was only two-thirds full. Enverus also sees $3.25 for 2027, after cutting its forecast from $3.50 on September 23 because supply growth is outpacing new LNG demand.
Producers expect higher prices over time. Energy executives surveyed by the Dallas Fed in September expect Henry Hub at $3.29 at the end of 2026, $3.82 in two years and $4.28 in five years. The IMF’s October World Economic Outlook, which uses futures prices, assumes $3.1 in 2026 rising to $3.6 in 2031.
AI-based Natural Gas Forecasts 2026
Algorithm-based forecast sites see a flatter path than the futures curve. LongForecast projects Henry Hub averaging $3.15 in November and $3.27 in December 2026, $3.43 in January 2027 and $3.65 in December 2027 (October 19 update). These models extrapolate past prices rather than modelling weather, storage or LNG flows, so their numbers change often.
Natural Gas Forecast for 2030 and Beyond
The EIA’s Annual Energy Outlook 2026, published in April, expects Henry Hub to rise through the early 2030s, “remaining between $5/MMBtu and $6/MMBtu at the Henry Hub benchmark in most cases,” and to decline after 2040. Wood Mackenzie warned in July that the decade of cheap US gas is ending and sees prices around $5 by 2035, as demand from power plants and data centres grows faster than supply. “With supply less responsive to price signals than it once was, prices will need to go higher and stay higher,” said Wood Mackenzie’s Dulles Wang.
Not everyone expects a structurally higher price. Fitch Ratings assumes $3.00 per Mcf in 2028 and $2.75 over the long term, and the futures market prices 2028–2030 at about $3.65–3.70. The IMF’s futures-based assumptions have Henry Hub at $3.6 in 2031, while energy executives surveyed by the Dallas Fed expect $4.28 in five years. In Europe, Goldman Sachs expects a wave of new LNG supply to bring TTF down to an average of about €19/MWh in 2030–35.
Long-term forecasts therefore run from below $3 to about $6. The main variables are how fast US LNG capacity grows after 2027, how much gas data centres actually burn, how quickly production from the Permian and Haynesville grows, and how fast renewables and batteries take share in power generation.
When looking for future gas price predictions and attempting to assess the long-term outlook for natural gas prices, bear in mind that analysts’ forecasts can be wrong. Analysts’ projections are based on making fundamental and technical studies of the asset’s performance, but past performance never guarantees future results.
Always do your own research and remember that your decision to trade depends on your attitude to risk, your expertise in this market, the spread of your investment portfolio, and how comfortable you feel about losing money. Never invest more money than you can afford to lose.
Natural Gas Price History
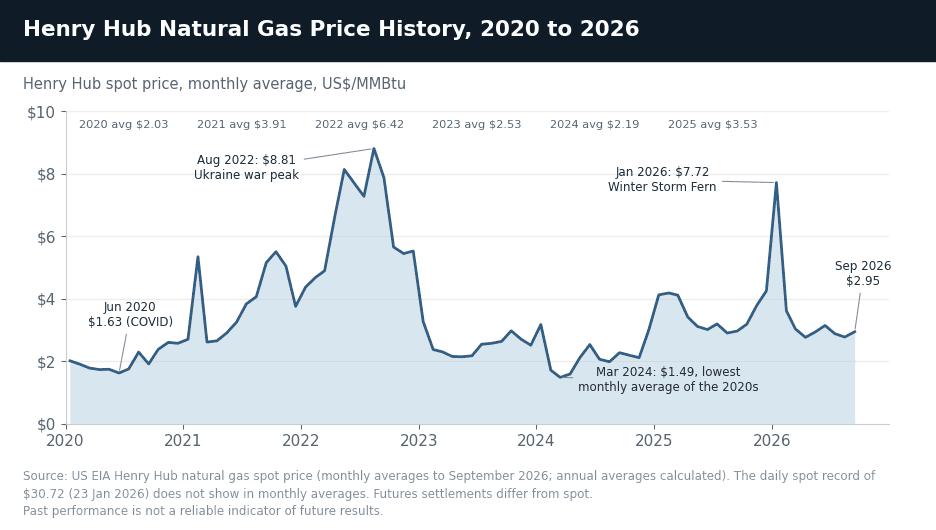
Henry Hub prices have traced an extraordinary arc since 2020: from a monthly average of $1.63/MMBtu in June 2020 to $8.81 in August 2022, when the war in Ukraine set off a global gas crisis, back down to $1.49 in March 2024, the lowest monthly average of the 2020s, and up again to $7.72 in January 2026 during Winter Storm Fern. Prices in this section are EIA Henry Hub spot averages unless stated.
Past performance is not a reliable indicator of future results. All historical data, including but not limited to returns, volatility, and other performance metrics, should not be construed as a guarantee of future performance.
2020–2021: COVID Low & Recovery
Henry Hub averaged $1.63/MMBtu in June 2020, as COVID-19 crushed industrial demand, and hit a daily low of $1.33 in September 2020. Prices recovered strongly in 2021, averaging $3.91/MMBtu, almost double 2020’s $2.03, as demand rebounded, LNG exports grew and supply lagged. Winter Storm Uri briefly sent the spot price to $23.86 in February 2021, a record at the time.
2022: Ukraine Spike to $9.85/MMBtu
Russia's invasion of Ukraine in February 2022 and the resulting European gas crisis drove the Henry Hub spot price to a 14-year high of $9.85/MMBtu on August 22, 2022 (front-month futures settled at a peak of $9.68 the same day), the highest since 2008. European TTF futures hit a record €345/MWh in March 2022 and traded above €300 again in August as the continent scrambled to replace Russian pipeline gas with LNG. US prices averaged $6.42/MMBtu for 2022, the highest annual average since 2008, before falling sharply from September as mild weather returned.
2023: Oversupply Crash Below $2
A severe oversupply emerged in early 2023 as production hit records and a mild winter left storage 19% above the five-year average at the start of April. Henry Hub averaged $3.27 in January 2023 and fell below $2/MMBtu in March ($1.93 on March 21) for the first time since 2020, before averaging $2.53 for the full year. Front-month futures settled below $2 for the first time that year on March 29. The storage surplus built through 2023 kept a lid on prices into 2024.
2024–2025: LNG Ramp and Gradual Recovery
Prices bottomed in 2024: front-month futures settled as low as $1.58 in February and March 2024, their lowest since 2020, and spot averaged $2.19 for the year. Recovery followed as Plaquemines LNG and Corpus Christi Stage 3 ramped up and US LNG exports grew about 27% in 2025, to 15.1 Bcf/d. A January 2025 cold snap briefly sent the spot price to $9.86, futures peaked at a $5.29 settlement in December 2025, and Henry Hub averaged $3.53/MMBtu for 2025.
2026: Winter Storm Fern, Then a Shoulder-Season Slump
Winter Storm Fern produced a record weekly gain of about 70% in front-month futures in January 2026. The Henry Hub spot price hit an all-time daily record of $30.72 on January 23, the January average reached $7.72/MMBtu, the highest since September 2022, and futures settled at $7.46 on January 28. Prices fell as soon as the cold passed: spot first dipped below $3 on February 18, and futures settled at a 2026 low of $2.52 on April 24. Since the Iran war began on February 28, Henry Hub has stayed in a range of about $2.50–3.40 while European and Asian prices soared, because US LNG plants were already running near capacity.
In the autumn, prices firmed on cooler weather and Hurricane Isaias, which shut in up to 1.26 Bcf/d of offshore Gulf output in early October, before mild forecasts pulled the November contract back to $3.116 on October 16 and about $3.07 on October 19, a two-week low.
Sources:
- EIA Short-Term Energy Outlook: Natural Gas — October 6, 2026
- EIA Weekly Natural Gas Storage Report
- EIA Today in Energy: Corpus Christi LNG expansion — September 15, 2026
- IEA Gas Market Report, Q3-2026
- American Gas Association — Natural Gas Market Indicators, October 16, 2026
- NOAA — U.S. Winter Outlook, October 15, 2026
- Fitch Ratings gas price assumptions (Trend) — September 23, 2026
- Enverus: Henry Hub forecast cut to $3.25 — September 23, 2026
- ING: Volatile winter as Persian Gulf LNG stays scarce (FXStreet) — October 15, 2026
- Dallas Fed Energy Survey, Q3 2026
- IMF World Economic Outlook, October 2026
- EIA Annual Energy Outlook — Natural Gas Narrative
- CME Group — Henry Hub Natural Gas Futures
- FRED / St. Louis Fed — Henry Hub Natural Gas Spot
Other Resources:
- Oil Forecast & Price Predictions 2026
- Gold Forecast & Price Predictions 2026
- Dow Jones Forecast & Price Predictions 2026
- Nasdaq-100 Forecast & Price Predictions 2026
- EurUsd Forecast & Price Predictions 2026
- Turkish Lira Forecast & Price Predictions 2026
- British Pound Forecast & Price Predictions 2026
- Silver Forecast & Price Predictions 2026
- IBEX 35 Forecast & Price Predictions 2026