


The Dow Jones Industrial Average (DJIA) index rose over 7% in the first half of the year, climbing from around 42,660 at the January open towards 52,000 in June. The index validated the 51,300 Fibonacci extension target from our earlier Dow Jones analysis and price predictions.
Why has the Dow been rising? Three forces have driven the 2026 advance: continued AI investment momentum — Nvidia surged on its new PC processor launch in June, driving also Dell and HP; resilient corporate earnings, with Goldman Sachs projecting 12% S&P 500 EPS growth for full-year 2026; and expectations of eventual Fed easing that have supported equity valuations despite the current pause.
What is the risk now? The Dow's 2026 rally has encountered a structural complication absent from earlier forecasts: the US-Iran military conflict that escalated in February–March 2026. Brent crude surged, supercharging inflation expectations and causing the Fed to pause its easing cycle. Markets now assign roughly 50% probability to at least one rate hike by year-end — a stark reversal from the rate-cut narrative that drove the 2025 rally. The index also trades at approximately 22.2x forward earnings, a level seen only during the dot-com bubble and the COVID-19 pandemic.
Key Dow Jones Forecast & Price Predictions - Summary
- Dow Jones forecast H2 2026: divergence suggests a near-term pullback toward 50,000–50,517 before any renewed push toward 53,000. Key catalysts: Fed July meeting, Q2 earnings season (Nvidia, Goldman Sachs, Caterpillar), and Iran ceasefire developments.
- BASE CASE (50%) — 50,000–53,000: Dow grinds toward the 53,000 Fibonacci target in H2 as Iran ceasefire talks advance and earnings hold at 8–12% EPS growth. The 50,000 level is the critical support floor. Wall Street median year-end target: ~52,000–52,500.
- BULL CASE (25%) — 53,000–56,000: A US-Iran ceasefire removes the oil-inflation headwind, the Fed cuts at least once in H2, and AI earnings beats drive multiple expansion past 53,000 toward 55,000–56,000.
- BEAR CASE — 45,000–48,000: Sustained oil above $95/barrel forces a hawkish Fed pivot, earnings disappoint vs. the 8–12% EPS consensus, or a risk-off event triggers a 10–20% correction. Below 50,000 opens 45,000–40,500.
- Dow Jones price prediction 2027: Analysts broadly expect the Dow to target 57,000 by end-2027 as the Fed resumes its easing cycle, corporate earnings grow at roughly 10% annually, and AI-driven productivity gains begin to broaden beyond technology into industrials, financials, and healthcare. The pace of recovery from any 2026 correction will be the key variable.
- Dow Jones price prediction for the next 5 years: Long-term forecasts are tilted firmly bullish. Ed Yardeni targets 60,000 by 2030 at approximately 7% annual growth, consistent with the Dow's 30-year historical average. The main long-term risk is a structural earnings slowdown or a prolonged fiscal crisis — neither of which is the base case.
With NAGA.com, you can trade Dow Jones through CFDs if you want to speculate on price movements or invest in Dow stocks or ETFs.
Dow Jones Forecast 2026 – H2 Fundamental Outlook
The Dow has lagged both the S&P 500 (+10.6% YTD) and the Nasdaq (+12.2% YTD) in 2026 — a reversal from late 2025 when the Dow briefly led. This relative underperformance reflects the Dow's heavier cyclical and financial exposure, which has been hit harder by the Fed's rate-hold and the oil shock from the Iran conflict.
The Iran-War paradox: the single biggest swing factor
The US-Iran conflict escalating in February–March 2026 has created an unusual dynamic: the very event that should trigger equity safe-haven selling is simultaneously stoking inflation and keeping the Fed pinned. Brent surged to $119.25/barrel on March 9, its highest since 2022, before stabilising near $90. This supercharged inflation expectations, causing the Fed to pause its easing cycle and markets to briefly price in a rate hike.
The paradox is that a resolution would be sharply bullish. An Iran ceasefire reopening the Strait of Hormuz would push oil lower, reduce inflation pressure, free the Fed to cut, and restore risk appetite. US and Iranian diplomats were revising a draft ceasefire as of May 31–June 1. This binary outcome is the single biggest swing factor for the Dow in Q3 2026.
Federal Reserve: the next move Is everything
The Fed cut rates three times in late 2025, bringing the funds rate to 3.75%. Two projected 2026 cuts did not materialise. Markets now assign ~50% probability to at least one hike by year-end — a stark reversal. The key Fed dates for H2: July 30, September 17, and November 5 FOMC meetings. Any dovish signal — even a pause with a cut-leaning bias — would re-rate Dow financials and cyclicals sharply higher. A hike would accelerate the bear case.
Corporate earnings: still the bedrock
Goldman Sachs projects 12% S&P 500 EPS growth for 2026 (~$305/share). AI demand has driven 40%+ of year-to-date EPS revisions. The critical Q2 2026 earnings reports arrive in July: Nvidia (AI hardware), Goldman Sachs (M&A and SpaceX IPO revenues), Microsoft (Azure AI), and Caterpillar (global CapEx). A collective beat would validate the bull case; a miss at current 22.2x forward earnings would trigger multiple compression.
Valuation Risk: No Margin for Error
The Dow's components trade at approximately 22.2x forward earnings — a level seen historically only during the dot-com bubble and COVID-19 recovery. JPMorgan cut its S&P 500 year-end target to 7,200 in March 2026 citing oil shock and recession risk, with a downside scenario of 6,000 (~41,000 Dow). High valuations make the index unusually sensitive to any earnings or macro disappointment in H2.
Dow Jones Forecast 2026 – H2 Technical Outlook
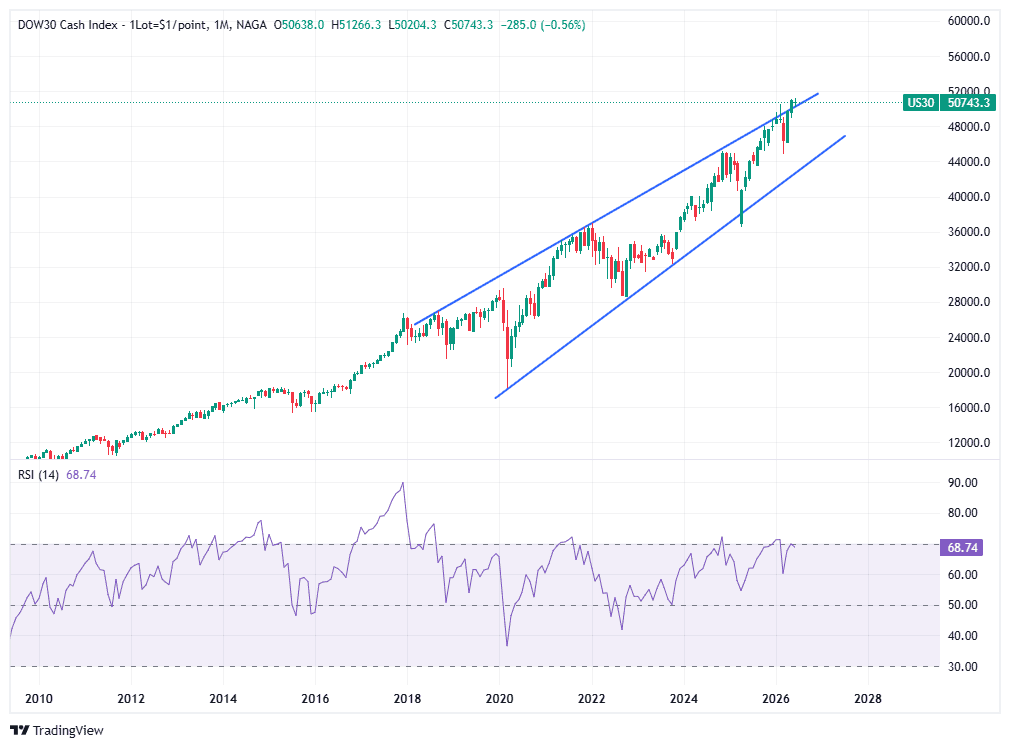
The Dow's daily, weekly, and monthly charts tell the same consistent story: the Dow Jones is trading at the upper boundary of a well-defined ascending channel/rising wedge and has just broken above it into new all-time high territory. The structure is intact, and momentum is positive, though upper-band breakouts historically invite brief consolidation or a pullback to retest the breakout level before the next leg higher.
Rising Wedge/Ascending Channel — caution at the highs
The Dow has respected a rising parallel channel since the 2020 lows, with the upper band now converging near 51,500–52,000. This pattern historically raises the probability of a corrective move as price approaches the upper boundary — exactly where the Dow sits now. Monthly RSI remains elevated, consistent with conditions that preceded past 10–20% corrections.
Past performance is not a reliable indicator of future results. All historical data, including but not limited to returns, volatility, and other performance metrics, should not be construed as a guarantee of future performance.
A bullish breakout of the upper band could targets the channel extension above, consistent with the 53,000 Fibonacci projection, as long as price holds above the previous swing high — now acting as the new support level near 50,000–50,500 — the technical bias remains firmly bullish toward 53,000 and beyond.
Key Technical Levels for H2 2026
Level Price Technical Significance Extended Bull Target 54,578–55,694 Secondary Fibonacci extensions; bull scenario upper range Primary Bull Target 53,000–53,214 Key Fibonacci extension from Apr 2025 low; main H2 bull objective ⬤ Current / ATH 51,500–51,657 New ATH Jun 4, 2026; must hold above 51,000 to sustain bull momentum Support 1 (Critical) 50,000–50,517 Psychological level; prior ATH; 4H MA50 zone — bull/bear line in the sand Support 2 48,000–48,285 December 2025 close; intermediate trend support Bear Target 1 45,000–46,890 Primary uptrend support; first bear target on a 50,000 breakdown Bear Target 2 (Severe) 40,500–42,116 Fibonacci retracement; JPMorgan downside scenario zone Past performance is not a reliable indicator of future results. Technical levels are analytical reference points, not guaranteed price targets.
Will the Dow Jones rise in the coming months?
The base case (50% probability) supports a continued grind higher toward 52,000–53,000 through year-end 2026, driven by AI earnings momentum, eventual Fed easing, and broadening market participation. The primary conditions required: Iran ceasefire progress that reduces oil prices and revives rate-cut expectations; Q2 earnings from Nvidia, Goldman Sachs, Caterpillar, and Microsoft that meet or beat the 8–12% EPS consensus; and the Dow holding above the critical 50,000 support level on any near-term pullbacks.
Will the Dow Jones fall in the coming months?
The bear case (25% probability) centres on three triggers: oil sustaining above $95/barrel (forcing a hawkish Fed pivot), a meaningful earnings miss in Q2 2026 (particularly from Nvidia or Goldman Sachs), or an Iran conflict escalation driving broad risk-off. Technically, a sustained close below 50,000 would target 45,000–48,000. JPMorgan's downside scenario projects the S&P 500 at 6,000 — equivalent to approximately 41,000–42,000 on the Dow. A correction of this magnitude would bring the index back to where it traded just 12–18 months ago, not to a historical collapse.
Dow Jones Price Predictions from Banks & Experts
The median year-end S&P 500 forecast from 21 Wall Street institutions stands at 7,650, implying roughly 8% additional upside from June 2026 levels and 11.8% full-year gains — above the 30-year historical average. Note that Goldman Sachs data shows Wall Street's median year-end forecast missed actual S&P 500 returns by an average of 18 percentage points between 2020–2024. These targets are directional guides, not precision instruments. DJIA equivalents derived from S&P 500 targets using forward EPS multiples:
Institution DJIA Target (Year-End 2026) Bias Key Thesis Deutsche Bank ~54,000 Bullish S&P 8,000; policy tailwinds and fiscal stimulus; most bullish major bank Oppenheimer ~53,500 Bullish S&P 8,100 — highest on the Street; AI and earnings optimism Morgan Stanley ~52,700 Bullish S&P 7,800; broadening earnings beyond mega-cap tech Wells Fargo ~52,700 Bullish S&P 7,800; solid US GDP and consumer spending Goldman Sachs ~52,300 Bullish S&P 7,600; 12% EPS growth; AI broadening to traditional sectors Citigroup ~52,000 Bullish S&P 7,700; AI and fiscal impulse Ed Yardeni ~52,000 Bullish S&P 7,700; strong earnings; assigns only 20% recession odds for 2026 UBS ~52,000 Bullish S&P 7,700; growth acceleration; Fed eventual pivot Wall Street Median (21 firms) ~52,000–52,500 Neutral/Bull S&P median 7,650; implies 11.8% full-year 2026 gain JPMorgan Revised Down ~49,000–51,000 Neutral S&P cut to 7,200 (Mar 2026) on oil shock risk; downside scenario at 6,000 (~41,000 Dow) Bank of America Most Cautious ~50,500–51,000 Neutral S&P 7,100; only 3–5% upside from current levels; most conservative on the Street Source: Goldman Sachs, JPMorgan, Deutsche Bank, Morgan Stanley, Wells Fargo, Citigroup, UBS, Bank of America, Ed Yardeni Research, CNBC. DJIA estimates are derived from S&P 500 targets using forward EPS-adjusted multiples. Forecasts reflect publicly available information as of early June 2026. Targets change frequently — verify current positions with official sources.
Dow Jones Price Prediction 2026 from AI-Based Websites
WalletInvestor maintains a bullish technical outlook targeting 53,717 by year-end based on chart momentum. Long Forecast's cycle model projects 64,542 by end-2026 — the most aggressive scenario, well outside institutional consensus. Trading Economics projects near 46,878 by end-Q3 and 42,639 in 12 months based on macro models — the most bearish outlier. CoinPriceForecast projects 50,000 by end-2027, 60,000 by late 2029, and above 70,000 near 2031.
Dow Jones Components: Top 10 by Weight (Mid 2026)
The DJIA is price-weighted — a stock's influence is determined by its share price, not market capitalisation. Every $1 change in any component's price moves the Dow by approximately 6.6 points. The top 10 components below account for roughly 59% of the total index weight.
# Company Ticker Weight Outlook 1 Goldman Sachs GS 13.05% Bullish — SpaceX IPO 2 Caterpillar CAT 11.23% Neutral — CapEx cycle watch 3 Microsoft MSFT 5.11% Bullish — Azure AI monetisation 4 UnitedHealth Group UNH 4.73% Bullish — defensive quality 5 Amgen AMGN 4.13% Neutral — biotech pipeline 6 Visa V 3.82% Bullish — payments volume growth 7 American Express AXP 3.73% Bullish — premium consumer spend 8 Apple AAPL 3.72% Neutral — iPhone cycle, AI features 9 JPMorgan Chase JPM 3.71% Neutral — yield curve watch 10 Home Depot HD 3.70% Neutral — housing market sensitivity Weights and prices from Slickcharts, June 4–5, 2026. The Dow divisor as of June 2026 is approximately 0.152, meaning every $1 change in any component's share price moves the index by ~6.6 points. Goldman Sachs alone (13.05% weight, ~$1,092) has more than 5× the index influence of Nvidia (2.61%, ~$218).
Best Dow Jones Stocks for H2 2026
With the index at all-time highs and near-term technical caution, stock selection within the 30 components matters. Below are the key names for Q3–Q4 2026 by analyst consensus, upcoming catalysts, and thematic positioning:
Stock Price (Jun 4) Outlook Key H2 2026 Catalyst Nvidia (NVDA) ~$218–225 Bullish New PC processor launch; analyst consensus target $305; Mizuho top semiconductor pick; AI capex cycle Goldman Sachs (GS) ~$948–1,092 Bullish SpaceX IPO lead underwriter; M&A cycle revival; highest-weighted Dow component Microsoft (MSFT) ~$428 Bullish Azure AI monetisation; Copilot pricing power; Wedbush top-5 pick for 2026 3M (MMM) ~$148 Bullish Litigation resolution progress (+3.7% Jun 4); Dogs of the Dow dividend + recovery play Johnson & Johnson (JNJ) ~$228 Bullish Defensive anchor; pharma pipeline; consistent dividend; top-3 Dow contributor in 2025 Nike (NKE) Market price Contrarian FIFA World Cup + Winter Olympics; CEO Hill product turnaround; Dogs of the Dow dividend Caterpillar (CAT) ~$940 Neutral Global CapEx + AI data centre construction; watch for China/order slowdown risk in H2
Key Factors That Will Drive the Dow Through September 2026
Factor Bull Impact Bear Impact Iran ceasefire / escalation Deal → oil lower → Fed free to cut → Dow rallies Escalation → oil spike → rate-hike bets → risk-off Fed FOMC (Jul 30 / Sep 17) Any cut signal → re-rating of financials and cyclicals Rate hike → broad selloff; financials hardest hit Q2 Earnings (July) 8–12% EPS beat → validates bull case; Nvidia, GS pivotal EPS miss → multiple compression at 22.2x PE Oil (Brent crude) Drop to $70–$75 → inflation normalises; equities re-rate Sustained ≥$95 → inflation shock; rate-hike scenario AI capex signals Hyperscaler capex beats → Nvidia, Microsoft, Cisco surge Capex pullback → Dow tech components fall sharply US Dollar (DXY) DXY weakens → multinationals' overseas earnings boosted Dollar rallies (hawkish Fed) → Dow exporter headwind Debt ceiling / fiscal cliff Resolution reduces uncertainty Brinkmanship → Q3 volatility spike
What is the Dow Jones index and how does it work?
Dow Jones Price Prediction 2026–2030
The near-term uncertainty from the Iran conflict and Fed policy does not change the long-term structural bull case for the Dow. Earnings growth, AI productivity gains, and the historical compounding of US blue-chip equity returns support a multi-year advance:
Year Consensus DJIA Range Key Forecast Source Primary Driver End-2026 50,000–54,000 Wall Street median ~52,000–52,500 Scenario-dependent; base case 52,000–53,000 if Iran resolves 2027 50,000–57,000 CoinPriceForecast: 50,000+ by end-2027 Fed easing cycle resumes; earnings growth +10%; AI productivity expands 2028 52,000–60,000 Institutional consensus AI monetisation matures; midterm election volatility offset by earnings 2029–2030 58,000–65,000 Ed Yardeni: 60,000 by 2030 (~7% pa growth) Sustained earnings compounding; CoinPriceForecast: 60,000+ by late 2029
JPMorgan has separately projected that the Dow could reach the 60,000s by the late 2020s in a scenario of sustained US economic outperformance and continued AI-driven productivity growth. Ed Yardeni's base case targets 60,000 by 2030 at approximately 7% annual growth from current levels — broadly consistent with the 30-year historical average of the index.
*It is worth keeping in mind that both analysts and online forecasting sites can and do get their predictions wrong. Keep in mind that past performance and forecasts are not reliable indicators of future returns. When considering Dow Jones price predictions for 2026 and beyond, it's important to keep in mind that high market volatility and macroeconomic environment make it difficult to produce accurate long-term Dow Jones analysis and estimates. As such, analysts and forecasters can get their Dow Jones forecast wrong.
It is essential to do your research and always remember your decision to trade depends on your attitude to risk, your expertise in the market, the spread of your investment portfolio, and how comfortable you feel about losing money. You should never invest money that you cannot afford to lose.
Is Dow Jones a good investment?
The Dow Jones was first traded in May 1896 at 40.94 points. The index now trades above 51,500 — a return exceeding 100,000% over 130 years, averaging approximately 5.7% annually in real terms with dividends reinvested. Over the past 12 months alone the index has returned 21.5%.
Whether the Dow is the right investment for your portfolio depends on your investment horizon, risk tolerance, and existing equity exposure. The bull case strengthens considerably over a 3–5 year horizon. The near-term picture is more nuanced: the Iran situation creates binary volatility, and the 22x forward PE leaves limited room for error. A 15–20% correction from all-time highs would bring the Dow back to 41,000–44,000 — the level it occupied just 12–18 months ago, not a historical disaster, but a meaningful near-term loss from today's price.
The Dow's blue-chip composition provides structural resilience. Underperforming members are replaced by stronger companies — as Nvidia's addition illustrated. That resilience does not eliminate drawdown risk, but it does mean the Dow tends to recover from corrections faster than more speculative indices.
How to invest in Stock Indices
Read Also: Monthly Market Forecasts & Price Predictions
- Euro to Dollar forecast and price prediction 2026
- Pound to Dollar forecast and price prediction 2026
- USD to INR forecast 2026, 2027, 2030
- AED to INR forecast 2026, 2027, 2030
- SAR to INR forecast 2026, 2027, 2030
- Gold forecast and price prediction 2026
- Oil forecast and price prediction 2026
- Nasdaq-100 forecast and price prediction 2026
- Natural Gas forecast and price prediction 2026
- Silver forecast and price prediction 2026