


The NASDAQ-100 tech index price tumbled to roughly 22,953 in late March in a "Liberation Day"-style selloff driven by fresh US tariff threats, before powering back on resurgent AI enthusiasm to a record high just above 30,600.
That momentum now faces a genuine test. On June 17, 2026, the Federal Reserve held its benchmark rate steady at 3.50–3.75% in Kevin Warsh's first meeting as Fed Chair — but the accompanying signals were notably hawkish: nine of eighteen committee members now project a rate hike before year-end, the median dot-plot projection for year-end 2026 jumped to 3.8% from 3.4% in March, and the post-meeting statement removed language signalling any future easing bias.
Tech stocks, which thrive on lower discount rates, sold off on the news. Has the AI-driven rally run its course, or is this simply a pause within the broader bull market? Here is the full picture.
NASDAQ 100 Forecast 2026 — Summary
- NASDAQ-100 price prediction H2 2026: From current levels above 30,000, the path forward depends heavily on whether the Fed's hawkish June signal translates into an actual 2026 hike, and whether AI capex spending can offset a less favourable rate environment.
- BASE CASE ~50% (29,000 – 33,000): AI capex spending remains robust enough to offset the less favourable rate backdrop, but the Fed's hawkish signal caps any acceleration beyond the early-June highs. The index consolidates in a wide range as markets digest whether the projected year-end hike actually materialises.
- BULL CASE ~25% (34,000 – 38,000): Inflation data over the summer surprises to the downside, taking the projected Fed hike off the table entirely, while AI-driven earnings continue to beat expectations across a broadening set of constituents. The index breaks decisively above 31,000 and extends toward the symmetrical-triangle target near 35,000+ that chartists have flagged.
- BEAR CASE ~25% (23,000 – 27,000): The Fed follows through on a 2026 hike as energy-driven inflation proves stickier than expected, compressing valuations for long-duration tech names. A retest of the 200-day moving average near 25,733 — or even a full retest of the March "Liberation Day" low near 22,953 — becomes the dominant scenario if AI capex growth simultaneously shows signs of slowing.
Note: These are illustrative scenarios only, not price targets or investment recommendations. Actual outcomes may differ materially.
- NASDAQ-100 price prediction 2027: Most strategists expect 2027 to hinge on whether 2026's AI capex cycle has produced visible productivity gains and revenue conversion by the names doing the heaviest spending, or whether the market begins to question return on that investment more aggressively. A Fed that has hiked in late 2026 would also be a key input — a higher terminal rate heading into 2027 would mechanically compress the valuation multiples that have supported the index's long-duration growth names through the current cycle.
- Nasdaq-100 forecast for the next 5 years: Since 1990, the NASDAQ-100 has experienced six prior bull markets, each lasting an average of five years and returning approximately 31% annually. Experts, including those at IBM, continue to characterise AI as a multi-year megatrend rather than a cyclical spending bubble, with five-year projections placing the index comfortably above 35,000–40,000 in the most constructive scenarios. The primary structural risk remains the same one flagged a year ago: a "CapEx peak" moment where AI infrastructure spending growth decelerates meaningfully before revenue conversion has caught up.
With NAGA, you can speculate on NASDAQ 100 (NAS100) price movements through CFDs or trade and invest in tech ETFs and stocks.
Nasdaq 100 Fundamental Analysis 2026
The NASDAQ-100's 2026 story is fundamentally a tension between two powerful forces moving in opposite directions: an AI capital expenditure supercycle that shows no signs of slowing, and a monetary policy environment that has turned meaningfully less accommodative than markets expected just months ago.
The Fed's Hawkish Pivot Under Kevin Warsh — What Actually Happened
On June 17, 2026, the Fed held rates at 3.50–3.75%, but the dot plot flipped from a projected cut to a hike, with nine of eighteen members now expecting tightening by year-end and the median projection jumping to 3.8% from 3.4%. The cause is stubborn inflation — May CPI rose 4.2% year-on-year, the worst since April 2023, driven largely by Hormuz-related energy costs — forcing Warsh to defend the 2% target rather than deliver the cuts he was nominated for. Markets reacted fast: two-year yields jumped 16bp to 4.21%, the dollar had its best day in a year, and the Nasdaq Composite fell 1.34%.
Warsh skipped his own dot-plot submission, citing distrust of forward guidance, and used the briefer, 130-word statement to announce five internal task forces rather than offer fresh guidance. For the NASDAQ-100, the stakes are simple: its long-duration growth profile is unusually rate-sensitive, so the real question for H2 2026 is whether AI earnings can keep outrunning this fresh valuation headwind.
AI Capex — Still the Dominant Bullish Force
Despite the more hostile rate backdrop, the structural AI investment cycle shows no clear signs of deceleration. Cloud services, chipmakers, and software companies continue to post double-digit revenue growth, even as the breakneck pace of 2024-2025 moderates somewhat — a normalisation that most analysts view as healthy rather than alarming. Critically, AI leadership has broadened meaningfully beyond the original mega-cap names that dominated earlier in the cycle, now pulling in semiconductor equipment suppliers, data centre infrastructure builders, cybersecurity firms, and automation companies.
This wider participation reduces the concentration risk that made earlier rallies fragile, where a handful of names carried the entire index. Margin pressure from heavy capex remains a live risk for semis and data centre operators specifically, but companies with strong balance sheets are using the spending cycle to widen their competitive moats against weaker rivals — a dynamic that tends to reward index-level exposure over individual stock-picking in this environment.
Regulatory Risk — Still a Wild Card, Not Yet a Crisis
Regulatory scrutiny of major cloud and AI platforms continues to intensify across both the US and the EU, with ongoing antitrust probes representing a persistent overhang. To date, the sector's historical pattern of navigating such pressure without major lasting damage to spending cycles has held, and demand for AI infrastructure has generally proven strong enough to outweigh enforcement-related drags. That said, a meaningfully tougher regulatory crackdown — particularly one targeting the mega-cap names most central to AI capex spending — remains a genuine tail risk that could compound the Fed-related valuation pressure already in play.
Understanding Capital Expenditures (CapEx)
The Magnificent 7 — A Year of Real Divergence
The Magnificent 7 (Nvidia, Apple, Microsoft, Amazon, Alphabet, Meta, Tesla) still holds about a third of the S&P 500 market cap, but 2026 is the first year since the Fed’s 2022 hiking cycle that they’ve genuinely lagged the broader market. Through H1 2026, the group returned just 5.4% versus 7.9% for the S&P 500, with combined profit growth slowing to roughly 18%—the weakest pace since 2022 and barely ahead of the 13% projected for the rest of the index. Investor sentiment has shifted from rewarding AI exposure unconditionally to demanding evidence of AI return on investment rather than just AI spending.
Performance within the group has diverged sharply: Alphabet and Nvidia are standouts, while Microsoft and Tesla are clear laggards, and Meta’s setback came in late 2025 when capex guidance spiked to $72 billion. The Magnificent 7’s concentration risk is easing in 2026 because earnings and performance elsewhere in the index are catching up, broadening the index’s risk profile even as concentrated mega-cap returns fade. Wall Street’s consensus price targets imply roughly 29% average upside across the group over the next 12 months, with Nvidia, Microsoft, and Meta as the clearest winners and Tesla as the most conservatively rated.
NASDAQ 100 Technical Analysis
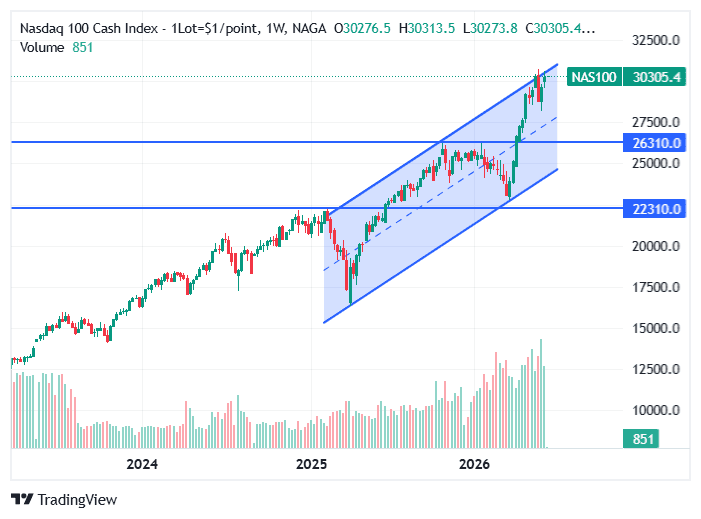
Technically, the NASDAQ-100's 2026 price chart shows two similar, extremely sharp V-shaped recoveries in a row, within the same period of time. The dip below 23,000 during the March "Liberation Day" selloff provided the launchpad for an extraordinary rally that has taken the index to fresh record highs above 30,660 — a gain of more than 33% in roughly ten weeks. The index repeated the price action seen exactly one year ago.
As of the end of H1, the index sits comfortably above both its 50-day moving average (28,149) and 200-day moving average (25,733), with the Relative Strength Index between 60 and 70, indicating sustained but not yet extreme bullish momentum. However, the projected support line of the last 2 selloffs indicates a potential ascending channel with resistance around the 30,500 area (+/- 500 points). Despite the recent semiconductor stock euphoria and underlying AI momentum supporting this leg up, a consolidation at high levels or correction towards the previous swing high around 27,000 is likely within Q3 2026.
Past performance is not a reliable indicator of future results. All historical data, including but not limited to returns, volatility, and other performance metrics, should not be construed as a guarantee of future performance.
Key Technical Levels
LEVEL POINTS SIGNIFICANCE Extended Bull Target 32,500 Fibonacci extension breakout target if the post-tariff-shock rally extends decisively higher 2026 Record High ~30,660 Early June 2026 peak; the level any renewed leg higher must first reclaim and hold above 50-Day Moving Average ~28,149 Near-term dynamic support; a sustained break below would be an early caution signal 200-Day Moving Average ~25,733-26,300 Key longer-term trend support; broadly aligns with the late-2025 year-end level 2026 Low / Bear Floor ~22,953 March "Liberation Day" tariff-shock low; a full retest would represent a serious bull-thesis challenge Past performance is not a reliable indicator of future results. Technical levels are analytical reference points, not guaranteed price targets.
To learn more about technical analysis as a forecasting tool, visit NAGA Academy.
NASDAQ 100 Forecast 2026 — Institutional Predictions
Most bank targets for US equities are published in S&P 500 terms rather than directly for the NASDAQ-100, but since the two indices are tightly correlated, the underlying S&P 500 targets translate into a useful read on institutional sentiment toward tech. Importantly, the targets below were largely set before the April tariff shock and the Fed's hawkish June 17 pivot, so they should be read as a starting framework rather than an up-to-date consensus.
INSTITUTION S&P 500 TARGET / IMPLIED GAIN BIAS KEY DRIVERS Oppenheimer 8,100 (+17.8%) Most bullish major bank AI capex, technology and financials leadership Deutsche Bank 8,000 (+17%) Very bullish Stellar earnings, higher dividend payouts, and subdued inflation Morgan Stanley 7,800-equiv. (+14%) Bullish AI spending plus cyclical recovery broadening beyond mega-caps JPMorgan 7,500 (+10%) Moderately bullish 13-15% EPS growth from the AI supercycle, tempered by policy uncertainty Goldman Sachs 7,600-equiv. (+11%) Moderately bullish Steady momentum into late 2026 on resilient earnings Bank of America 7,100-equiv. (+4%) Most conservative major bank AI capex diverting from buybacks; liquidity tightening risk Ned Davis Research 7,000 (+3.2%) Lowest of 22 firms surveyed Specifically flagged Fed-transition risk: new chairs have historically preceded ~15% average corrections in their first six months
It is worth noting that Wall Street's base setting is consistently bullish: Goldman Sachs alone has missed its own published S&P 500 target in multiple recent years, including 2022, and the broader sell-side has underestimated actual market returns in 2022, 2023, 2024, and 2025 alike. The 2026 NASDAQ 100 forecasts above should be read with this pattern in mind — directionally informative, but not a reliable point estimate, particularly in a year that has already featured a tariff shock and a hawkish Fed transition that few of these forecasts had fully priced in when published.
Magnificent 7 Stocks Forecast & Analyst Price Target
Since the Magnificent 7 carry such outsized weight within the NASDAQ-100, their individual analyst price targets offer a useful forward-looking cross-check on the scenarios above. Based on Wall Street analysts' 12-month price predictions over the last three months, the chart below shows the low, average, and high consensus targets for each stock alongside its current price.
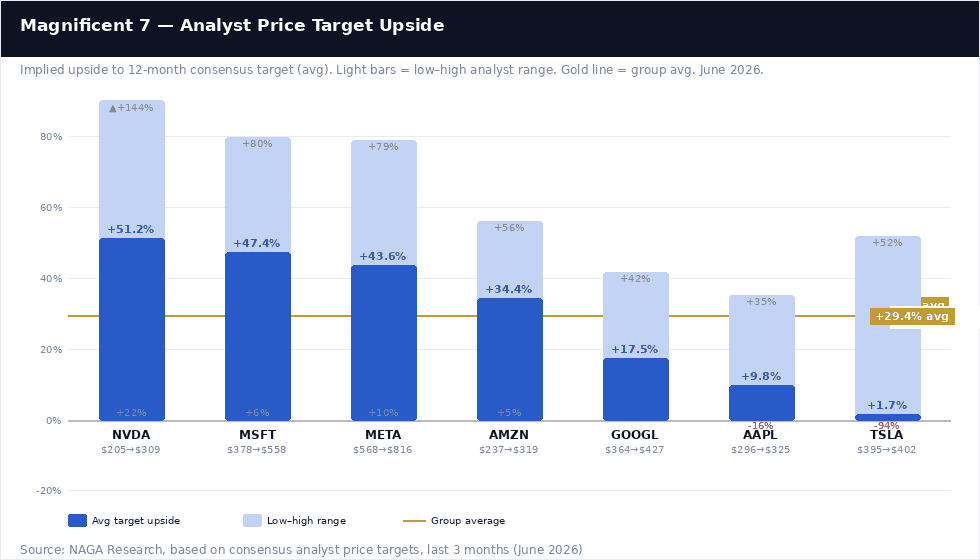
Three names — Nvidia, Microsoft, and Meta — anchor the bullish end of the group, each carrying more than 43% implied upside on continued AI infrastructure and monetisation strength. Amazon sits comfortably above the group average on AWS-driven cloud growth, while Alphabet, Apple, and Tesla round out the group with single-digit-to-high-teens upside, reflecting more cautious analyst views on search/AI competitive dynamics, iPhone-cycle growth, and EV demand, respectively.
Averaged across all seven stocks, Wall Street's consensus puts the group's current price at $349.05 against an average 12-month target of $450.92 — an implied upside of roughly 29.4%.
AI-Based NASDAQ 100 Forecasts — What the Algorithms Say
Algorithmic and AI-driven forecasting platforms were uniformly bullish on the NASDAQ-100 heading into 2026, though — much as with the bank forecasts above — their underlying assumptions have been tested by the year's actual volatility.
MODEL END-2026 TARGET BIAS STATUS Walletinvestor 29,995 – 35,132 (range across models) Bullish Already exceeded on the upside in early June (~30,660 record) GovCapital Within the 29,995 – 35,132 consensus band Bullish Broadly tracking actual price action through Q2 Long Forecast Within the 29,995 – 35,132 consensus band Bullish Consistent with the post-"Liberation Day" recovery rally BingX Research (scenario model) 27,000 (bull) vs. 22,000 (bear) Explicit two-sided scenario framework Published April 2026; bear case (22,000) already tested in March, bull case has since exceeded
The most instructive entry here is the BingX scenario model published in April 2026, which explicitly framed the index's path as a binary outcome: a 27,000 "AI breakthrough" if the Strait of Hormuz ceasefire held and the Fed found room to cut, versus a 22,000 "stagflation trap" if oil stayed elevated and the Fed stayed frozen. In hindsight, the actual path threaded between both scenarios rather than cleanly resolving either way — the index did test the bear case's 22,000-ish zone in late March but then blew through the bull case's 27,000 target entirely, reaching above 30,000 by June even as the Fed turned out hawkish rather than dovish.
This is a useful illustration of why algorithmic and scenario-based models, however well-constructed, tend to be better at framing the range of plausible outcomes than at predicting which one — or whether some combination — actually plays out.
Forecasts are based on algorithmic and AI models using historical data and assumptions. They are uncertain and may not reflect future market conditions. This content is for informational purposes only and is not investment advice. Past performance is not indicative of future results.
NASDAQ 100 Price History — Key Moments
The NASDAQ-100's recent history is a study in volatility within a powerful structural uptrend — a pattern that has repeated multiple times since the index bottomed out of its 2022 bear market.
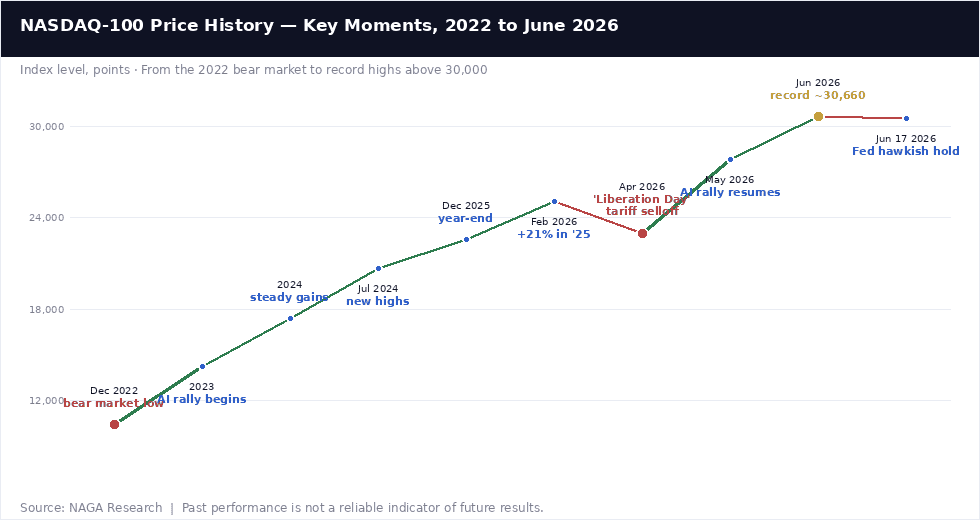
December 2022: The Bear Market Low
The NASDAQ-100 bottomed near 10,440 in December 2022, having fallen more than 35% from its late-2021 peak as the Fed's aggressive rate-hiking campaign to combat post-pandemic inflation crushed valuations for long-duration growth and technology names. This low marks the starting point of the current multi-year bull market.
2023–2024: The AI Rally Begins
The index began its recovery in 2023 as excitement around generative AI took hold following the late-2022 launch of ChatGPT, with the rally broadening through 2024 as hyperscalers committed to massive AI infrastructure spending. The index crossed 20,690 in July 2024, building steadily toward the records that would follow.
2025: A 21% Gain Despite Tariff Headwinds
The index gained 21% in 2025, navigating a brief dip into bear market territory when President Trump began imposing tariffs, before persistent AI enthusiasm drove a renewed bull market. The technology sector absorbed headwinds including elevated inflation, high interest rates, and ongoing tariff uncertainty without derailing the broader uptrend.
March 2026: The "Liberation Day" Tariff Selloff
The index fell to a 2026 low near 22,953 in late March, in a sharp selloff reminiscent of the prior year's "Liberation Day" tariff shock, as fresh US trade policy threats against major trading partners reignited fears of a broader economic slowdown and compressed valuations across the technology sector.
April–June 2026: The Record-Breaking AI Rally
From the March low, the index staged an extraordinary recovery, powering through April and May on resurgent AI enthusiasm to reach a record high just above 30,660 in early June 2026 — a gain of more than 33% in roughly ten weeks. The rally has since consolidated into the mid-30,500s as markets absorbed the Federal Reserve's hawkish June 17 policy signal under new Chair Kevin Warsh.
It is worth keeping in mind that both analysts and online forecasting sites can and do get their predictions wrong. Keep in mind that past performance and forecasts are not reliable indicators of future returns. When considering Nasdaq 100 price predictions for 2026 and beyond, it’s important to keep in mind that high market volatility and the macroeconomic environment make it difficult to produce accurate long-term Nasdaq 100 analyses and estimates. As such, analysts and forecasters can get their Nasdaq 100 forecast wrong.
It is essential to do your research and always remember that your decision to trade depends on your attitude to risk, your expertise in the market, the spread of your investment portfolio, and how comfortable you feel about losing money. You should never invest money that you cannot afford to lose.
Sources:
- Federal Reserve — FOMC Press Release, June 17, 2026
- FRED / St. Louis Fed — NASDAQ-100 Historical Data
- CNBC — NASDAQ 100 Futures Quote & News
- NPR — Federal Reserve Coverage
- CME Group — E-mini NASDAQ-100 Futures Overview
- Nasdaq, Inc. — NASDAQ-100 (NDX) Official Data
Other Resources:
- Dow Jones forecast & price predictions 2026
- DAX 40 forecast & price predictions 2026
- EUR/USD forecast & price predictions 2026
- Oil forecast & price predictions 2026
- Gold forecast & price predictions 2026
- Silver forecast & price predictions 2026
- Natural Gas forecast & price predictions 2026
- IBEX 35 forecast & price predictions 2026
- Understanding Capital Expenditures (CapEx)
- How to trade stocks and indices