


Bitcoin's first half of 2026 has been defined by a correction that is simultaneously scary and historically moderate. Down more than 50% from the $126,230 all-time high reached in October 2025, BTC/USD price has fallen through every major moving average and support level that mattered earlier this year.
Six consecutive weeks of ETF outflows totalling nearly $6 billion have removed the institutional bid that drove the 2024–2025 rally, leaving the market dependent on long-term holders and corporate buyers to absorb the selling. Sentiment has touched 8 on the Fear & Greed Index — a level last seen during the FTX collapse of November 2022.
Bitcoin Forecast Summary
- Bitcoin price prediction H2 2026: The dividing line between bullish and bearish BTC forecasts is not a single price — it is the behaviour of two variables: ETF flows and the Federal Reserve's rate path. If either turns meaningfully positive (flows reverse OR Fed signals 2027 cuts), the recovery scenario becomes dominant. If both remain negative, the deeper bear case opens.
- BASE CASE ~45% ($65,000 – $90,000): The 200-week MA holds, long-term holder accumulation gradually offsets ETF outflows, and BTC grinds higher through Q3 toward the $80K–$90K range as the halving cycle asserts itself and on-chain metrics confirm a bottom. Consistent with Benjamin Cowen's base case (cycle bottom in Q4 2026) and Changelly's algorithmic forecast of $78K–$92K by Q4.
- BULL CASE ~25% ($100,000 – $150,000): ETF flows reverse decisively as the Strategic Bitcoin Reserve creates a new sovereign demand floor, and the Fed signals 2027 rate cuts. BTC reclaims $80K and $100K, validating Standard Chartered's revised $100K target and approaching Bernstein's $150K year-end call. Polymarket currently assigns a 79% probability to BTC hitting $100K before year-end.
- BEAR CASE ~30% ($40,000 – $58,000): A break below the 200-week MA at $62,200 triggers forced selling and miner capitulation toward the $52K–$55K range (CoinStats bear case). A second leg lower, driven by a Fed rate hike or ETF redemption acceleration, could extend toward $40K — the level Standard Chartered has identified as its downside scenario and where the long-term ascending trendline provides structural support.
- Bitcoin price prediction 2027: The 2027 thesis across most institutional frameworks hinges on the same historical pattern: Bitcoin bottoms in the mid-cycle bear year (2026), accumulates through 2027, and then the 2028 halving (block reward: 1.5625 BTC) catalyses the next bull cycle. Analysts target $150k–$200k in institutional bull scenarios and $120k- $150k in a gradual recovery after the 2026 decline.
- Bitcoin price prediction next 5 years (2030+): The five-year bull case rests on supply-demand mathematics: the 2028 halving reduces new issuance to 1.5625 BTC per block, against a backdrop of ETF demand that now structurally absorbs far more than daily issuance, plus corporate treasury adoption, and a potential US Strategic Bitcoin Reserve as permanent sovereign demand.
Whether you want to speculate on near-term price movements, hold Bitcoin for the long term, or access it through regulated financial instruments, NAGA offers multiple exposure routes.
- Trade BTC/USD in both directions — go long if you expect recovery, short if you expect further downside — with leverage and tight spreads.
- Buy and hold actual Bitcoin at current levels. Own the asset directly with secure custody. No expiry, no leverage.
- Access Bitcoin through regulated spot ETFs (BlackRock IBIT, Fidelity FBTC) — traditional portfolio integration without self-custody complexity.
Bitcoin Fundamental Analysis 2026
Understanding Bitcoin's current position requires looking at what the market is doing beneath the surface — not just the price. The signal-to-noise ratio in a bear phase is low; the key is identifying which data points represent durable structural conditions and which are temporary sentiment shifts.
On-Chain Metrics — What the Data Says Right Now
Bitcoin’s on-chain metrics are showing a clear divergence: cycle indicators like MVRV, long-term holder supply, and the 200-week MA are flashing accumulation signals, while ETF outflows remain the main bearish pressure. The snapshot below explains what each key metric is signalling and why ETF flows are currently suppressing price despite other bullish data.
MVRV Z-Score: ~0.41
Near historic bottom zones. Values below 0.1 have marked every major BTC cycle low. Not there yet, but significantly compressed from 2025 highs above 3.
LT Holder Supply: 78%
Near-record. Long-term holders are accumulating, not selling. Whale addresses (100+ BTC) at the 2026 high. This is the opposite of what cycle tops look like.
Exchange Balances: Declining
Coins moving off exchanges to cold storage — a structural supply-reduction signal. Fewer coins on exchanges = less potential sell pressure.
Rainbow Chart: Fire Sale
Bitcoin's log regression Rainbow Chart is in its "Fire Sale" band — the same zone seen in December 2022. A historically reliable long-term accumulation signal.
200-Week MA: $62,200
The ultimate structural floor. Tested and held in June 2026. Has never been broken on a weekly close in Bitcoin's history. Breaking it would be unprecedented.
ETF Flows (30d): −$5.96B
The dominant bearish signal. Six straight weeks of net outflows. This is what is keeping the price suppressed despite bullish on-chain data. The reversal trigger to watch.
Sources: CoinStats, HTX Insights, BlockchainReporter
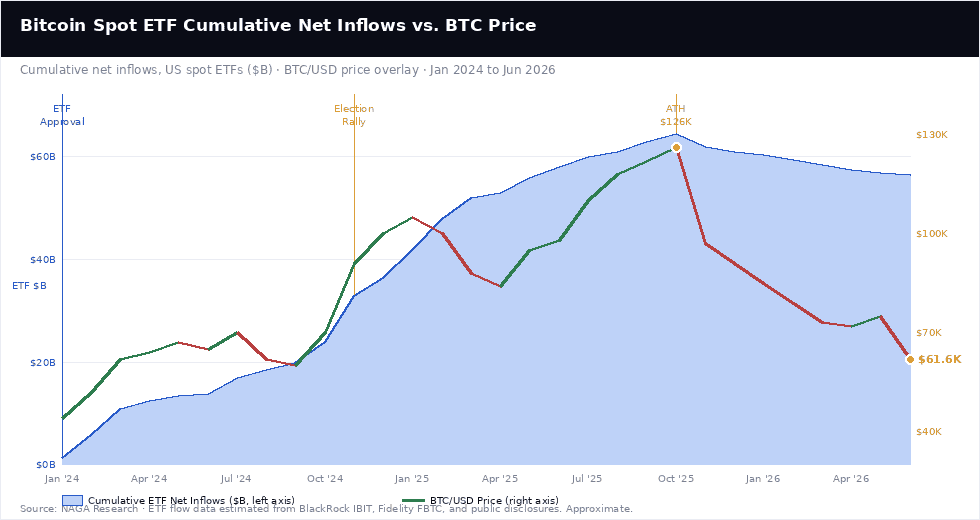
ETF Demand — Structurally Changed, Temporarily Cooling
The January 2024 spot Exchange-Traded Fund (ETF) approval permanently changed Bitcoin's demand architecture. Institutional ownership of spot ETF assets climbed from 20% to 28% between 2024 and early 2025. ARK Invest estimates that ETFs and corporate treasury vehicles have absorbed roughly 12% of the total Bitcoin supply. However, the current correction has reversed that flow: ETF net outflows of −$5.96 billion over 30 days represent the largest monthly redemption pressure of 2026, with −$68.3 million in a single day on June 22.
Past performance is not a reliable indicator of future results. All historical data, including but not limited to returns, volatility, and other performance metrics, should not be construed as a guarantee of future performance.
The critical insight from Bernstein: even at these outflow levels, redemptions represent less than 5% of total ETF assets — most institutional holders are not selling, they are simply not buying. The day that changes — when ETF flows flip back positive — will likely be the most powerful near-term Bitcoin price signal available.
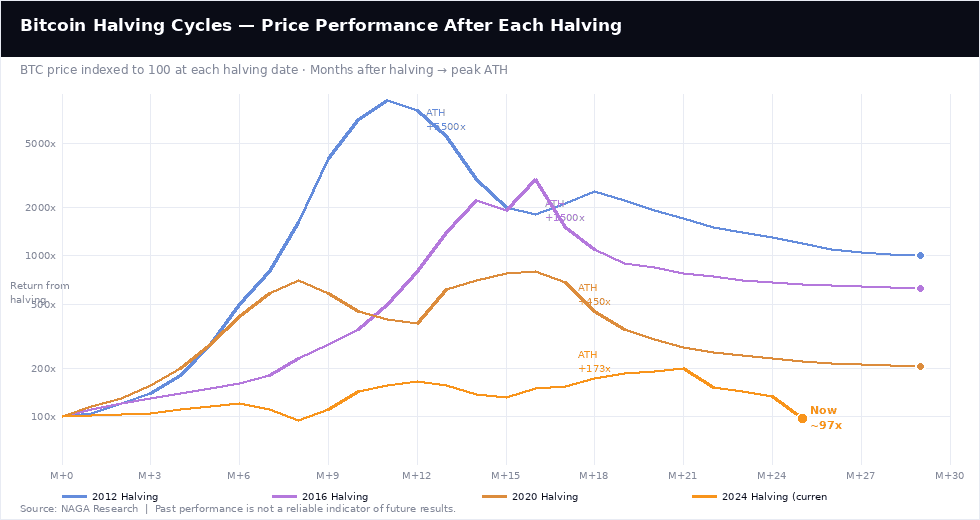
The Halving Cycle — Historical Pattern vs. ETF Era
Bitcoin's April 2024 halving reduced block rewards from 6.25 to 3.125 BTC. Every prior halving has produced a cycle peak 12–18 months later: the October 2025 ATH at month 18 fits squarely in that range. CryptoQuant's cycle analysis suggests Q4 2026 as the bottoming window — approximately 17 months before the 2028 halving, consistent with prior cycle timings. The key debate is whether the current 51% drawdown is the bear phase (bull case: cycle intact, recovery next) or merely the first leg (bear case: ETF-era cycles are larger, and prior 77–86% drawdowns suggest more downside is possible before the 2028 halving resets the clock).
Past performance is not a reliable indicator of future results. All historical data, including but not limited to returns, volatility, and other performance metrics, should not be construed as a guarantee of future performance.
What the halving chart makes clear is that the current cycle's peak-to-trough shape is genuinely different from prior cycles — the ATH was lower in percentage terms (198x vs. 800x–9000x in prior cycles) and the current drawdown is milder (51% vs. 77–86%). This is either evidence that ETF adoption has structurally dampened Bitcoin's volatility (the institutional thesis) or that the cycle still has further to fall before the real bottom (the cycle-purist thesis). The answer is binary, and the on-chain data currently supports the former more than the latter.
The Macro Headwind — Fed Policy and BTC
Bitcoin's largest near-term headwind is the Federal Reserve's hawkish posture. Chair Warsh's June 17 meeting produced an unchanged 3.50–3.75% rate alongside a dot plot projecting a 2026 hike — nine of eighteen members now see tightening ahead. This matters for BTC because Bitcoin has historically performed best in falling-rate, abundant-liquidity environments. The inverse is true today: sticky inflation (US CPI 4.2% YoY in May) from the Strait of Hormuz energy shock limits Fed flexibility, dollar strength compresses risk appetite, and the net result is a "trading the dot plot, not fundamentals" dynamic — which explains why Bitcoin sold off on June 17 even as the Iran ceasefire news was positive.
The flip side: if oil prices fall decisively after a durable ceasefire, inflation relief could be rapid — potentially removing the projected Fed hike from the equation within two to three months. That macro reversal, more than any Bitcoin-specific catalyst, is the event most likely to unlock the recovery scenario.
Corporate Accumulation and the Strategic Bitcoin Reserve
While ETF flows have been negative, corporate accumulation has continued. Strategy holds 846,842 BTC after a $100 million purchase in the week of June 8–14. Marathon Digital (MARA) purchased 1,000 BTC on June 16 at approximately $66.7 million — the largest single-day corporate Bitcoin purchase since Strategy's Q1 buys.
More significant still: the Trump administration faces a July 22 deadline to release the architecture for a US Strategic Bitcoin Reserve. Unlike any prior policy announcement, a sovereign reserve — even one structured to accumulate BTC without direct taxpayer funds — would create a permanent institutional buyer that has never existed in prior cycles. The July 22 date is the single most important upcoming catalyst not yet priced into current sentiment.
Supply Scarcity — The Unchanged Long-Term Thesis
None of the bearish short-term catalysts — ETF outflows, Fed hawkishness, Iran conflict — change Bitcoin's hard-coded supply schedule. Approximately 1.32 million BTC remain unmined (less than 7% of total supply), an estimated 3–4 million are permanently lost, and the 2028 halving will reduce new issuance to 1.5625 BTC per block.
Long-term holders controlling 78% of the supply create a structural float constraint that becomes increasingly acute as that percentage rises. The stock-to-flow ratio continues its historical upward trajectory. These supply dynamics do not affect the next quarter's price — but they are the reason every multi-year Bitcoin price prediction by credible institutions points significantly higher.
Bitcoin Outlook: Bullish and Bearish Catalysts
Bitcoin’s next major move will likely be driven by a mix of macro conditions, ETF demand, regulation, and cycle dynamics. The table below summarises the key bullish and bearish factors that could push prices higher or lower in 2026.
Factor Tailwind (Bull) Headwind (Bear) ETF Flows Flows reverse as new institutional allocators enter; corporate treasury adoption accelerates; Strategic BTC Reserve creates sovereign demand floor Six-week outflow streak extends; large holders continue redemptions; ETF assets under management fall below the psychological threshold, triggering further retail exits Fed / Macro Iran ceasefire holds, oil falls, May CPI spike proves temporary; Fed removes hike projection at July 29 meeting; dollar weakens; liquidity expands Fed delivers one or two actual 2026 hikes; dollar continues to strengthen; real yields remain elevated; Bitcoin trades as a risk asset and falls with equities On-Chain / Cycle MVRV Z-Score bottoms below 0.1 and recovers; 200-week MA holds as a floor; LTH supply reaches 80%+; Q4 2026 becomes the cycle bottom predicted by cycle analysis 200-week MA breaks on a weekly close (unprecedented); LTH capitulation begins; MVRV Z-Score continues lower; forced miner selling adds supply pressure Regulation US Strategic Bitcoin Reserve architecture released July 22; Clarity Act passes; SEC Project Crypto unlocks institutional capital; MiCA brings European demand Reserve architecture is weaker than expected or delayed; hostile SEC enforcement action; Congressional pushback on crypto legislation stalls the Clarity Act Volatility / Sentiment Fear & Greed at 24 is historically a contrarian buy zone; leveraged longs flushed ($706M in 24h liquidations); open interest down 18.72% — crash risk reduced Sentiment remains in Extreme Fear for months rather than weeks; $60K psychological level breaks, triggering algorithmic stop-losses and retail panic selling
Bitcoin Technical Analysis 2026
Bitcoin's technical picture shows an intermediate trend countertrend (secondary reaction according to the Dow Theory) within the primary trend. Short-term outlook remains fragile below $60K, but the long-term structure is healthy and bullish. Investors should watch for a confirmed buy signal with institutional volume and a break above the 200-day EMA to validate the recovery.
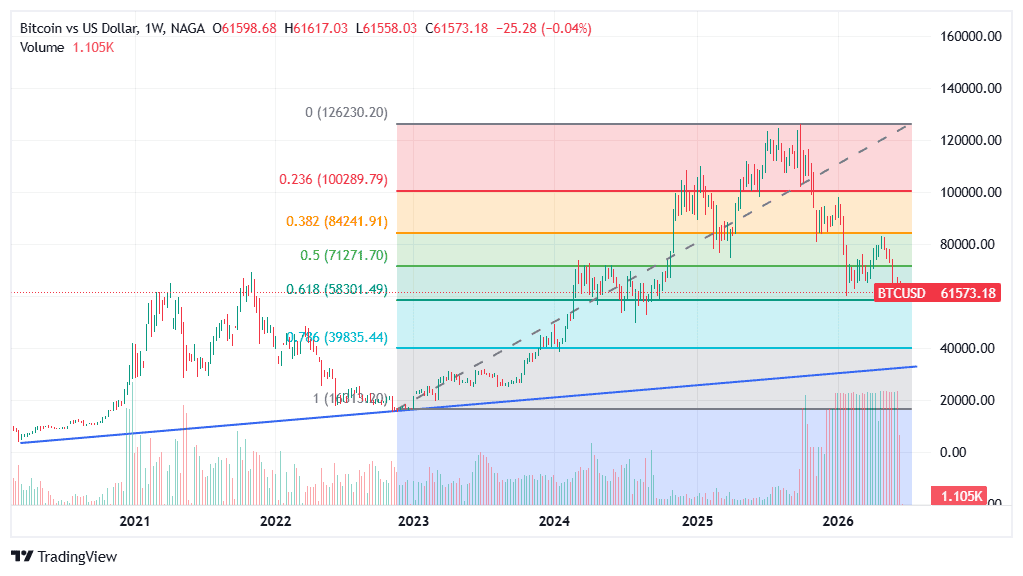
Long-Term (Weekly Chart) — Bullish Macro Structure
The weekly chart shows Bitcoin is navigating a technically coherent correction within a broader bullish cycle, not a trend reversal. The long-term trajectory supports a potential move toward $150,000 after the corrective cycle completes. But will the correction end at 60k or lower towards the 40k key support level for this bullish structure?
The most important price for Bitcoin’s 2026 forecast is the $62k- $60k area — the 200-week moving average. This level has acted as the definitive floor in every major Bitcoin bear market since 2015:
- The 2018 bear bottomed near it ($3,200 range), the COVID crash bounced from it ($3,800)
- The 2022 FTX crisis saw Bitcoin briefly pierce and recover above it ($16,000–$17,000).
BTC tested this level in early June 2026 and bounced. A sustained weekly close below $62k- $60k would be the first time in Bitcoin's history that the 200-week MA failed as support — which is why this level commands more technical significance than any other in the current setup.
Past performance is not a reliable indicator of future results. All historical data, including but not limited to returns, volatility, and other performance metrics, should not be construed as a guarantee of future performance.
The Fibonacci retracement drawn from the 2022 low to the 2025 ATH places the 0.618 level just below the $60k area and the 0.786 at $40k. These are useful reference points that happen to align with the 200-week MA zone (0.618) and the long-term ascending trendline from 2020 (0.786, near $40K). Think of them as additional confirmation markers for levels the 200-week MA already defines: if the 200-week MA breaks, the next structural zone is in the $40K region where multiple long-term support measures converge.
Bitcoin Short-to-Medium Term Analysis — A Descending Channel
Since the October 2025 all-time high, Bitcoin has traded within a clearly defined descending channel, before consolidating and breaking above 70k, the upper boundaries and the 50-day moving average. The decline can be a test of the lows and should be followed by a bounce.
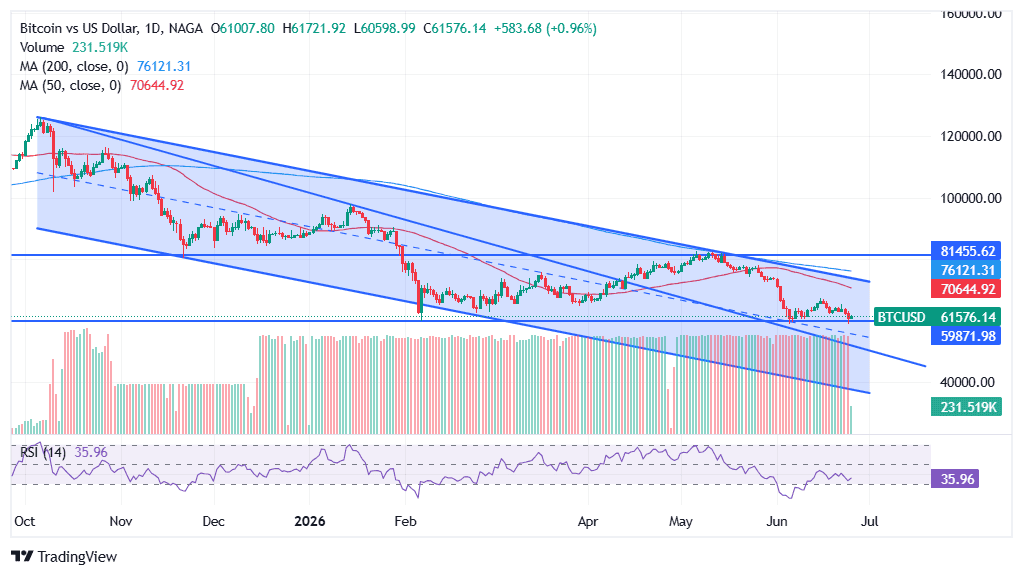
Past performance is not a reliable indicator of future results. All historical data, including but not limited to returns, volatility, and other performance metrics, should not be construed as a guarantee of future performance.
The 50-day moving average and the 200-day are both declining and acting as dynamic overhead resistance — a confirmed daily close above $65,000 would be the first signal that the price is breaking higher; a close below $60,000 would accelerate the move toward the next key zone. The RSI at 35.96 is approaching the oversold threshold of 30; in prior Bitcoin corrections, readings below 30 on the daily chart have coincided with meaningful bounces, though they do not guarantee an immediate bottom.
Bitcoin Price Prediction 2026 — Institutional Forecasts
It is essential context that virtually all published bank and analyst targets for Bitcoin were set when BTC was trading at $80,000–$100,000. Reaching even the lowest published institutional targets from today's $61,576 requires a 30–140% recovery. Note also that Standard Chartered has revised its target twice downward in 2026 alone — from $300,000 to $150,000, to $100,000 — and has publicly flagged $50,000 as its downside scenario.
Institution / Analyst 2026 Target 2027 Target Long-Term Current Stance Standard Chartered $100,000 (revised ↓ twice from $300K) — $500,000 (2028) Most recent revision signals caution; $50K downside scenario flagged explicitly Bernstein $150,000 $200,000 $1M (2033) Maintains ETF "elongated cycle" thesis; sticky institutional buying absorbs retail exits Fundstrat (Tom Lee) $200,000–$250,000 — — Most bullish major analyst; expanding allocation channels; macro tailwinds assumed JPMorgan $170,000 (fair value) — — Fair-value model; volatility-adjusted gold market cap comparison Citigroup $143,000 — — Conditional on ~$15B in additional ETF inflows materialising in H2 Arthur Hayes $125,000 — — Macro-driven; conditional on Fed pivot and liquidity expansion Michael Saylor (Strategy) $150,000 — — Continues buying at current levels; 846,842 BTC held; long-duration conviction Benjamin Cowen $60K–$70K bottom (bear analyst) Recovery — Cycle intact; Q4 2026 as likely bottom window; 2027–2028 as recovery Polymarket consensus 79% odds of $100K; 41% of $130K; 25% of $150K — — Market-implied probabilities; 80% chance of touching $75K at some point
AI-Based Bitcoin Price Forecasts
Model H2 2026 Range Year-End 2026 2027 Signal Changelly (algorithmic) $62,598–$94,398 ~$91,635 ~$120K Monthly model; projects Q3 recovery to $76K–$92K, year-end ~$91K. Most grounded near-term. CoinCodex Bearish near-term Bearish (sub-$70K) Gradual recovery 31 of 31 technical indicators are currently bearish. RSI 37.44. Momentum model; follows price action. LongForecast H2 recovery to $88K+ ~$88,828 (Aug high) $50K–$74K then recovery Bullish Q3 2026, then correction resumes in 2027 before the 2028 halving cycle accelerates. WalletInvestor Long-term bullish Bullish Continued rise Extrapolates long-term uptrend; less sensitive to medium-term bearish phase. Crypto expert survey (Changelly) $76K–$92K $91,635 ~$120K avg Aggregated analyst panel; broadly constructive H2 2026 recovery, then continuation through 2027.
The divergence between CoinCodex (all 31 technical indicators bearish) and Changelly's algorithmic model (projects $91K year-end) captures exactly the uncertainty the options market reflects: professional traders are pricing roughly equal probability for $60K and $120K by year-end. The momentum-only models are bearish because they extrapolate the downtrend. The cycle and fundamental models are bullish because they weigh the 200-week MA holding and the on-chain bottom signals. The truth of which framework is correct will be determined by two data points: the next close relative to $62-60k, and ETF flow data at the beginning of Q3 2026.
Bitcoin Price History — Key Moments
Bitcoin’s recent decade has been defined by sharp crashes and faster recoveries, where macro policy shifts, regulatory milestones and institutional adoption repeatedly reset the market’s trajectory. Below are concise, punchy summaries of the cycle’s key dates and why each mattered for price direction.
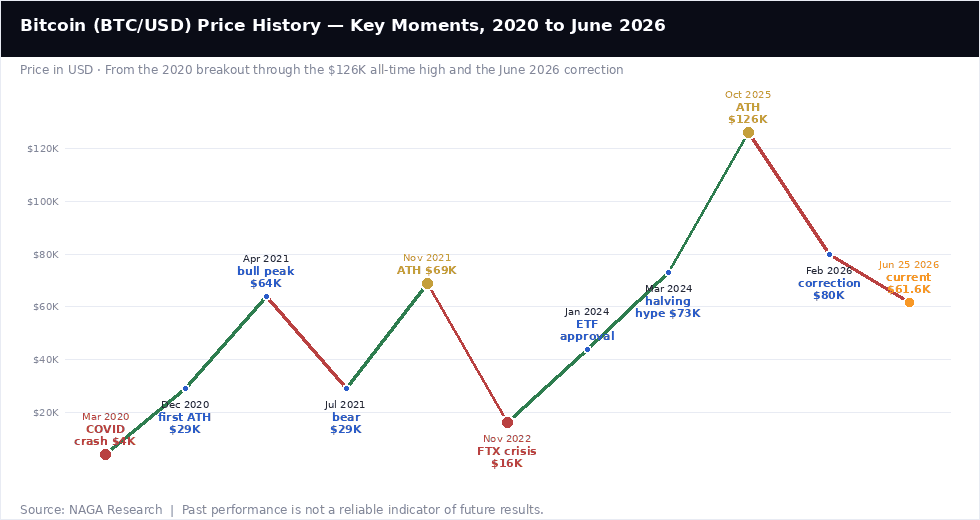
March 2020 — The COVID crash: $4,000
A single-day panic on March 13, 2020, plunged BTC toward $4,000 as global markets and leveraged crypto positions unwound. The Fed’s subsequent unlimited QE created the liquidity backdrop that launched the next massive rally; buyers who held into 2021 saw roughly 17x returns.
December 2020 — First post-2017 ATH: $29,000
By year-end 2020, BTC had cleared its 2017 high and hit $29k, fuelled by a wave of institutional treasuries and payment platforms (MicroStrategy, Square, PayPal) shifting capital into Bitcoin. That institutional entry turned the 2020 rebound into a sustained, higher volatility upcycle.
April 2021 — Bull peak: $64,000
BTC briefly topped ~$64.8k on April 14, 2021, coinciding with Coinbase’s Nasdaq listing and peak retail euphoria. Rapid gains from $29k reflected both the institutional bid and massive retail inflows via consumer trading apps.
July 2021 — Mid-cycle correction: $29,000
A mid-cycle correction halved BTC back to about $29k after China’s mining crackdown and high-profile corporate reversals (e.g., Tesla), highlighting mining concentration and environmental concerns as market narratives. The episode forced the largest-ever miner migration but left the protocol intact.
November 2021 — Cycle ATH: $69,000
BTC hit a then-record $69k on November 10, 2021, amid strong inflation prints that briefly bolstered the “digital gold” story and the launch of the first US Bitcoin futures ETF (BITO). The futures-based ETF delivered huge AUM fast but introduced basis and roll costs versus spot exposure.
November 2022 — FTX crisis: $16,000
The collapse of FTX pushed BTC to roughly $15.5k on November 21, 2022, triggering bankruptcies across counterparties and a 78% drawdown from the 2021 peak. The debacle validated counterparty risk concerns while underlining Bitcoin’s protocol resilience as block production continued uninterrupted.
January 2024 — Spot ETF approval: $44,000
SEC approval of 11 spot Bitcoin ETFs in January 2024 opened regulated, institutional-grade spot access, dramatically expanding demand channels. Rapid inflows (led by BlackRock’s IBIT) materially tightened the supply-demand picture versus daily issuance.
March–April 2024 — Halving hype: $73,000
BTC hit ~73.8k pre-halving in March 2024 as ETF demand surged and halving expectations concentrated buying before the April 19 supply cut. The halving then triggered a “sell the news” pullback to the mid-$50k range before renewed upside later.
October 2025 — All-time high: $126,230
The cycle peak of ~$126.2k on October 6, 2025, combined with persistent ETF demand, accelerating corporate treasury buys, and a dovish macro backdrop—pushing market cap toward $2.5 trillion. The timing—18 months after the halving—fits the historical post-halving ATH window.
February 2026 — Correction begins: $80,000
Profit-taking and slowing ETF inflows began trimming prices into early 2026, with BTC near $80k by February after the Strait of Hormuz conflict raised energy-driven inflation and reduced the scope of central bank easing. Higher real yields and macro uncertainty pressured long-duration risk assets, including Bitcoin.
June 2026 — Current correction: ~$60k
As of the end of H1 2026, BTC sits above $60, a +50% decline from the October 2025 peak, accelerated by renewed Fed hawkishness and several weeks of ETF outflows. The 200-week moving average (~$62k) has been tested and so far, held, providing a structural support signal for the ongoing bear phase.
Bitcoin price predictions involve high uncertainty. The range of forecasts from credible institutions spans from $40,000 to $1.5 million+ for 2026–2030, reflecting genuine disagreement about Bitcoin's role in the financial system. Past performance is not a reliable indicator of future results. Crypto assets are highly volatile, and trading involves significant risk of loss. This article is for informational purposes only and does not constitute investment advice. Never invest more than you can afford to lose.
Other Resources
- EUR/USD forecast & price predictions 2026
- NASDAQ 100 forecast & price predictions 2026
- Gold forecast & price predictions 2026
- Turkish lira forecast 2026
- Oil forecast & price predictions 2026
- Silver forecast & price predictions 2026
- How to trade cryptocurrency
- Understanding the Bitcoin halving cycle
- Bitcoin ETFs — what they are and how to access them
- Technical analysis tools and indicators