



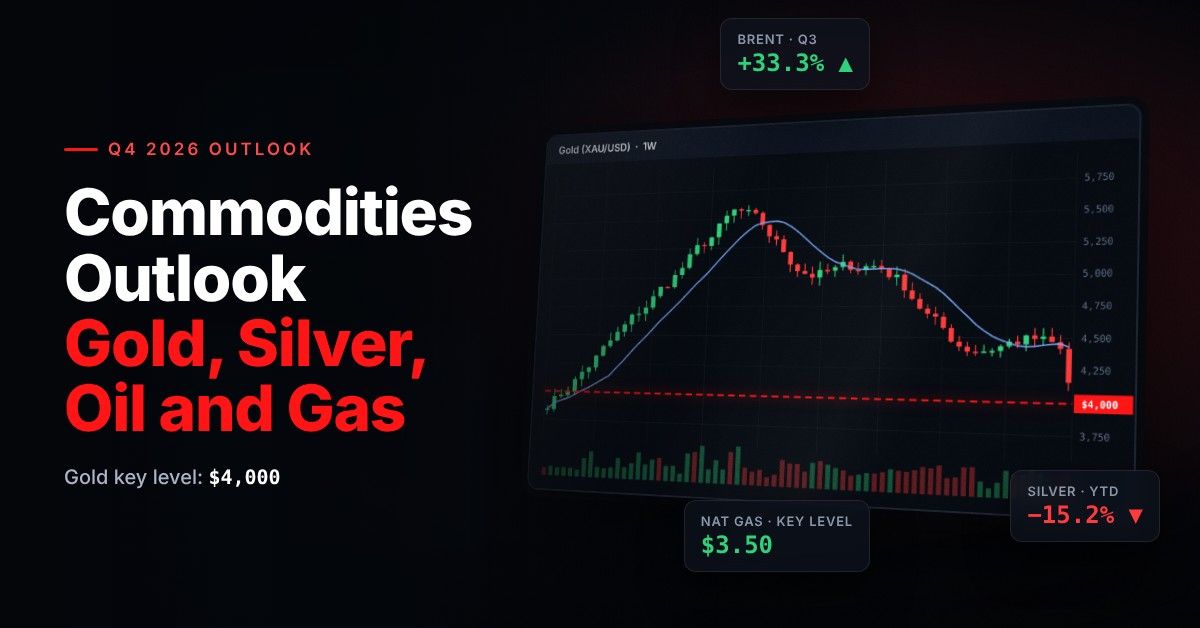
This article covers the commodities chapter of NAGA's Q4 2026 Market Outlook, "The Dollar Decides", by Frank Walbaum, Market Analyst at NAGA. The full report, with 20 charts, three scenarios and a quarter-long calendar, is available as a free PDF.
Commodities outlook Q4 2026 — key takeaways
The outlook's view on the four main commodity markets for Q4 2026, at a glance:
- Gold: bullish long term, dollar-sensitive short term. Key levels $4,000 and $4,650; driven by the dollar, real yields and the Fed.
- Silver: bullish long term, with high volatility. Key levels $55 and $50; driven by gold, industrial demand and equities.
- Brent crude: volatile, with momentum fading. Key level $100; driven by the Strait of Hormuz, OPEC+ and winter demand.
- Natural gas (Henry Hub): volatile, with a winter risk premium. Key levels $3.50 and $2.62; driven by US weather, storage and LNG exports.
Each view, the scenarios behind it and the dates that could change it are explained below.
Source: NAGA Q4 2026 Market Outlook. The bias reflects the author's directional view and is not a recommendation.Open an account Practice on demo Copy lead traders
CFD trading involves risk.
Q3 2026 review: oil surged, precious metals held ground
Energy led the commodity complex in Q3 as the Strait of Hormuz crisis returned. WTI gained 27.4% and Brent 33.3%, with Brent trading back above $100 in September, while gold and silver posted smaller gains and remain lower for the year.
Commodity Q3 2026 YTD 2026 Gold +3.7% −4.0% Silver +3.5% −15.2% WTI crude +27.4% +54.8% Brent crude +33.3% +60.8% Source: NAGA trading platform. Q3 = 1 July open to 30 September close; YTD = 1 January open to 30 September close. Past performance is not a reliable indicator of future results.
The dispersion was wide: Brent's 33.3% gain in Q3 was nine times gold's 3.7%. The two groups enter Q4 with different drivers, which is why the outlook treats them as separate stories.
Gold outlook 2026: $4,000 remains the key level
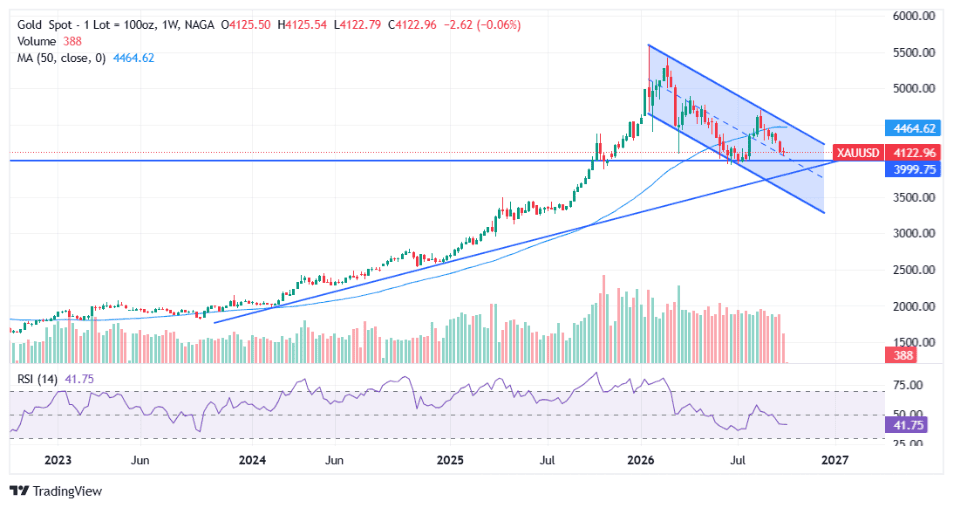
In Frank Walbaum's view, gold remains structurally bullish while $4,000 holds, a level that matters both psychologically and technically. Gold set a record close near $5,600 in January 2026, gained 3.7% in Q3 but gave back ground in September as the dollar and Treasury yields rose; by early October it was roughly 26% below the record.
Past performance is not indicative of future results.
A stronger dollar can temporarily pressure gold, while renewed dollar weakness could provide the catalyst for another move higher, and a break above $4,650 would reopen the upside. Gold also has a less obvious trait: in a sharp risk-off move, investors may first cut positions across asset classes, gold included, before safe-haven demand takes over.
Major banks have cut their targets since mid-year, but every forecast below still sits above $4,000.
Bank Gold forecast Horizon Published Citi $4,800 0–3 months 4 September 2026 Goldman Sachs $4,650 End-2026 (cut from $4,900) 23 September 2026 UBS $4,600 End-2026 27 August 2026 JPMorgan $4,500 Q4 2026 4 July 2026 HSBC $4,490 2026 average 1 October 2026 Morgan Stanley $4,450 Q4 2026 September 2026 Sources: bank research as reported by Reuters, Investinglive, TheStreet, Yahoo Finance and Canadian Mining Report. Citi and Morgan Stanley figures from secondary sources.
The interaction between the dollar, interest rates, geopolitics and risk sentiment will decide gold's quarter. NAGA's Gold Forecast and Price Prediction tracks the metal as it unfolds.
Silver outlook: the same drivers, bigger swings
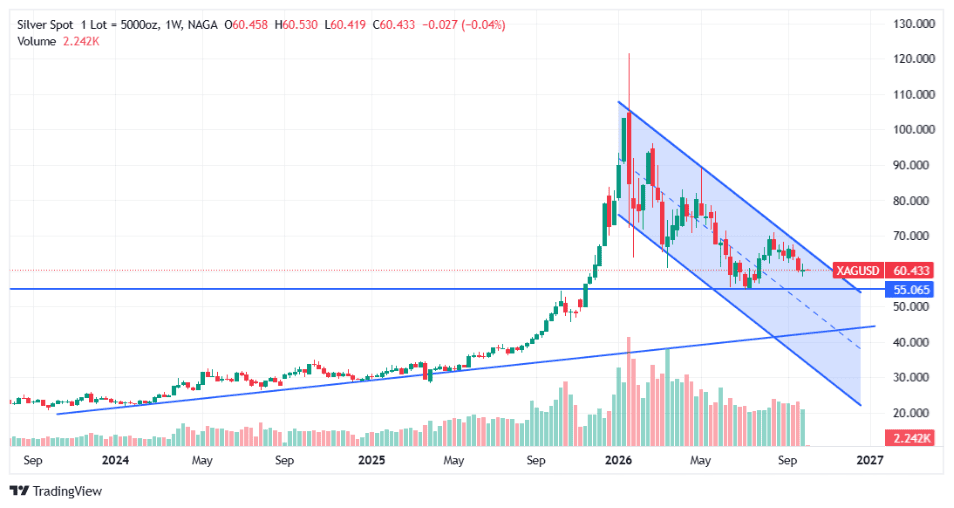
Silver should broadly follow gold's direction, but with greater volatility. It benefits from a supportive precious-metals backdrop, yet it is more sensitive to industrial demand and risk appetite: if equities keep rising, silver can hold its momentum, while a significant stock sell-off could trigger a sharper correction than in gold.
Past performance is not indicative of future results.
Silver has already shown how violent those swings can be. By the beginning of October it had fallen about 50% from its 52-week high of $121.67, twice the drawdown in gold, and it is down 15.2% for the year. UBS forecasts $70 by December 2026 and JPMorgan a 2026 average of $70.60, while the outlook marks $55, then $50, as the supports to watch. The Silver Forecast and Price Prediction covers the metal in more depth.
Oil price outlook: $100 is the key reference for Brent
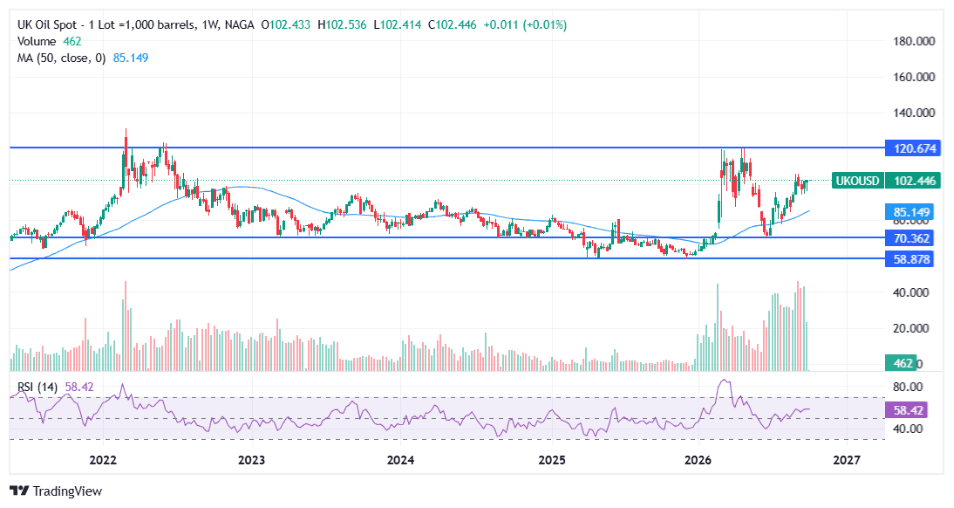
Oil enters Q4 showing signs of fatigue. The conflict involving the US, Israel and Iran that began in late February has repeatedly disrupted traffic through the Strait of Hormuz, and the US Energy Information Administration expects Gulf supply shut-ins to average 4.5 million barrels per day in Q4. Saudi Arabia's East–West pipeline, back at 5.8 million barrels per day, and a planned G7 release of 100 million barrels from strategic reserves offset part of the loss.
Past performance is not indicative of future results.
The latest highs have not produced the momentum the backdrop might suggest, and Brent peaked near $126 earlier in the year. Frank Walbaum reads this as a fading geopolitical premium:
"Markets get tired of wars. The second wave of the Iran conflict pushed oil higher, but the reaction was clearly smaller than the first — a sign that the geopolitical premium is fading." — Frank Walbaum, Market Analyst, NAGA
A further escalation could still push oil towards $100, but without a sustained supply disruption, I would expect that level to be difficult to hold.
Source Brent forecast Horizon Published US EIA (STEO) $105 Q4 2026 average October 2026 Morgan Stanley About $100 Q4 2026 24 August 2026 Goldman Sachs $85 (risk case above $120) December 2026 9 September 2026 JPMorgan No base case; fair value near $90 Current 18 September 2026 Sources: US EIA Short-Term Energy Outlook (October 2026); bank research as reported by Investinglive, IndexBox and Yahoo Finance.
The $20 gap between the highest and lowest base cases shows how much depends on events in the Gulf. The winter heating season adds another source of volatility, and OPEC+ meets on 1 November. WTI and Brent are covered in NAGA's Oil Forecast and Price Prediction.
Natural gas outlook: Henry Hub into winter
Natural gas becomes more relevant as the Northern Hemisphere moves into winter. Europe enters the season with less buffer than usual: EU gas storage was about 72.7% full on 4 October, against roughly 83% a year earlier and a five-year average of about 87%, and Dutch TTF gas traded around 135% higher than a year earlier.
Past performance is not indicative of future results.
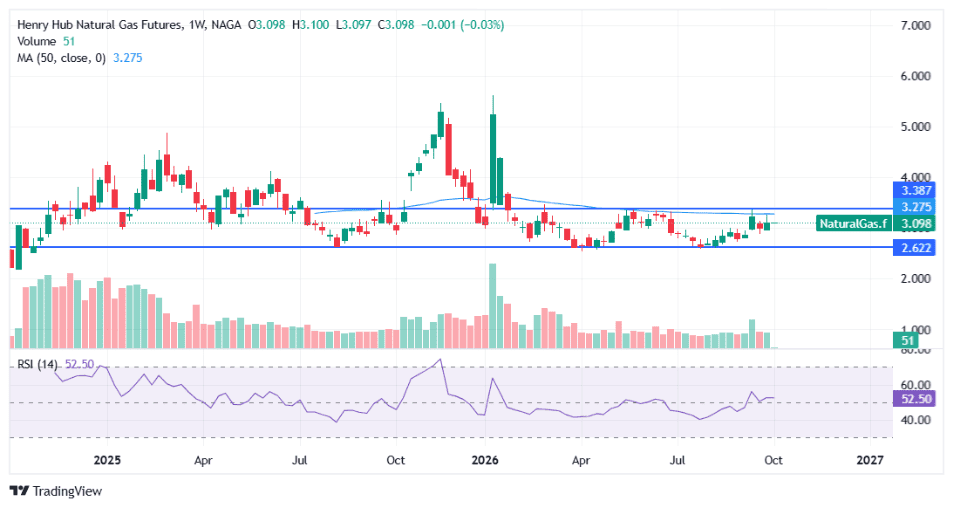
On NAGA, natural gas is traded as the US Henry Hub futures contract. Henry Hub is calmer than TTF, with US storage slightly above its five-year average, but it follows the same winter logic: a cold snap or a surge in LNG exports can lift the price quickly, while a mild winter would keep it inside its recent $2.60–3.40 range.
"Winter will decide whether €80 is a ceiling or just the next stop — buyers still need to stock up, and that could push TTF towards €100." — Frank Walbaum, Market Analyst, NAGA
For the Henry Hub contract traded on NAGA, $3.50 is the equivalent line in the sand: a weekly close above $3.39 and then $3.50 would signal that the winter rally has started, while $2.62 remains the support to watch.
NAGA's Natural Gas Forecast and Price Prediction follows Henry Hub through the heating season.
How the dollar shapes commodities in Q4 2026
The US dollar is the common denominator of the outlook, which frames the quarter as three dollar-driven scenarios. A risk-off environment is the most likely, at 50%.
Market Dollar strength (25%) Dollar correction (25%) Risk-off (50%) Gold Under pressure Supported Initial weakness, then safe-haven support Silver Under pressure Supported Larger downside than gold Oil Mixed Supported Larger downside than peers Directional expectations only; not a recommendation.
The risk-off column reflects the pattern described in the gold section: investors may reduce risk across portfolios before safe-haven demand returns. Silver and oil show the largest expected downside in the risk-off case; for silver, the outlook links this to industrial demand and equities.
Key commodity levels and dates for Q4 2026
The levels below come from Frank Walbaum's analysis and the NAGA platform charts, and the dates are the ones most likely to move commodities.
Market Support Resistance Gold $4,000 $4,650 Silver $55, then $50 — Brent crude $100, then $85 $120.7 Natural gas (Henry Hub) $2.62 $3.39, then $3.50
Date Event 14 October US CPI (September) 28 October FOMC decision 1 November OPEC+ meeting 10 November US CPI (October); EIA Short-Term Energy Outlook 9 December FOMC decision with new projections Sources: Frank Walbaum; NAGA trading platform; Federal Reserve; OPEC; EIA. Dates subject to change.
Levels are reference points, not targets, and the reaction around them matters more than the level itself.
More NAGA commodity forecasts
This outlook sets the quarterly framework, while NAGA's forecast pages follow each commodity in more detail:
- Gold Forecast and Price Prediction
- Silver Forecast and Price Prediction
- Oil Forecast and Price Prediction
- Natural Gas Forecast and Price Prediction
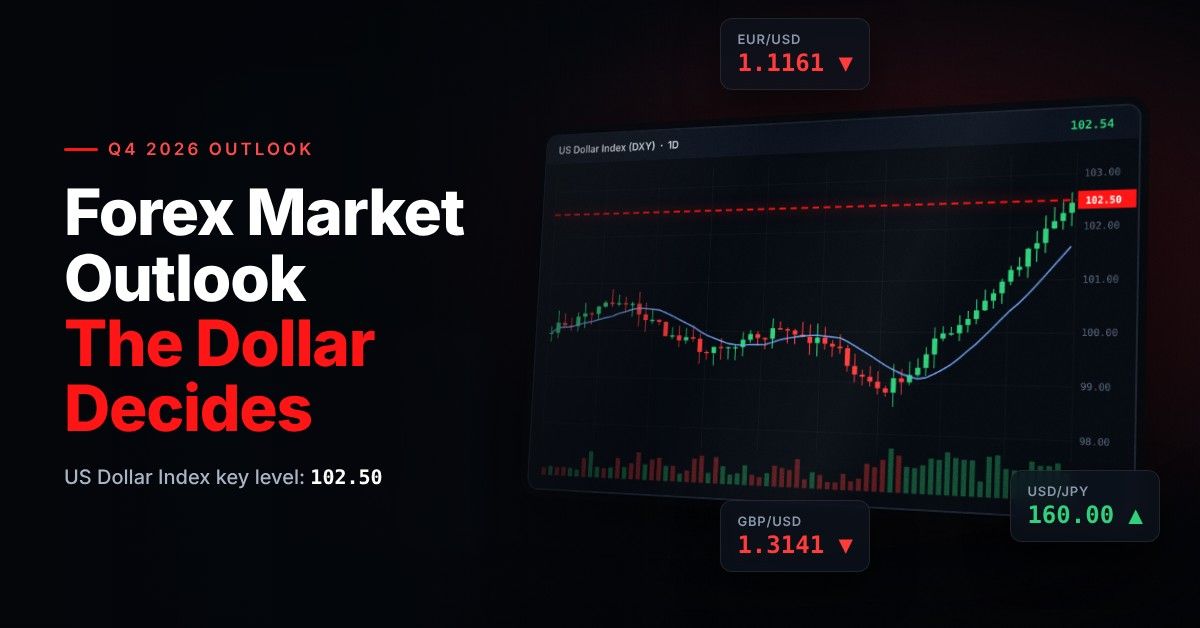
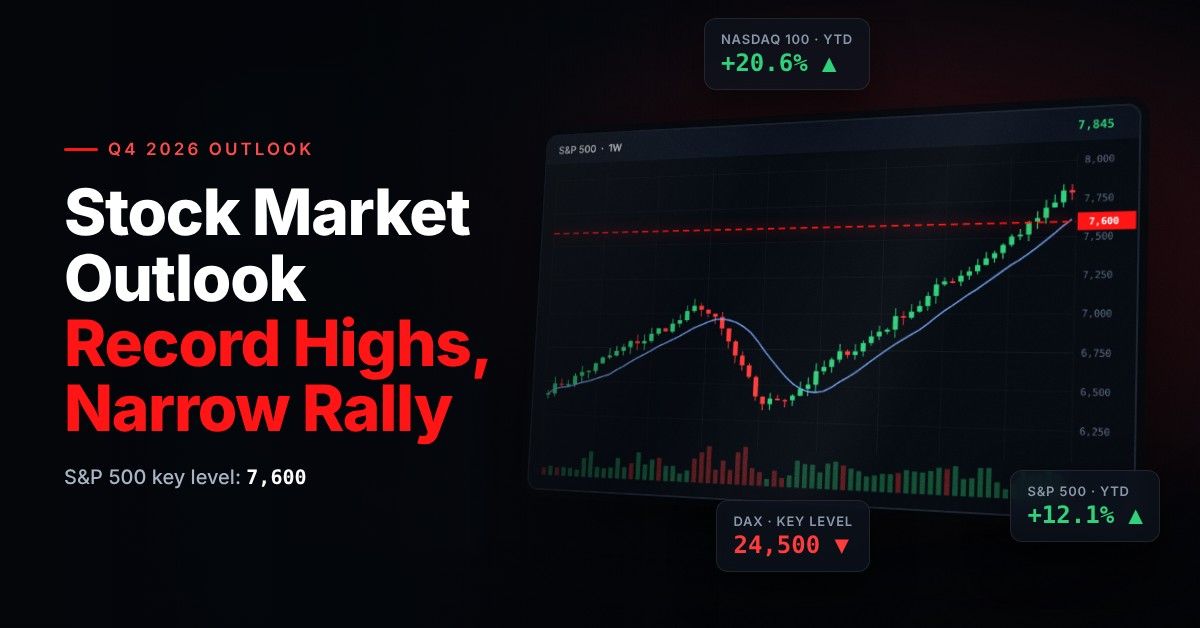
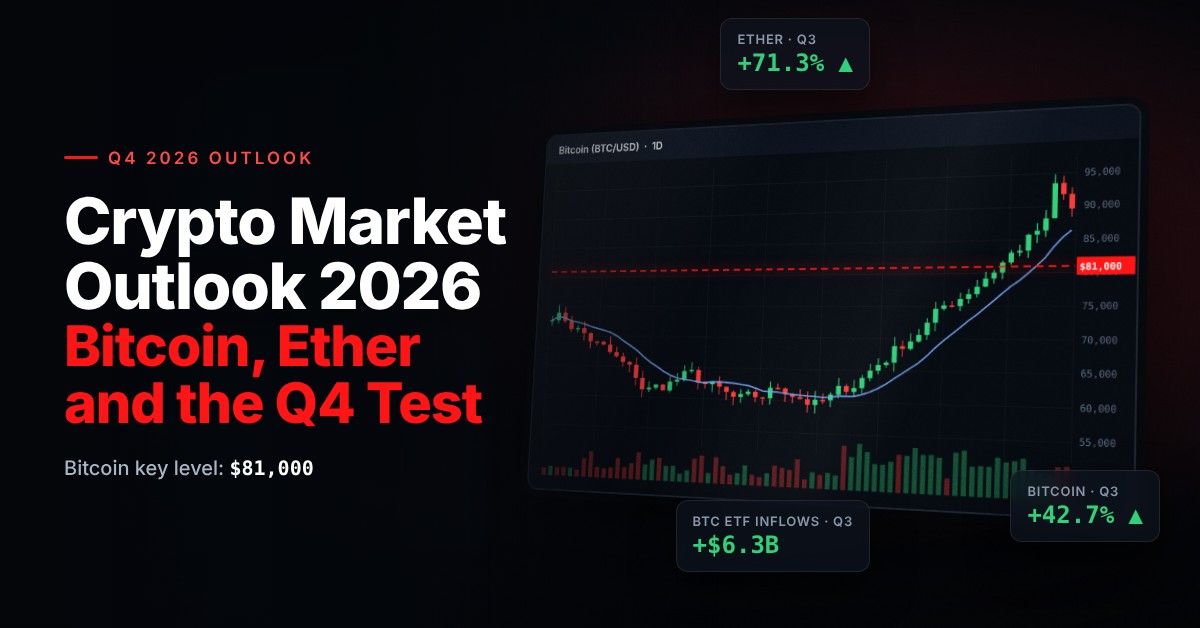
The same quarter is covered for other markets in NAGA's forex market outlook, stock market outlook and crypto market outlook for 2026.