


Is the stock market crashing in 2026? This question dominated financial search trends in early 2026, as investors grappled with a volatile cocktail of high valuations and shifting geopolitical alliances. While the S&P 500 breached the historic 7,000 mark in January, the subsequent "February Fade" has reignited fears of a looming 2026 bear market.
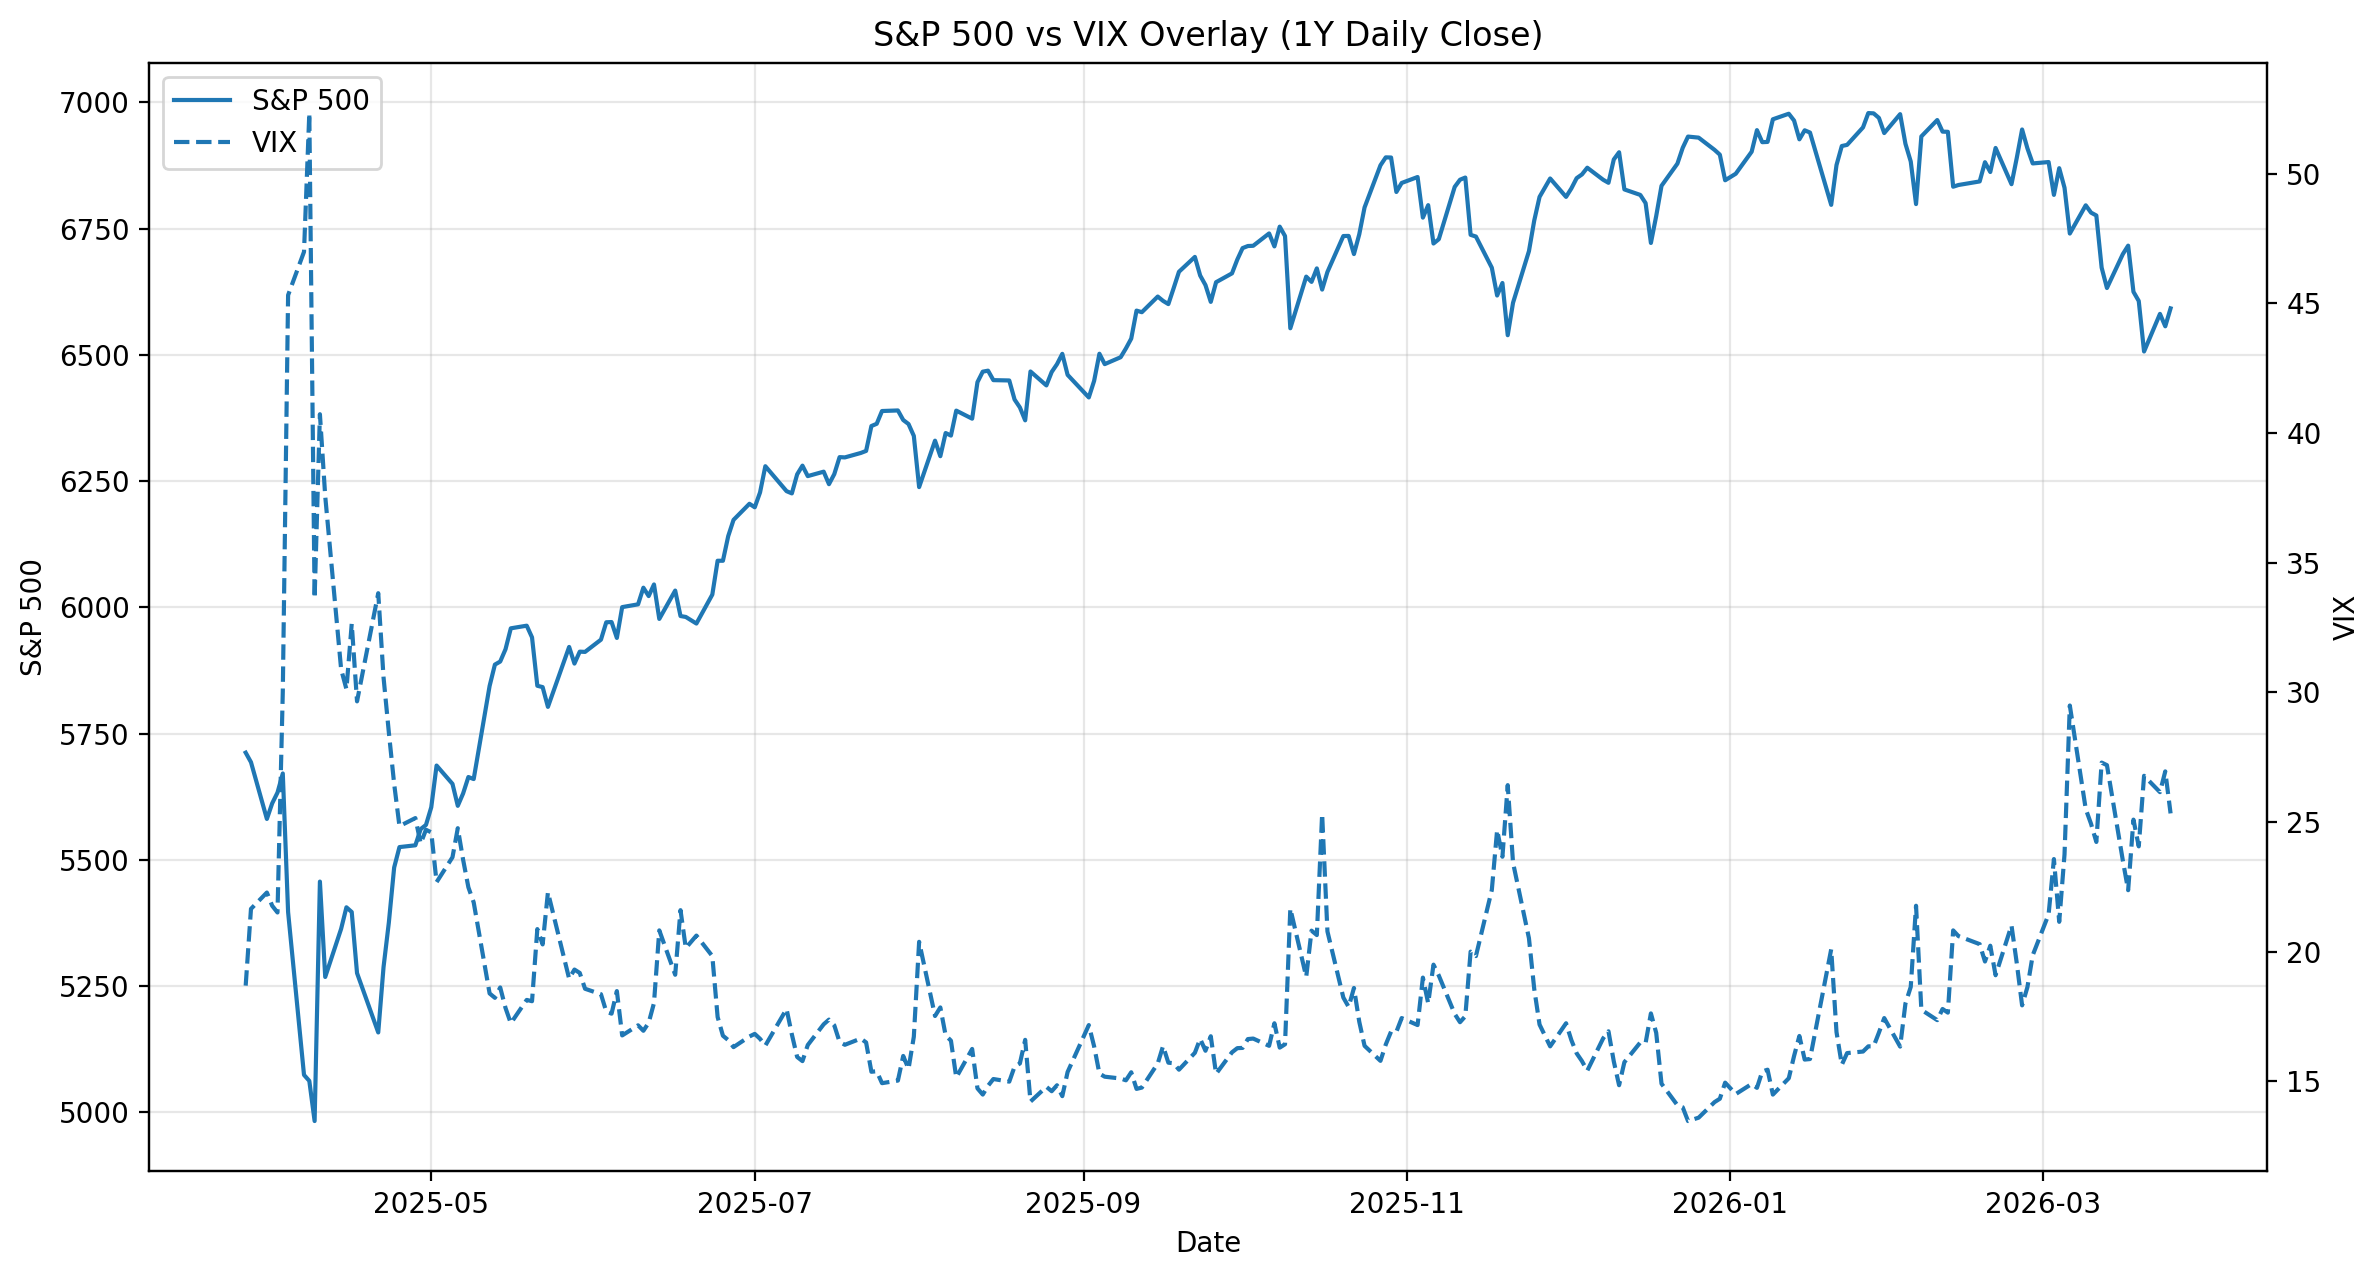
The VIX, Wall Street’s main fear gauge, has been hovering around 27, well above its long-term average of about 20. At the end of Q1, the Nasdaq Composite officially slipped into correction territory, while the broader US stock market had fallen by more than 5% from its recent highs. It does not constitute a full-blown market crash, but it is precisely the kind of environment that sparks every new stock market crash prediction headline on the internet.
This analysis balances cold, hard data with current investor psychology to help you navigate the next stock market crash prediction.
Stock Market Crash Prediction 2026 — Key Takeaways
- The risks of a stock market crash in 2026 are rising, but a full market crash is not the base case yet. Early Q2 volatility points to a fragile market, not a confirmed collapse.
- The main market crash risks in 2026 include inflation persistence, geopolitical oil shocks, private-credit stress, and a possible AI/tech valuation reset.
- Leading stock market crash indicators include high VIX, weak technical trends, rising unemployment, softer earnings guidance, and worsening credit conditions.
- Past market crashes show that emotional selling can lock in losses, while disciplined investors often benefit most from recovery phases.
- The best investor response is to stay prepared, hold liquidity, and hedge carefully when needed, using derivatives, such as CFDs (Contracts for Difference) that allow short selling, enabling traders to potentially exploit falling prices or hedge their long-term holdings without liquidating their portfolio, though such instruments still carry risk.
Is the Stock Market Crashing in 2026?
Short answer: A 2026 stock market crash is possible, but it is not the base case yet. The current setup looks more like a high-volatility correction risk environment than a confirmed 2008-style collapse. The market is under pressure, but large institutions and market experts remain divided between a mild-correction scenario and a renewed rally later in the year.
Institutional views
The debate over whether we are facing a healthy correction or a systemic stock market crash in 2026 is split.
Federal Reserve IMF, World Bank, and OECD Wall Street banks The Fed’s March 18 statement is cautious, not catastrophic. It held rates steady and said inflation remains “somewhat elevated,” while uncertainty around the outlook also remains elevated. In plain English, the central bank is not forecasting a crash, but it is also not giving investors any clean all-clear signal. That matters because high policy uncertainty and sticky inflation tend to compress stock valuations, especially in expensive growth sectors. Global institutions are split between resilience and downgrade risk. The IMF still projects 2026 global growth at 3.3%, while the World Bank projects 2.6%, both of which imply slowing but not collapsing activity. The more recent OECD update is more worrying: it now sees global growth at 2.9% in 2026 with G20 inflation at 4.0%, largely because the Iran war has disrupted energy flows and raised inflation risks again. Wall Street is not singing from one hymn sheet. Reuters’ February strategist poll pointed to an S&P 500 year-end target around 7,500, and Barclays has since raised its own 2026 target to 7,650, though it also laid out a bear case of 5,900 if inflation stays high and private-credit stress spreads. Goldman Sachs has separately raised its U.S. recession probability to 30%, while still not treating a market crash as its central forecast.
Individual experts
Expert views are split on a 2026 stock market crash, but shared market crash reasons like bubbles and policy risks loom large—let's unpack the triggers next.
Michael Burry Jeremy Grantham Cathie Wood Michael Burry remains one of the best-known sceptics of the AI-led market boom. Reuters reported in late 2025 that he had targeted Nvidia and then Tesla while arguing that current AI-related valuations were overheated. For traders, Burry’s relevance is not that he is always right on timing, but that he is one of the loudest voices warning that overvalued leadership stocks can crack hard when sentiment changes. Jeremy Grantham has been more direct. In January 2026, GMO published its view that the U.S. stock market remains in bubble territory and that, sooner or later, the bubble will burst. That does not mean an immediate 2026 crash is guaranteed, but it reinforces the idea that valuations still leave little room for disappointment if growth or AI monetisation slips. For balance, Cathie Wood has argued that the U.S. economy is a “coiled spring,” with AI and innovation potentially supporting another leg higher in risk assets. That bullish case matters because many crashes fail to happen precisely when everyone starts expecting them. If oil stabilises, inflation cools, and earnings stay strong, the same market now accused of being fragile could recover quickly.
2026 market snapshot
The table below summarises the key market readings that frame the stock market crash debate.
Indicator End of Q1 2026 reading Why it matters Nasdaq Composite 23,500 on March 27; in correction It confirms the risk appetite has weakened materially S&P 500 6,477.16 on March 27; around 6,513–6,519 on March 27 trading snapshots The broad market is under pressure but not yet in bear-market territory VIX About 26.9 to 27.4 Elevated fear and option demand Unemployment rate 4.4% in February 2026 The labour market is stable, but close to the level investors would treat as a warning NY Fed recession probability 20.7% for the next 12 months Not panic, but meaningfully above complacent levels 10Y–3M Treasury spread +0.69 on March 26 The curve has re-steepened, so the current signal is more about lagged recession risk than a fresh inversion
Bottom line on the 2026 stock market crash debate
- Bear case: inflation, oil, and crowded AI positioning turn a correction into a deeper unwind.
- Base case: volatility stays elevated, but earnings prevent a full collapse.
- Bull case: soft landing plus strong AI-related CapEx drives new highs later this year.
Top Reasons for a Stock Market Crash in 2026
The reasons for the 2026 market crash boil down to economic triggers, market risks, and global shocks. Understanding the causes may help traders position ahead.
Economic triggers
- Sticky inflation and higher-for-longer rates: The first major risk is that inflation proves harder to kill than investors expected. The Fed has already flagged inflation as still elevated. At the same time, Fed officials, including Jefferson, Cook, and Barr, have all warned that higher energy prices could push inflation higher again and delay rate cuts. Markets that were once hoping for a quicker easing cycle are now being forced to reprice a more restrictive path.
- Recession risk without a fresh inversion: The outline’s original inverted-yield-curve angle needs an update for accuracy: the 10Y–3M spread is positive again in late March 2026. But that does not erase recession risk. The New York Fed’s recession-probability model is still around 20.7%, which means the market is still living with the lagged effects of the prior inversion cycle, not a clean macro reset.
Market-specific risks
- AI and mega-cap concentration risk: A large share of the 2025–2026 upside came from AI-linked enthusiasm and a relatively narrow group of mega-cap leaders. Investors are increasingly questioning whether all that AI spending will pay off quickly enough, while Big Tech could spend roughly $630 billion on AI infrastructure in 2026. If monetisation disappoints, the same stocks that drove the rally could become the epicentre of a sharper selloff.
- Private credit and corporate-default stress: Another weak point is credit. Fitch says U.S. private credit defaults hit a record 9.2% in 2025. In March 2026, Reuters reported rising redemption pressures across private credit funds, with firms such as Ares, Apollo, and BlackRock limiting withdrawals or facing scrutiny. That does not equal a systemic crisis yet, but it does increase the odds that equity investors start demanding a larger risk premium.
Global factors
- Middle East conflict and oil shock: The biggest immediate catalyst behind the early Q2 2026 market wobble is the war-related oil shock. Reuters reported that Barclays sees a prolonged Hormuz disruption potentially knocking out 13 to 14 million barrels per day of oil supply. That kind of energy shock feeds directly into inflation, bond yields, consumer spending pressure, and lower equity multiples.
- Housing and consumer softness: The housing market is not collapsing, but it is soft enough to matter. Mortgage rates have climbed back to 6.38%, construction spending unexpectedly fell in January, new-home sales dropped to the lowest level since October 2022, and builder sentiment remains below 50. These are classic signs of an economy losing some cyclical momentum.
Oil Forecast and Price Predictions 2026
Risk-factor table
This table groups reasons for market crashes that 2026 investors should watch. It reflects early Q2 2026 conditions rather than generic evergreen risks.
Risk factor Q2 2026 status Crash implication Inflation Re-accelerated risk due to oil shock Fewer rate cuts, lower equity multiples Fed policy Still restrictive, no rush to ease Pressure on valuation-heavy growth stocks Oil/geopolitics Major live risk Can trigger stagflation fears AI valuations Still controversial Bubble unwind risk if monetisation disappoints Private credit Defaults and redemptions are rising Potential spillover into broader risk sentiment Housing Soft but not broken Adds recession probability if weakness deepens A table showing the main potential reasons for a market crash in 2026
Lessons from the Last Market Crash
Looking back at the 2022 Bear Market, where the Nasdaq plunged 35%, we see a clear pattern: concentration kills. Investors who were over-leveraged in single-sector tech portfolios saw their wealth evaporate, while those with diversified "defensive" holdings (Utilities, Healthcare) survived the storm.
2022 bear market recap - What happened?
The 2022 bear market remains the best recent template for a rate-driven drawdown. Reuters reported that the S&P 500 confirmed a bear market in June 2022, and by year-end, the S&P 500 was down 19.4% while the Nasdaq had fallen 33%. The triggers were aggressive Fed tightening, inflation, recession fears, and geopolitical stress.
What investors should remember:
- Concentrated portfolios were hit hardest. Owning several versions of the same growth trade is not real diversification.
- Panic selling locked in losses. Investors who sold near the lows often missed the rebound that followed later cycles.
- The macro regime mattered more than the story stocks. In rate shocks, liquidity and valuation discipline matter more than narratives.
Historical parallels
2008's leverage unwind dropped S&P by 57%; 2020 COVID crash (-34%) taught that V-shaped recoveries can be driven by stimulus.
- 2008 financial crisis: In 2008, the S&P 500 fell 38.5%, one of the worst annual performances in its history. The lesson from 2008 is that leverage and forced selling can turn a slowdown into a genuine crash. That is why traders are watching private credit so closely now.
- 2020 COVID crash: The 2020 COVID crash offers the opposite lesson. Reuters noted that the S&P 500 pandemic bear market became the shortest on record, and by August 18, 2020, the index had already regained its pre-crash high. That is the strongest reminder that panic can be expensive when markets rebound faster than expected.
In conclusion, investors may want to diversify based on true risk exposure, maintain liquid reserves for dislocations, and view corrections as potential opportunities to improve quality rather than react emotionally.
Key Stock Market Crash Indicators to Watch Right Now
Stock market crash indicators in 2026 and leading bear market signals give traders an edge. For a better perspective, you may track these fundamentals and technicals.
Fundamental warning signs
- Labour market: The unemployment rate in the US is 4.4% as of Q1 2026. That is still stable, but it is close enough to a stress threshold that another leg higher would quickly strengthen recession fears. Goldman Sachs now sees unemployment potentially rising to 4.6% later this year under the oil-shock scenario.
- Growth and recession models: The New York Fed’s recession model sits around 20.7%, while the OECD has cut its 2026 global growth forecast to 2.9%. That combination says the macro backdrop is not yet recessionary by consensus, but clearly fragile.
- Earnings: Earnings are one of the biggest reasons a crash has not become consensus. Reuters reported that Wall Street still expects roughly 14% first-quarter 2026 earnings growth. The key risk is not current earnings, but whether forward guidance deteriorates if oil stays high and demand softens.
Technical breakdown signals
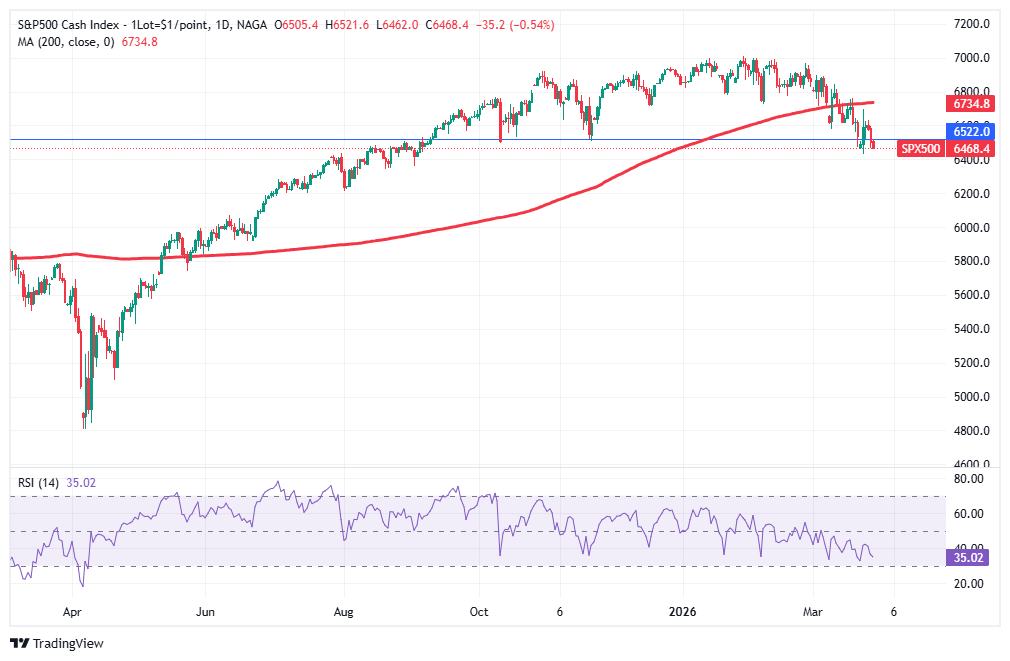
Technicals have worsened. The VIX index is around 27, the Nasdaq is in correction territory, and the S&P 500 is below its 200-day moving average. Those are not trivial signals. They mean the market trend is damaged, and institutional buyers are likely becoming more selective.
Past performance is not a reliable indicator of future results. All historical data, including but not limited to returns, volatility, and other performance metrics, should not be construed as a guarantee of future performance.
Market experts have identified the 6,522 area on the S&P 500 as an important near-term level. More broadly, the fact that all major U.S. indexes recently moved below their 200-day averages suggests the weakness is broad enough to matter, even if it has not yet become a full-blown bear market.
Past performance is not a reliable indicator of future results. All historical data, including but not limited to returns, volatility, and other performance metrics, should not be construed as a guarantee of future performance.
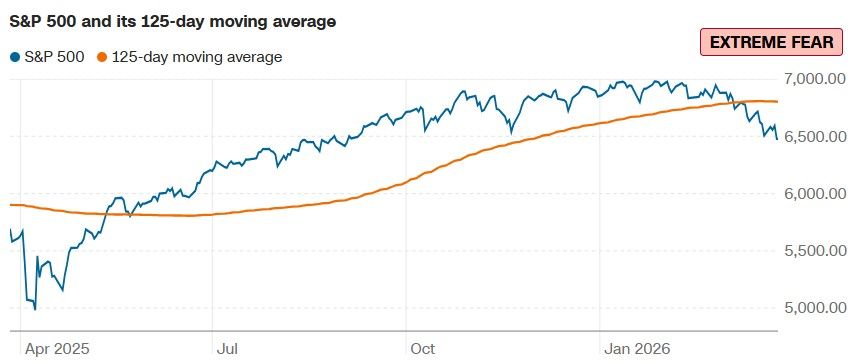
Extreme fear does not always mean “sell.” It can also mean “prepare to buy.” CNN’s Fear & Greed Index has moved into extreme fear territory, and historical data suggest that stronger forward returns have often followed such periods. That is exactly why patient investors watch panic closely rather than running from it automatically.
Essential crash checklist for traders
Investors may use this as a practical dashboard for stock market crash indicators. The figures reflect early Q2 2026 readings.
Indicator to watch Current zone Bullish/neutral interpretation Bearish interpretation VIX ~27 Volatile but still manageable Sustained move above 30–35 Nasdaq In correction Normal reset after a strong run Leadership unwind deepens S&P 500 vs 200-day MA Below Can recover if macro calms Confirms trend deterioration Unemployment 4.4% Labour is still holding up 4.5%+ with weak payrolls Earnings growth ~14% Q1 expectation Supports dip buying Guidance cuts trigger repricing Oil prices Elevated Temporary shock Persistent inflationary drag Table with essential crash checklist for traders
Top red flags investors must monitor
- Oil and inflation expectations: If energy prices stay elevated, the Fed will struggle to turn dovish.
- Forward earnings guidance: Markets can live with bad headlines longer than they can live with falling estimates.
- Credit stress: If private credit strains widen, equities could reprice more aggressively.
- Technical confirmation: If the S&P 500 loses key support and volatility spikes above 30, the “correction” label may stop being enough.
Stock Market Crash Price Predictions and Scenarios
The most sensible way to frame a next stock market crash prediction is in terms of probabilities and ranges, not absolute calls. The scenario framework below is based on current index levels, Reuters strategist data, Barclays’ latest targets, and live March 2026 macro conditions.
- Base case - mild correction: This remains the most likely path. It assumes the market continues to digest higher oil prices, slower growth, and tighter policy without sliding into a full recession. That would still feel like stocks crashing to many retail investors, but historically, it would be closer to a painful reset than a generational collapse.
- Worst case - full crash: The worst-case path needs several things to go wrong at once: a longer oil shock, falling earnings estimates, rising unemployment, and a broader credit event. Barclays’ bear case of 5,900 on the S&P 500 is a reminder that even bullish banks are now openly mapping downside scenarios.
- Bullish case - soft landing and renewed rally: The bullish case is still alive. Reuters’ strategist poll still points to 7,500 on the S&P 500, Barclays sees 7,650, and some strategists argue that U.S. equities remain attractive because earnings and innovation are still stronger than in many other markets.
Scenario Estimated probability S&P 500 range Dow range What would likely cause it Mild correction 45% 5,900–6,300 40,000–43,000 Sticky inflation, weaker sentiment, but no hard recession Full crash 20% 4,500–5,400 34,000–39,000 Oil shock, earnings recession, credit contagion Bullish soft landing 35% 7,300–7,650 up to 52,000 Earnings hold, inflation cools, AI spending still works Table with price predictions and scenarios regarding a potential stock market crash in 2026
What Investors Should Do if the Stock Market Crashes Now
If you see stock markets crashing, the worst thing you can do as an investor is panic. Instead, you may want to check these professional strategies:
Immediate defensive moves
- Raise liquidity: The first move in a fragile market is to make sure you are not forced to sell at the wrong time. Holding more cash, trimming weaker positions, and reducing leverage gives investors optionality. Cash is not dead weight in a volatile regime; it is dry powder.
- Rotate toward resilience: Defensive assets and sectors can help stabilise portfolios if volatility worsens. In practical terms, that means looking at short-duration bonds, utilities, healthcare, consumer staples, gold, and selective energy exposure while the inflation and geopolitics story remains active.
Learn more about investing in gold
Advanced strategies for active traders
- Hedge, do not gamble: Experienced traders may use puts, inverse ETFs, futures, or CFDs to hedge or express short-term bearish views. But the right frame is risk control, not bravado. Leverage can protect capital, but it can also destroy it if position sizing is poor.
- Build a crash watchlist: Experienced traders do not only plan how to survive a selloff; they also plan how to buy one. Build a list of quality companies, index ETFs, and sectors you would want to own at lower prices. That is how you may turn a crash from a threat into a potential opportunity.
Learn more about hedging in trading and investing
Long-term mindset
- Avoid emotional selling: History keeps repeating the same lesson: investors who sell in panic often miss the sharpest part of the rebound. The 2020 recovery is the cleanest example, but even many routine 5% pullbacks recover faster than fear suggests.
- Use volatility to invest better: For long-term investors, a crash is often when the future return profile improves. That is the balanced answer to "Is now a good time to invest in the stock market”: not blindly, not all at once, but often yes for disciplined investors who are adding to quality assets when everyone else is focused on fear.
How to Navigate Volatility with NAGA.com
Whether you're a long-term investor or a short-term trader, NAGA.com equips you with flexible accounts and tools to handle market volatility—here's how to get started step by step:
- Choose which type of account you want to use. Your first concern should be your risk appetite and time horizon. If you want to buy and hold stock investments, open an investing account. If you aim to capitalise on a potential stock market crash by going short with leverage, open a CFD trading account.
- Create an account. Regardless of your chosen account, you must register and complete the KYC process to verify your identity.
- Fund your account with fiat money. Before buying or trading any stocks, you need to fund your exchange account with U.S. dollars, Euros, or other supported currencies.
- Explore our trading platform: We offer multiple chart types, as well as a range of order execution tools for fast trading, which in turn helps you to manage risk.
- Copy lead traders: Alternatively, you can replicate the top-performing traders’ moves in real time with NAGA Autocopy.
Conclusion: Preparation for a Stock Market Crash Is the Only Prediction
While no one can give a definitive "next stock market crash prediction" with 100% accuracy, the indicators in early 2026 suggest a period of extreme caution. The combination of high interest rates, geopolitical shocks, and tech overvaluation creates a fragile environment.
The most accurate answer to “Is the stock market crashing?”, as of late March 2026, is this: the market is under real pressure, but it is not yet a confirmed crash. The Nasdaq is in correction territory, volatility is elevated, the S&P 500 has broken important technical support, and macro risks have increased. But earnings expectations have not collapsed, labour data is still relatively stable, and major Wall Street houses still see a plausible path to higher prices by year-end.
The right mindset for 2026 is not blind optimism or blind panic. It is about vigilance, monitoring the indicators, respecting the downside, maintaining some liquidity, and hedging prudently if needed. And remember that the investors who usually come out strongest are the ones who were ready to act when fear creates discounts.
Free resources
Before you start investing in stocks, you should consider using the educational resources we offer, such as NAGA Academy or a demo trading account. NAGA Academy has lots of free investing courses for you to choose from, and they all tackle a different financial concept or process – like the basics of analysis – to help you become a better trader or make more informed investment decisions.
Our demo account is a suitable place for you to learn more about leveraged trading, and you’ll be able to get an intimate understanding of how CFDs work – as well as what it’s like to trade with leverage – before risking real capital. For this reason, a demo account with us is a great tool for stock investors looking to transition to leveraged trading.
Sources:
- https://www.federalreserve.gov/newsevents/pressreleases/monetary20260318a.htm
- https://www.reuters.com/business/nasdaq-composite-confirms-correction-war-worries-weigh-2026-03-26
- https://www.imf.org/en/Publications/WEO/Issues/2026/01/19/world-economic-outlook-update-january-2026
- https://www.bls.gov/opub/ted/2026/unemployment-rate-4-4-percent-in-february-2026.htm