



“A stronger dollar can temporarily pressure gold lower, while renewed dollar weakness could provide the next catalyst for another move higher. A sustained break above it would confirm renewed dollar strength and keep gold under pressure, while a dollar correction on weaker US data would give gold room to recover.” says Frank Walbaum, Market Analyst at NAGA and a former hedge fund manager.
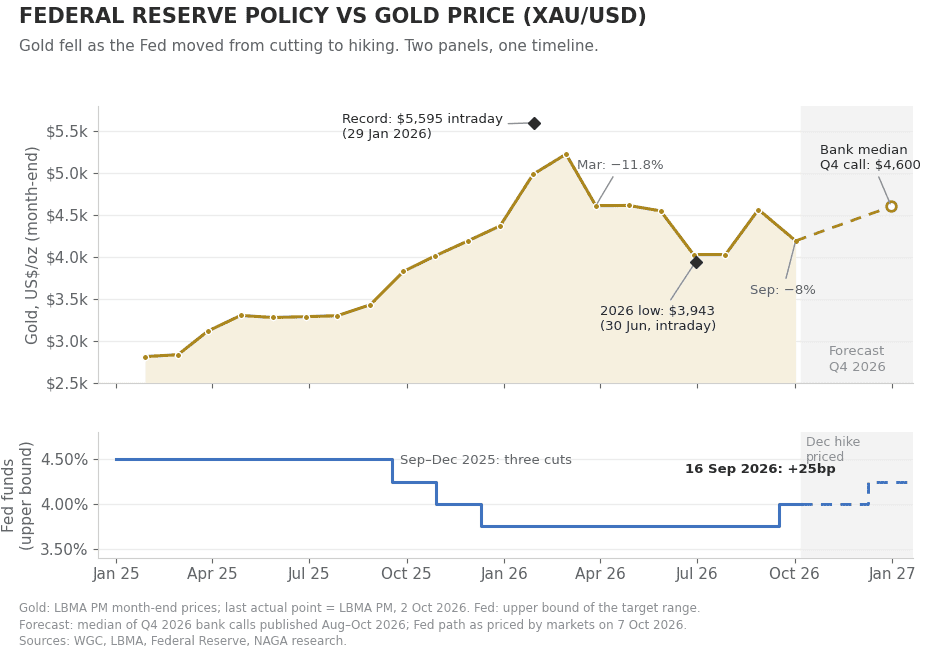
Gold entered 2026 in spectacular fashion, surging to an intraday all-time high of $5,595 per ounce on January 29, 2026 — an extension of 2025's 64% surge, itself the best annual performance since 1979. By October, however, gold was trading about a quarter below that peak.
Why did gold decrease? The US-Iran military conflict that escalated in late February 2026 proved paradoxically bearish: rising oil prices supercharged inflation expectations, prompting markets to price out Fed rate cuts and, eventually, the Fed to raise rates. Higher-for-longer real yields strengthened the dollar — gold's twin headwinds. The metal fell more than 11% in both March and June – its sharpest monthly drops in more than a decade – and hit a 2026 low of $3,943 on 30 June. After a 13% rebound in August, gold dropped more than 8% in September: the Fed raised rates on 16 September, US 10-year Treasury yields climbed above 5%, and President Trump rejected Iran’s proposal to reopen the Strait of Hormuz. Several banks have now cut their gold price predictions twice – in June–July and again after the Fed’s hike.
Gold price today: Gold spot (XAU/USD) is trading about a quarter below January’s record and roughly 2% higher than a year ago (live price above). In 2026 alone, gold has ranged from a low of $3,943 (30 June) to an intraday record of $5,595 (29 January), an extraordinary range for a single year.
Gold Forecast & Price Prediction 2026 and Beyond– Key Notes
- Gold forecast 2026: Gold is consolidating above the $4,000 area after a fall of nearly 30% from January’s $5,595 intraday record to the $3,943 June low, a 13% rebound in August and an 8% drop in September. Q4 2026 calls published since August cluster between $4,450 (Morgan Stanley) and $4,800 (Citi), with a median of $4,600; Bank of America is the outlier at $3,750. Stabilization and a modest recovery – not new record highs – is the consensus for the rest of 2026.
- BASE CASE (50% probability) — $4,000-$4,700 consolidation/recovery: oil stays near current levels without a new spike, the Fed hikes once more in December and then pauses, and gold holds the $4,000 floor and grinds back toward $4,500–$4,650 by year-end, in line with the J.P. Morgan, Deutsche Bank, Goldman Sachs and Standard Chartered calls.
- BULL CASE (25% probability) — $4,700-$5,100: a durable US-Iran deal reopens the Strait of Hormuz and oil falls, weaker US data trigger a correction in the stretched US dollar and fade December hike bets, and ETF buying accelerates. Citi’s 0–3-month target is $4,800 and Wells Fargo sees $4,900–$5,100 by year-end; most banks’ $5,000+ targets sit in 2027.
- BEAR CASE (25% probability) — $3,750-$4,100: the Fed hikes in December and signals more, US 10-year yields stay above 5% and the dollar index breaks sustainably above 102.50 or an oil spike revives inflation fears. A sharp equity sell-off could also hit gold at first, as investors cut risk across portfolios before safe-haven demand returns. Bank of America sees gold falling to $3,750 in Q4; a break below the $3,943 June low would open the $3,800 area.
- Gold forecast 2027: Gold’s 2027 outlook hinges on delayed monetary easing and sustained demand. The Fed’s median projection shows no rate cuts before 2028, while Goldman Sachs expects easing to start in September 2027 – so rate-driven support is postponed, not removed, and central bank buying remains strong. Twelve-month forecasts cluster between roughly $4,800 and $5,600: LBMA conference delegates see $5,013 by October 2027, Morgan Stanley expects a move back above $5,000 in H2 2027, and Goldman Sachs and UBS target $5,400.
- Gold forecast for the next 5 years (2030+): Longer term, structural drivers—reserve diversification, fiscal pressures, and low private allocations—continue to underpin the bullish case. Algorithmic projections for 2030 range from about $5,400 to $9,200, and J.P. Morgan has outlined an $8,000 scenario by the end of the decade, emphasizing that direction matters more than precise targets.
Get more gold sentiment and trading signals, forecasts, and news with NAGA Insights.
With NAGA.com, you can trade CFDs on gold spot (XAU/USD) if you want to speculate on price movements or invest in gold mining stocks or gold mining ETFs.
Fundamental Gold Analysis and Forecast 2026: Should you buy gold at $4,000?
Gold dominated 2025 as the top-performing major asset class, outpacing equities, while gold miners ETFs led leveraged plays. 2026, by contrast, has delivered gold’s two sharpest monthly drops in more than a decade (March and June) and a further 8% fall in September — yet the structural bull case has bent rather than broken: bank targets have come down twice, but almost every major institution still expects gold to end 2026 above the ~$4,000 level. Bank of America is the exception, with a Q4 call of $3,750.
“The $4,000 region could become an important area for long-term buyers if the underlying bullish structure remains intact,” says Walbaum. In his view, that structure is still in place despite the correction, and the Fed and the US dollar remain the critical variables for gold in the fourth quarter.
Why Is Gold Going Down? The Iran-War Paradox
The US-Iran conflict has created a structurally unusual dynamic: the very event that should trigger gold's safe-haven bid is simultaneously stoking inflation and keeping the Fed pinned at restrictive rates. Any credible ceasefire or deal to reopen the Strait of Hormuz would likely remove the oil-inflation headwind, freeing the Fed to resume cutting and the dollar to weaken — a highly bullish combination for gold. The numbers bear it out: gold is down more than 20% since the conflict began on 28 February, even as the war has dragged into its eighth month. Walbaum’s Q4 outlook points to a second reason: risk-off conditions do not always lift gold straight away, because investors facing a sharp sell-off often cut positions across asset classes – gold included – before safe-haven demand becomes dominant.
The pattern repeated in late September. A peace memorandum signed in June collapsed on 8 July, and talks to reopen the Strait of Hormuz stalled over Iran’s demands to lift the US naval blockade and oil sanctions. When President Trump rejected Iran’s proposal on 26 September and said he expected to resume bombing after the US midterm elections, Brent crude jumped to about $108 a barrel and gold fell more than 3% on 28 September to its lowest level since 5 August. Since then, a G7 release of 100 million barrels from emergency reserves has pulled Brent back to around $101, but Iran has stepped up attacks on tankers. A Hormuz deal (lower oil, fewer Fed hikes) remains the single biggest upside catalyst for gold; a new oil spike is the biggest downside risk. NAGA’s outlook treats $100 as the key reference for oil: the market has shown signs of fatigue after the geopolitical spikes, but the winter heating season adds a new source of volatility.
Fed Policy: From Cuts to the First Hike Since 2023
The Federal Reserve cut rates three times in late 2025, bringing the target range to 3.50–3.75%. Goldman Sachs had forecast two further cuts (March/June 2026) toward a 3.0–3.25% target. Those cuts did not materialise as Iran-driven inflation repriced expectations. The Fed's preferred PCE inflation gauge rose 4.1% year-over-year in May, the first reading above 4% in three years – and on 16 September the Fed delivered its first rate hike since July 2023, raising the target range by 25 basis points to 3.75–4.00% in a unanimous 12–0 vote. Fed Chair Kevin Warsh, who succeeded Jerome Powell in May, said plainly that inflation is too high and has been for too long. The Fed’s median projection now shows rates at 4.1% at the end of both 2026 and 2027 – one more hike and no cuts until 2028. Inflation is easing, though: August PCE inflation slowed to 3.4% (core 3.0%).
The rate path is now the key variable for gold’s Q4 direction. After the weak September jobs report (+29,000), markets cut the odds of another hike at the 27–28 October meeting to around 20%, but still price a hike by December. Higher policy rates have pushed US Treasury yields to multi-decade highs: the 10-year yield closed at 5.31% on 5 October, and the 10-year real (inflation-adjusted) yield reached 2.95%, up from 2.44% at the start of September. That raises the opportunity cost of holding non-yielding gold. Goldman Sachs, which cut its end-2026 target to $4,650, argues that rate hikes delay the gold rally rather than end it. With the Fed this data-dependent, individual releases are unusually market-moving in Q4: weak US data point to a more cautious Fed, a weaker dollar and support for gold, while strong data mean a firmer dollar and pressure on gold.
Past performance is not a reliable indicator of future results. All historical data, including but not limited to returns, volatility, and other performance metrics, should not be construed as a guarantee of future performance.
Central Bank Demand: Still Historically Elevated
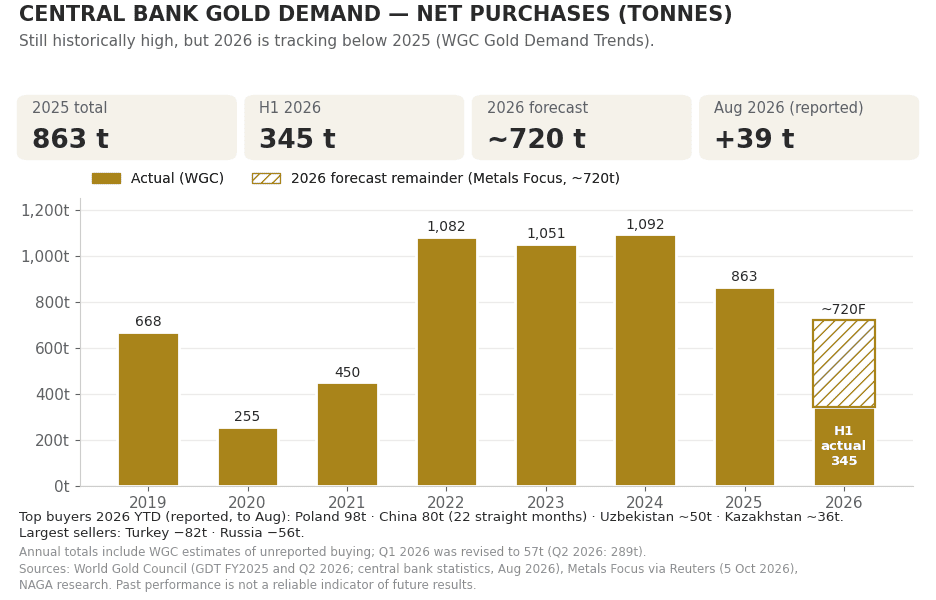
Central banks bought 863 tonnes of gold in 2025, according to the World Gold Council (WGC) – down 21% from 2024 and ending a three-year run above 1,000 tonnes, but still well above 2019’s 668 tonnes. The buying has continued through the correction: reported net purchases reached 39 tonnes in August 2026 and 170 tonnes year-to-date, led by China (20 tonnes in August, its 22nd straight month of buying), Poland (98 tonnes year-to-date, on its way to a 700-tonne target), Uzbekistan and Kazakhstan. Turkey (−82 tonnes) and Russia (−56 tonnes) have been the main sellers. In the WGC’s 2026 central bank survey, a record 45% of reserve managers plan to increase their own gold holdings over the next 12 months, and 89% expect global central bank gold holdings to keep rising.
Full-year forecasts have been trimmed. The WGC, which revised its first-quarter estimate down to 57 tonnes, expects 2026 purchases to come in below 2025’s total; first-half buying was 345 tonnes. Metals Focus forecasts about 720 tonnes for 2026, and J.P. Morgan cut its estimate to around 640 tonnes in June (from 800). Goldman Sachs is more upbeat: it estimates official-sector buying at roughly 90 tonnes a month, against a pre-2022 average of 17 tonnes, and credits central banks with nearly all of the gold price gain it expects through end-2027.
Past performance is not a reliable indicator of future results. All historical data, including but not limited to returns, volatility, and other performance metrics, should not be construed as a guarantee of future performance.
ETF Demand: Investors Buy the Dip Again
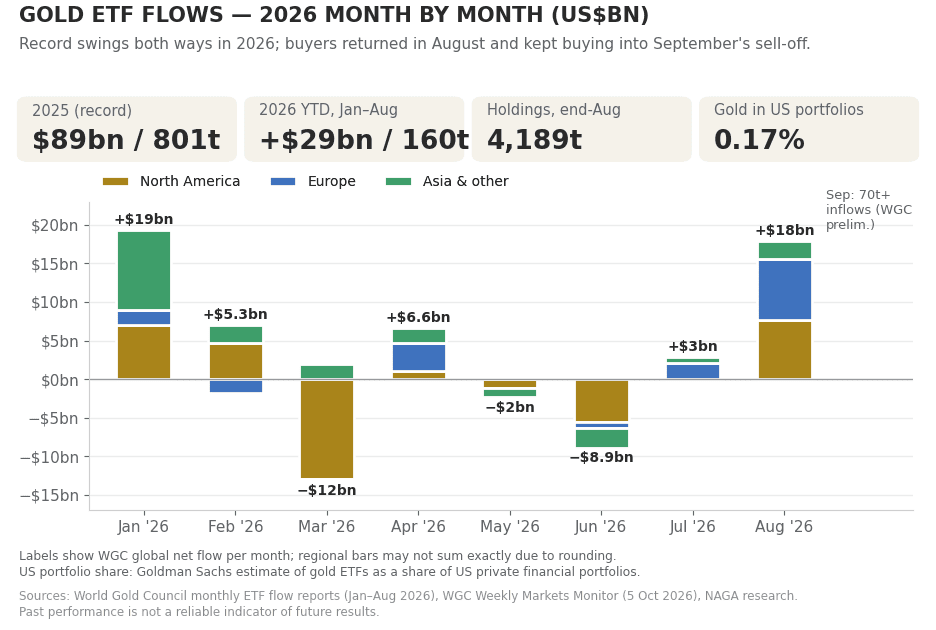
Gold ETFs recorded a record $89 billion of global inflows in 2025 (801 tonnes), led by North America ($51 billion). In 2026, ETF flows have become the swing factor, with record moves in both directions: a $19 billion inflow in January, a record $12 billion outflow in March, and $8.9 billion of outflows in June, when fading ETF demand pushed Goldman Sachs to cut its year-end target. Buyers have since returned. August brought $18 billion (121 tonnes) of inflows, lifting global holdings to a record 4,189 tonnes, and the WGC reports more than 70 tonnes of inflows in September even as the gold price fell more than 8%. Year-to-date to August, inflows total $29 billion (160 tonnes).
Goldman Sachs calculates that gold ETFs represent only 0.17% of US private financial portfolios, well below the 2012 peak. Every 1 basis-point increase in gold's share of US portfolios would add approximately 1.4% to the gold price from buying pressure alone. That low starting allocation is why flows can turn quickly. September showed the other side of the market: while ETFs bought, futures funds cut their COMEX positions by 84 tonnes – the WGC called it "a highly unusual month". Once that speculative selling is exhausted, ETF buying can become the engine of a Q4 recovery.
Past performance is not a reliable indicator of future results. All historical data, including but not limited to returns, volatility, and other performance metrics, should not be construed as a guarantee of future performance.
Supply: Inelastic in the Short Term
Global mine supply rose just 2% in Q2 2026 to 966 tonnes, while recycling fell 6% to 326 tonnes; first-half mine output reached a record 1,867 tonnes. Metals Focus forecasts mine supply up 2.4% to 3,907 tonnes in 2026 and recycling up 5.1%, but supply responses to price changes take years to materialise: new mines won’t open before the end of the decade, and all-in sustaining costs rose 16% year-on-year to $1,785/oz in Q1 2026. Supply inelasticity structurally favours the demand side of the gold equation.
Find out more about your gold investing options.
Gold Outlook: Is it worth investing in 2026?
Determining whether it's the right time to buy gold or invest in gold assets depends on various factors, including your financial goals, risk tolerance, and overall portfolio strategy. Gold is trading roughly a quarter below its January all-time high of $5,595 — meaning the entry point today is materially more attractive than it was at the start of the year, even as the structural bull case remains intact.
For the right investor, though, the current economic climate and market conditions may present an opportune moment to consider gold as part of a diversified investment strategy. Experts cite three main reasons to consider investing in gold in today's market:
- Gold has a reset entry point with recovery potential: Near the $4,000 area, gold trades below most banks’ Q4 targets (a $4,450–$4,800 cluster) and well below their 2027 targets ($5,000–$5,400), but is still supported by the same structural pillars that drove the 2025 rally: central bank buying (39 tonnes in August, per the WGC), renewed ETF inflows (record holdings of 4,189 tonnes in August), and persistent fiscal deficits driving the debasement trade. An end to Fed tightening or a deal to reopen the Strait of Hormuz could reignite the move toward bank targets.
- It is often considered a portfolio diversifier: Gold carries no counterparty risk and has historically behaved differently from equities and bonds — tending to hold value or perform differently during periods when other assets have declined. Critically, Goldman Sachs estimates gold ETFs represent just 0.17% of US private financial portfolios, well below the 2012 peak. Every 1 basis-point increase in that allocation share would add approximately 1.4% to the gold price purely from demand flow.
- It doesn’t require a lot of capital to start: CFDs on XAU/USD allow exposure to as little as 1/10th of an ounce, making it practical to size a position to your portfolio. Gold ETFs, gold mining stocks, and diversified mining ETFs like GDX also offer accessible, liquid routes in — with no storage logistics. Mining ETFs outperformed gold spot by more than 2× in 2025 (GDX +144% vs gold +64%), offering leveraged upside if the rally resumes.
However, it's essential to approach gold with a balanced perspective. Gold produces no income — unlike dividend-paying stocks or interest-bearing bonds. Volatility in 2026 is high: gold fell more than 11% in both March and June and another 8% in September, and markets still price a further Fed rate hike by December. Gold is best treated as a longer-term position sized appropriately within a diversified portfolio, not a short-term trade.
Gold Technical Analysis & Forecast Q4 2026
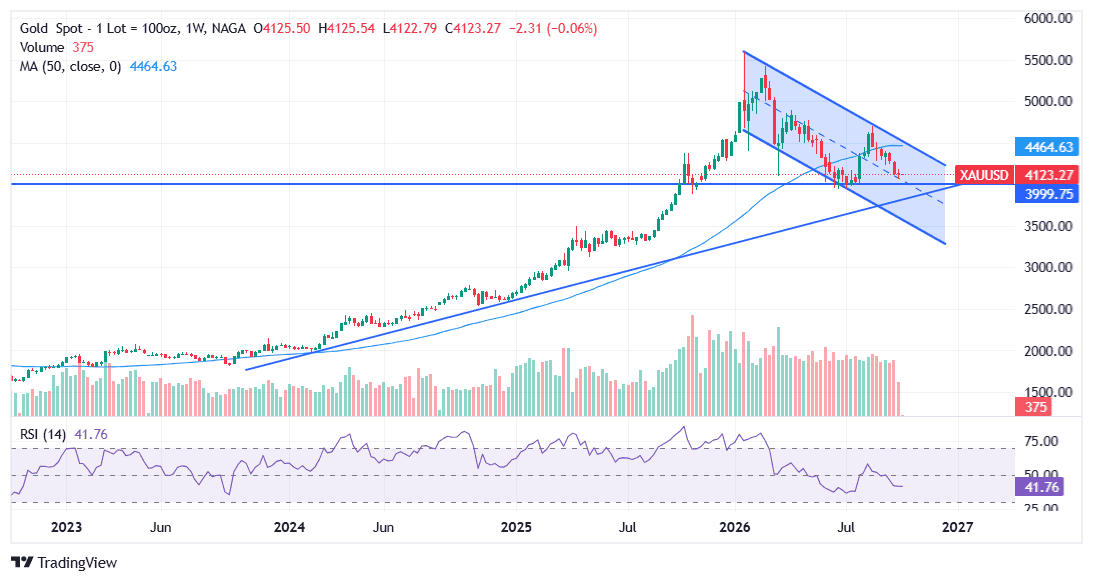
Gold's weekly chart tells a story of an intact primary trend but momentum under severe pressure. After the January blow-off top at $5,595, the price has traded within a medium-term descending channel, making lower highs and a 2026 low of $3,943 on 30 June. The break below the $4,300–$4,320 zone – then the 200-day moving average and 38.2% Fibonacci retracement – confirmed the intermediate countertrend, or secondary reaction in Dow Theory terms. August’s 13% rebound stalled, and September’s 8% drop broke support around $4,250 that had held through several tests. Gold now trades below both its 50-week and 200-day moving averages in a bear-flag pattern. Bears remain in control as long as the price stays below the $4,280–$4,300 area and within the descending channel.
Past performance is not a reliable indicator of future results. All historical data, including but not limited to returns, volatility, and other performance metrics, should not be construed as a guarantee of future performance.
While $4,100 and the psychological $4,000 level are the next supports – Morgan Stanley sees $4,000 as a strong floor – a break below the 30 June low of $3,943 would expose the critical $3,800 area, a confluence of the long-term trendline and 50% retracement. That area offers the best risk/reward entry for medium- and long-term traders, as a confirmed break below this key support will indicate a change in trend and a bearish outlook.
Gold Q4 2026 Technical Levels
LEVEL PRICE TECHNICAL SIGNIFICANCE Near Support $4,100 – $4,110 Late-September and early-October lows; bulls must hold to avoid acceleration Key Support $3,943 – $4,000 June 30 low and psychological floor; a break opens the critical $3,800 area Bear Extension $3,325 – $3,400 Extended downside target if $3,800 critical support fails ⬤ Current Price ~$4,100 – $4,200 (early Oct) Consolidation after September’s 8% drop; bear flag, bearish near-term bias Resistance 1 $4,200 – $4,230 Early-October ceiling and 61.8% retracement of the August rally; first bullish objective Resistance 2 $4,280 – $4,300 55-day moving average; a close above would suggest a low is in place Resistance 3 $4,540 – $4,600 200-day moving average and the median bank Q4 call ($4,600); gateway to the recovery scenario Major Resistance $4,900 – $5,000 Wells Fargo’s year-end range; most banks’ 2027 targets start here All-Time High $5,595 January 29, 2026 intraday record; requires an end to Fed tightening and sustained ETF buying
Take your trading to the next level with additional pro-level tools integrated into NAGA and enhance your Gold technical analysis and price prediction:
- TradingView: Access advanced charting, technical analysis, and live market data.
- Trading Central: Get AI-powered trade signals, Economic data, in-depth market analysis, and technical strategy insights.
Will Gold prices rise in the coming days?
Near-term signals are mixed-to-bearish. Gold is capped below the $4,200–$4,230 resistance; a bullish crossover on the MACD would be the first momentum confirmation. A bullish reversal requires a daily close above $4,280–$4,300 – the area Bannockburn’s Marc Chandler says "would boost confidence that a low is in place" – alongside a catalyst: a soft US CPI print on 14 October, a hold at the Fed’s 27–28 October meeting with no hint of a December hike, falling Treasury yields, a pullback in the stretched US dollar, or progress on reopening the Strait of Hormuz. If those conditions align, gold could recover toward $4,400 and then the 200-day moving average near $4,540 over the following weeks.
Will Gold prices decrease in the coming days?
The short-term downside risk is a break below the $4,100–$4,110 support on a hot US CPI print (14 October), a hawkish message from the Fed’s 27–28 October meeting, a sustained break above 102.50 in the dollar index, or a new Iran escalation that sends oil higher. Heraeus analysts see the next major support around $4,000 after gold fell through $4,250, and a close below the 30 June low of $3,943 would materially increase the probability of a test of $3,800. Sentiment is fragile: Kitco’s weekly survey on 2 October found Wall Street analysts on the brink of a bearish majority, and gold has fallen in five of the last six weeks. On the other side, physical buyers from India and China have historically stepped in on dips of this magnitude, and India’s festive season, from Navratri (11–20 October) to Dhanteras (6 November) and Diwali (8 November), is about to begin.
Gold Rate Outlook in India, Pakistan and the UAE
For readers in India, the rupee matters as much as the dollar price. With USD/INR near 96.3 – close to the rupee’s weakest level of the year (97.11 per dollar in May) – 24K gold in India has fallen less than the international price: it is about 6% below its end-August level, compared with a drop of roughly 9% in the dollar price over the same period. MCX gold futures traded in a ₹1,48,000–₹1,51,500 range in early October, according to LKP Securities. Demand has been price-sensitive: Indian dealers offered discounts of up to $78/oz in September, and gold imports fell 58% year-on-year in August after the import duty was raised in May. The festive and wedding seasons usually support physical buying from mid-October.
In Pakistan, the rupee has been stable at around Rs277 per dollar, so local rates have tracked the international price almost one-for-one: the All Pakistan Sarafa Gems and Jewellers Association’s 24K benchmark fell about 3.4% between 25 September and 7 October. In the UAE, the dirham’s peg to the dollar means Dubai rates move in line with spot gold: 24K gold fell from Dh542 per gram on 3 September to below Dh500 in late September, the lowest in more than seven weeks. For all three markets, the near-term direction depends on the same drivers – US yields, the Fed and oil – with local currency moves adding or subtracting at the margin.
Gold price predictions for 2026 from banks and leading institutions
The bank forecast landscape has changed twice since June. Most institutions cut their 2026 targets in June and July to reflect the correction, the removal of expected Fed rate cuts and softer ETF demand; a second round followed the Fed’s September hike, led by Goldman Sachs, HSBC and Bank of America. Long-term targets have held up better: delegates at the LBMA’s global precious metals conference (4–6 October) expect gold at $5,013 in 12 months. Here is where the major banks stand as of 7 October 2026:
INSTITUTION LATEST 2026 TARGET BIAS KEY DRIVER JPMorgan $4,500 (Q4); $4,300 Q3 avg Neutral, Bullish 2027 Latest call (July 3): cut ~25% from ~$6,000; “range-bound” on softer demand; central-bank floor intact Goldman Sachs $4,650 (end-2026); $5,400 (end-2027) Cautiously Bullish Cut from $4,900 in a Sept 18 note after the Fed hike; central banks buying ~90 t/month UBS $4,600 (Dec 2026); $5,400 (Sep 2027) Bullish UBS Global Wealth Management (Aug): lower real rates and a weaker dollar in 2027; sees pullbacks to $4,000 as buying opportunities Bank of America $3,750 (Q4) Bearish near term; bullish 2027 Oct 1: Iran war and oil keep inflation and rate risk alive; investor demand only supports ~$4,000; $3,500 average in 2027 if oil hits $150 Deutsche Bank $4,600 (Q4) Constructive Aug 3: correction "largely done"; central-bank demand the one strong pillar; year-end fair value ~$4,700 BNP Paribas $6,000 (February call) Bullish Pre-war call, not revised since; treat with caution Morgan Stanley $4,450 (Q4); >$5,000 (H2 2027) Bullish Sept 30: sees $4,000 as "quite a strong floor"; would add on pullbacks; strong Chinese demand Citigroup $4,800 (0–3 months); $5,000 (6–12 months) Neutral-to-bullish Aug 25: raised near-term target from $4,000; expects Hormuz tensions to ease and real rates to fall HSBC $4,490 (2026 avg) Neutral Oct 1: cut from $4,560; "further short-term downside pressure but may be nearing a bottom" Wells Fargo $4,900–$5,100 Bull Aug 17: cut 2026 range; sees $5,400–$5,600 by end-2027; still treats the correction as a buying opportunity Commerzbank $4,800 (year-end; June call) Bullish June call (Carsten Fritsch); expects Hormuz to reopen and Fed cuts in 2027; end-2027 $5,200 Standard Chartered $4,650 (Q4 avg) Constructive Sept 22 (Suki Cooper): gold’s link to real rates has weakened; the dollar is the main near-term risk LBMA conference poll $5,013 (12-month) Bullish Oct 6: delegate forecast at the LBMA/LPPM conference; last year’s poll forecast $4,980 Forecasts reflect publicly available information as of 7 October 2026. Bank targets change frequently; verify current positions with official sources.
JPMorgan gold price prediction: $4,500 by Q4 after a 25% cut
JPMorgan delivered the most consequential gold forecast revision of the summer. On July 3, the bank slashed its year-end 2026 target to $4,500 per ounce — down roughly 25% from the ~$6,000 forecast it had reiterated as recently as June — and now sees gold averaging $4,300 in the third quarter. The bank attributes the cut to weaker-than-expected demand from key gold-buying sectors and describes the market as “range-bound”, warning that risks tilt further to the downside if strong US data forces the Fed toward rate hikes.
Crucially, JPMorgan has not abandoned the structural gold bull case: it expects central bank accumulation and strengthening physical demand to leave room for further upside into 2027, framing the current phase as consolidation within a multi-year uptrend rather than a reversal. J.P. Morgan has not published a new target since July; its Q4 call now sits slightly below the $4,600 median of bank forecasts published since August.
Goldman Sachs gold forecast: $4,650 for end-2026, $5,400 for 2027
Goldman Sachs analysts Lina Thomas and Daan Struyven have cut the bank’s end-2026 gold target twice: from $5,400 to $4,900 on June 19, as gold-ETF inflows faded, and to $4,650 in a September 18 note that followed the Fed’s first hike since 2023. The bank kept its end-2027 target at $5,400, arguing that rate hikes delay the gold rally rather than end it. Its base case assumed another hike in October – which markets now see as unlikely – followed by three cuts between September 2027 and March 2028.
Goldman's floor argument rests on sovereign demand: the bank estimates official-sector purchases at roughly 90 tonnes per month, against a pre-2022 average of 17 tonnes, and credits central banks with nearly all of the ~23% gain it expects through end-2027. The main risk, in Goldman’s view, is a more hawkish Fed path, which could trigger a sharper correction.
Bank of America gold forecast: $3,750 in Q4, the most bearish call
Bank of America turned the most bearish of the major banks on October 1, warning that the risk of gold falling below $4,000 in Q4 is rising and putting its fourth-quarter forecast at $3,750 per ounce. Its analysts argue that investor demand only supports prices around $4,000 and that, "given the Iran war," a return toward $5,000 "looks unrealistic for now." Their downside scenario is stark: if oil spiked to $150 a barrel on extended Middle East tensions – not the base case – gold would average $3,500 in 2027. BofA still keeps a bullish forecast for 2027 overall, after cutting its 2026 average forecast to $4,360 in July.
UBS, Morgan Stanley, HSBC — and the remaining bulls
Morgan Stanley’s Amy Gower sees $4,000 as "quite a strong floor" and expects gold to move back above $5,000 in the second half of 2027, saying the bank would add to positions on pullbacks; its Q4 2026 target is $4,450. UBS Global Wealth Management expects $4,600 by December, rising to $5,000 by March 2027 and $5,400 by September 2027, and sees dips toward $4,000 as buying opportunities (its downside scenario is $3,850). HSBC sits at the cautious end: on October 1 it cut its 2026 average forecast to $4,490 from $4,560, warning of "further short-term downside pressure" while noting that gold "may be nearing a bottom."
Other institutional gold forecasts for Q4 2026
Even the most bullish houses have cut. Wells Fargo Investment Institute lowered its year-end 2026 range to $4,900–$5,100 in August (and sees $5,400–$5,600 by end-2027), while Deutsche Bank held a $4,600 Q4 target after concluding the correction was largely done. Citi raised its 0–3-month target to $4,800 in late August, expecting tensions around the Strait of Hormuz to ease, and Standard Chartered’s Suki Cooper forecasts a $4,650 average in Q4, arguing that gold’s link to real interest rates has weakened and that the dollar is now the main near-term risk. The roughly $1,350 gap between Bank of America ($3,750) and the top of Wells Fargo’s range ($5,100) reflects a genuine split: banks that model gold as a rate-sensitive macro asset have cut hard; banks that model it as a debasement and reserve-diversification hedge see the correction as temporary.
Gold price predictions for 2026 (AI-Based)
Algorithm-driven models remain split, and most still sit at or below the bank consensus for 2026. CoinCodex’s model projects XAU/USD between roughly $4,064 and $4,658 for the rest of 2026 (average about $4,344), and Coin Price Forecast sees only a 1% gain by year-end ($4,220). Wallet Investor is more constructive in the near term, with $4,359 for December and $5,072 on a one-year view, while LongForecast remains the bear case at $3,588 for end-2026. All figures were taken from the providers’ pages on 5–7 October 2026 and update daily.
Wallet Investor - Bullish Gold price prediction 2026
Wallet Investor forecasts that gold prices will close 2026 at $4,358.56. Their 1-year gold price prediction is $5,071.84 (+21.9%), and their 5-year forecast is $8,098.52.
Coin Price Forecast - Neutral gold price prediction 2026
According to Coin Price Forecast, gold is expected to reach $4,220 by the end of 2026, a gain of only about 1%. The model turns more bullish further out, projecting $5,331 by the end of 2027 and $7,081 by the end of 2028.
Long Forecast - Bearish gold price prediction 2026
According to Longforecast.com, gold prices could fall further before recovering. For 2026, the platform forecasts gold at $3,588 by the end of the year, before an upward trend resumes, with $4,490 at the end of 2027 and $5,997 at the end of 2028.
Gold price prediction for the next 5 years
Long-term structural drivers — de-dollarisation, central bank reserve diversification, fiat currency debasement, and rising emerging-market wealth — remain firmly intact regardless of the near-term Iran-war noise. Here is how major forecasters see gold evolving through 2030:
YEAR WALLET INVESTOR LONG FORECAST COIN PRICE FORECAST 2026 (year-end) $4,359 $3,588 $4,220 2027 $5,072 (Oct) $4,490 $5,331 2028 n/a $5,997 $7,081 2029 n/a $7,396 $8,614 2030 $8,099 (Oct 2031) $8,329 $9,176 Table with AI-driven gold price predictions for the next five years (2026-2030) – data as of 5–7 October 2026
Gold price prediction 2030: J.P. Morgan strategists led by Nikolaos Panigirtzoglou have outlined a scenario in which gold reaches $8,000 per ounce by the end of the decade if private investors raise their gold allocation from about 3% to 4.6% of portfolios. Goldman Sachs bases its long-term bullish view on three structural pillars: sustained central bank demand averaging ≈90 t/month, a secular trend toward reserve diversification away from the US dollar, and a structural lack of new mine supply. Historically, gold has risen approximately 7–8% per year over the past 50 years; compounding at that pace from early-October 2026 levels would put gold at roughly $5,500–$5,750 by the end of 2030 – below most of the long-range targets above, a reminder of how much optimism those targets already price in.
*It is worth keeping in mind that both analysts and online forecasting sites can and do get their predictions wrong. Keep in mind that past performance and forecasts are not reliable indicators of future returns.
When considering gold price predictions for 2026 and beyond, it’s important to keep in mind that high market volatility and the macroeconomic environment make it difficult to produce accurate long-term gold analysis and estimates. As such, analysts and forecasters can get their gold forecast wrong.
What moves the price of gold in the future?
Unlike almost any other asset, gold is typically neither a safety nor a risk asset, though the popular financial media have often called it both over the years (depending on how gold has been performing in recent months). Instead, it’s a currency hedge for which demand rises when there are concerns about inflation diluting the purchasing power of fiat currencies (particularly those most widely held, like the USD and EUR). In other words:
- In times of optimism (aka risk appetite), gold can either appreciate if markets believe growth will lead to inflation, or it can fall if the desire for higher yields overrides inflation concerns and investors move into more classic risk assets, which they believe will provide better returns.
- In times of pessimism (aka risk aversion), gold can either rise if markets believe that stalling growth will lead to rising deficits and/or money printing that could cause inflation, or it can also fall on fears of deflation or a market crash that feeds demand for cash. In times of panic, traders seek cash either to cover margin calls or other obligations or to be ready to go bargain hunting.
If pessimism turns to panic, then gold could either:
– rise if markets are more concerned about the USD or EUR losing their purchasing power than about near-term liquidity needs, as was the case at times from 2009 through 2011.
– fall if markets are more concerned about liquidity than the loss of purchasing power, as was the case in late 2011.
When markets are not concerned about fading purchasing power, the major currencies tend to gain against gold. That can happen due to:
- Low inflation expectations, as we saw starting in late 2011. Concerns about the global economy kept inflation fears low, and so gold began a multi-month downtrend.
- Panic periods are when markets fear a financial crisis, and liquidity becomes the top priority. We saw a gold sell-off during times of peak anxiety about the US or the EU. During these periods, investors tend to sell gold to raise cash.
These are the variables most likely to determine whether gold increases or decreases in the coming days and months:
CATALYST BULL IMPACT BEAR IMPACT US-Iran ceasefire deal Removes oil/inflation headwind; ends the hiking cycle sooner; very bullish Failure or escalation → oil spikes further; rate hike bets rise US non-farm payrolls Weak jobs data (Sept: +29K) → hike bets fade; gold rallies Strong payrolls → hawkish Fed; dollar strengthens; gold falls Fed decisions (Oct 28 meeting ~80% hold; December hike priced) A pause with no hint of a December hike revives easing bets A hike raises the opportunity cost of gold US Treasury yields Falling real yields lower the cost of holding gold 10-year above 5%, real yield ~2.9% → the biggest current headwind Central bank buying pace Goldman estimates ~90 t/month — ongoing structural floor Any surprise slowdown or selling reduces the demand floor ETF flow direction Re-accumulation → next leg higher; only 0.17% of US portfolios Sustained outflows signal loss of investor conviction Physical demand (India, China) Festive and wedding buying in India; Chinese restocking after Golden Week Price-sensitive buyers wait; Indian dealer discounts widen US dollar (DXY) A correction in the stretched dollar → cheaper gold for non-USD buyers Sustained break above DXY 102.50 → renewed dollar strength; gold headwind Equity breadth / AI momentum After the first wave of selling, a broad equity correction can revive safe-haven demand In a sharp risk-off move, investors often cut gold along with other assets first US debt/fiscal dynamics Tariff revenue shortfall → more Treasury issuance → gold as a hedge Limited near-term bear case from fiscal alone Table with the main gold rate drivers in Q4 2026
Gold price history: from $35 to $5,595 — the key moments that shaped today's market
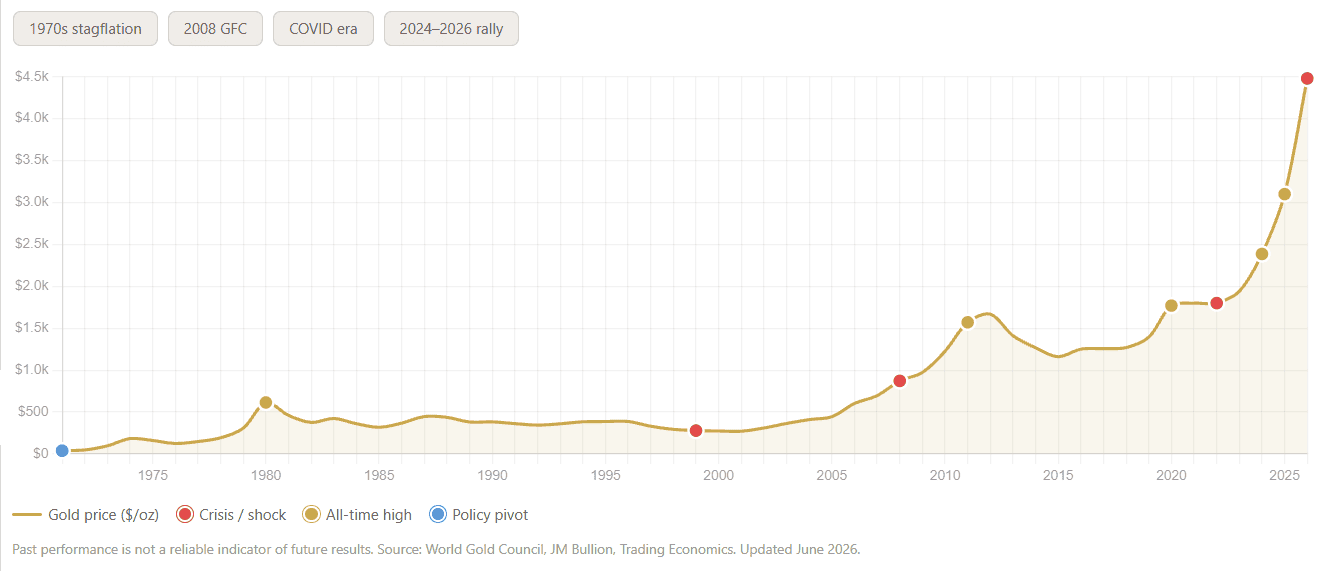
Understanding where gold is heading in Q4 2026 and 2027 requires understanding where it has been. Gold was fixed at $35 per troy ounce under the Bretton Woods system until August 1971, when President Nixon ended dollar-to-gold convertibility — the single most important event in the metal's modern history. Every rally since has been a reflection of eroding confidence in fiat currency.
Gold has set its record high price during five distinct eras, each driven by different macroeconomic forces — and the pattern is clear: each successive all-time high has been reached faster than the last. It took 31 years to surpass the 1980 high, 9 years to surpass 2011, 4 years to surpass 2020, and barely a year to surpass 2024.
Past performance is not a reliable indicator of future results. All historical data, including but not limited to returns, volatility, and other performance metrics, should not be construed as a guarantee of future performance.
1971–1980 — The first great bull market. Nixon's 1971 decision to end Bretton Woods unleashed gold from its $35 peg. Stagflation and geopolitical turmoil pushed gold to $850/oz by 1980 — a record that stood for nearly 28 years. Gold’s 1980 peak of $850 equals roughly $3,600 in today’s dollars — which means gold first broke its 1980 record in real, inflation-adjusted terms in September 2025, when it climbed above $3,600.
1999 — The 20-year low. Central bank sales and dot-com optimism crushed safe-haven demand. Gold bottomed near $252/oz in 1999 — setting up the greatest buying opportunity of the modern era. Investors who bought near the 1999 low saw roughly 10× returns.
2008 — The $1,000 barrier. Gold first broke $1,000 in March 2008 during the early stages of the Global Financial Crisis as Bear Stearns collapsed and the Fed launched emergency cuts. Gold had traded below $300 as recently as 2001.
2011 — The post-GFC peak at $1,921. US and Eurozone debt crises, combined with QE from the Fed and ECB, pushed gold to $1,921/oz in September 2011. This record has been held for nine years, until the COVID-era rally of 2020.
2020 — COVID pushes gold past $2,000. The macro effect of the COVID-19 pandemic caused gold to establish a new all-time record of $2,075 in August 2020. Near-zero interest rates, trillions in fiscal stimulus, and extreme uncertainty drove the rally.
2022 — The rate-hike bear market. The most aggressive Fed tightening cycle since 1980 — 525 basis points in 16 months — hammered gold back to about $1,615/oz as real yields spiked. A reminder that even structural bull markets experience severe corrections.
2025 — The supercycle. Gold broke through $3,000 in early 2025, $4,000 in October 2025, and surpassed $5,000 per troy ounce in early 2026. The catalyst mix was unprecedented: heavy central bank buying, three Fed rate cuts, the end of quantitative tightening, tariff-driven inflation, and ETF re-accumulation. Gold gained 64% in 2025 alone — its best annual return since 1979.
January 2026 — A new all-time high of $5,595. On January 29, 2026, gold smashed any preconceived notions about its price ceiling, hitting an intraday record of $5,595 (the LBMA PM benchmark peaked at $5,405 the same day) — the crest of the wave begun in September 2025. At more than 50% above its inflation-adjusted 1980 peak, the 2026 high represents genuine new price discovery, not simply inflation catching up.
March–October 2026 — The correction. The US-Iran conflict's inflationary consequences repriced Fed rate expectations sharply, triggering a fall of nearly 30% from the January peak to $3,943 on 30 June – including gold’s two sharpest monthly drops in more than a decade – followed by a 13% rebound in August and another 8% drop in September, when the Fed raised rates for the first time since 2023. From a historical perspective, corrections of this magnitude within structural bull markets have consistently proven to be accumulation opportunities: gold fell 33% in 2008 before ultimately tripling, and shed 45% between 2011 and 2015 before the next supercycle began.
From 1971 to 2025, gold's compound annual growth rate has been approximately 8–9%, outperforming inflation (roughly 4% annually) over the same period. However, returns vary dramatically by entry point. The lesson of history is not that gold always goes up in the short term — it is that every multi-year structural bull market has been fuelled by the same forces now in play: fiscal deficits, currency debasement, geopolitical fragmentation, and loss of confidence in the monetary system.
Gold has long reflected global economic and political stress, with its price typically rising during periods of heightened uncertainty. In the wake of the global financial crisis, gold surged past $1,000. During the COVID-19 pandemic, gold prices increased to $2,000. Then, as US tariff plans unsettled markets in March 2025, it surpassed the $3,000 mark. The $4,000 mark was first hit in October 2025, during the prolonged US government shutdown.
Conclusion: Is Gold a good investment for 2026 and beyond?
Drawing from these expert insights, the consensus for the rest of 2026 is stabilisation and a grinding recovery rather than new record highs. Bank calls for Q4 cluster between $4,450 and $4,800 per ounce (median $4,600), with Bank of America’s $3,750 as the bearish outlier, and most 12-month targets sit around $5,000. The path from the $4,000 area to those targets runs through two binaries — whether the Fed hikes again in December while Treasury yields stay above 5%, and whether the US-Iran conflict de-escalates enough to reopen the Strait of Hormuz. However, it’s crucial to note that this remains a forecast. Things can change, and there’s always a level of uncertainty.
For potential gold investors, experts from Morgan Stanley, among others, recommend some gold in a well-balanced, conservative portfolio to protect against inflation diluting the purchasing power of fiat currencies and geopolitical factors. But before you invest in gold, do your homework. Understand the risks and costs of buying and selling gold. And keep a close eye on market trends and conditions.
To sum up: experts can make educated gold forecasts and price predictions, but as with any investment, there's no 100% guarantee.
Trade Gold with NAGA.com
Make sure to create a free demo account on NAGA.com! You will be up to date on interesting updates about Gold as an investment asset, and the user-friendly interface will come in handy if you decide to start trading Gold or any other asset.
Visit NAGA Academy to learn more about trading and investing with our free courses.
Sources:
- https://www.gold.org/goldhub/research/gold-outlook-2026
- https://www.jpmorgan.com/insights/global-research/commodities/gold-prices
- https://www.federalreserve.gov/newsevents/pressreleases/monetary20260916a.htm
- https://www.gold.org/goldhub/research/gold-demand-trends/gold-demand-trends-q2-2026
- https://www.gold.org/goldhub/gold-focus/2026/10/central-bank-gold-statistics-central-banks-continue-summer-spree-august
- https://www.gold.org/goldhub/research/gold-etfs-holdings-and-flows/2026/09
- https://www.gold.org/goldhub/gold-focus/2026/10/weekly-markets-monitor-out-ordinary
- https://www.kitco.com/news/article/2026-10-01/risks-rising-gold-prices-fall-below-4000-q4-bank-america
- https://www.kitco.com/news/article/2026-09-30/gold-price-will-break-5000oz-h2-2027-and-silvers-run-120-was-driven-more
- https://investinglive.com/commodities/icymi-goldman-trims-end-2026-gold-forecast-to-4-650-but-holds-5-400-target-for-2027/
- https://www.investing.com/news/commodities-news/gold-prices-forecast-to-reach-5013-per-ounce-in-12-months-93CH-4935052