


Updated October 16, 2026. Will the pound get stronger? Against the euro, the momentum is with sterling: markets price a Bank of England rate hike on November 5 as near-certain, and UK growth has surprised to the upside. Against the dollar, the Fed’s September hike and hot US inflation keep GBP/USD close to its 2026 low. The October 28 Budget is the next big test for both.
Sterling entered 2026 with genuine momentum, briefly topping 1.38 against the US dollar in late January. Then came a sequence of shocks: the Strait of Hormuz conflict and a March selloff that took GBP/USD back toward 1.31. After a summer rebound to 1.3676 on August 21, the pound slid again in September and October as the Fed resumed hiking, setting a new 2026 low of 1.3137 on October 14.
Politics has calmed, but fiscal risk has not. Keir Starmer announced his resignation on June 22 and markets took it in their stride — the pound and gilts edged higher on the day — before Andy Burnham became Prime Minister on July 20 after an uncontested Labour leadership race, with John Healey as Chancellor. The focus has shifted to Healey’s first Budget on October 28: 30-year gilt yields rose above 6% on October 1 for the first time since 1998, and the Institute for Fiscal Studies says around £35 billion of tax rises or spending cuts may be needed.
Whether that Budget convinces bond markets — and whether the Bank of England raises rates on November 5, as markets now expect — will matter more for sterling in Q4 than anything else, alongside the Fed decision that lands on Budget day.
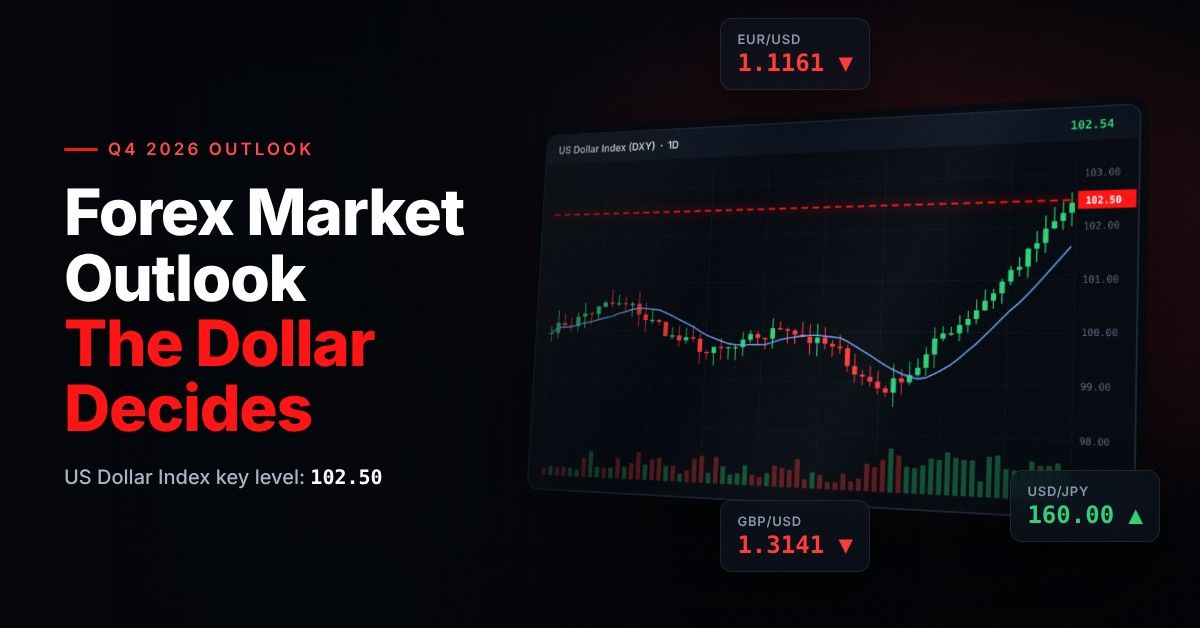
“Stronger-than-expected US economic data would likely support the dollar by reducing expectations for monetary easing and keeping US yields relatively attractive,” says Frank Walbaum, Market Analyst at NAGA and a former hedge fund manager. That is why GBP/USD remains primarily a dollar story. In NAGA’s Q4 2026 Market Outlook, he flags 102.50 on the US dollar index as the level to watch: a sustained break above it would confirm the dollar’s longer-term uptrend, while weaker US data could trigger a temporary correction. The index touched about 102.60 on October 12 before easing to around 101.9 by October 16.
British Pound Forecast 2026 — Key Takeaways
- Pound price prediction for the next 6 months: Three dates will shape the pound into year-end: UK inflation on October 21, the Budget and Fed decision on October 28, and the Bank of England on November 5. Markets price roughly four quarter-point BoE hikes over the next year, which supports sterling against the euro, while the Fed’s hiking cycle keeps GBP/USD capped. As Walbaum notes, individual data releases can trigger outsized moves in this environment.
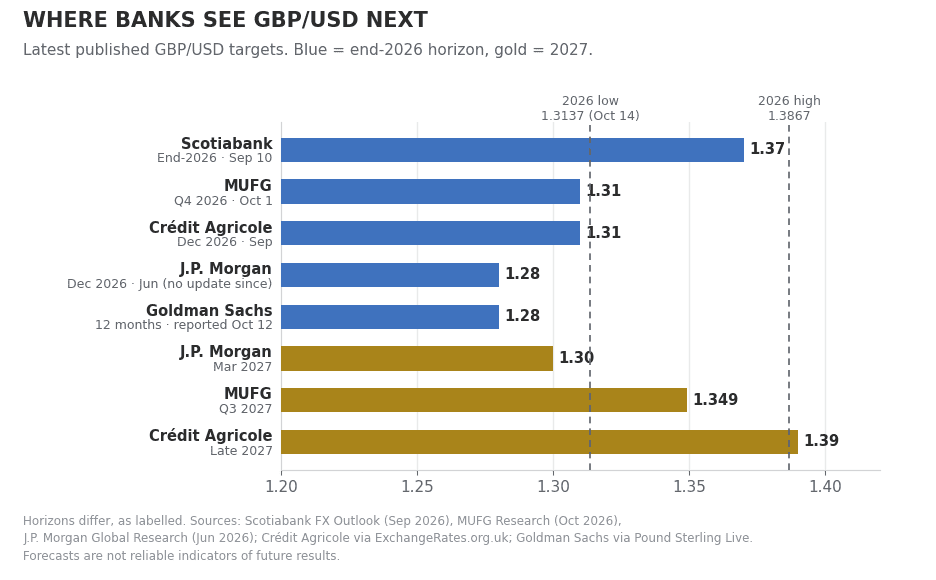
- GBP/USD Forecast Q4 2026 base case (1.30 – 1.36): Primarily a dollar story. With the Fed at 3.75–4.00% and a December hike about 90% priced, the dollar holds the upper hand, while a BoE hike provides a floor. Year-end bank calls range from 1.28 (J.P. Morgan, a June forecast) to 1.37 (Scotiabank, published before the Fed’s hike), with MUFG and Crédit Agricole at 1.31; Goldman Sachs sees 1.28 in 12 months.
- EUR/GBP Forecast Q4 2026 base case (0.8350–0.8650): The BoE–ECB gap is 125bp after the ECB’s September hike to 2.50%, but markets expect the BoE to hike next, and French fiscal stress weighs on the euro. ING sees EUR/GBP in a 0.84–0.85 range for several months and Rabobank at 0.85; MUFG expects a drift back to 0.855 in Q4 and 0.875 by Q3 2027. In pound-to-euro terms, the range is roughly 1.16–1.20.
- GBP/JPY Forecast Q4 2026 base case (¥200 – ¥214): The Bank of Japan raised rates to 1.25% on September 18, narrowing the carry advantage that took GBP/JPY to a 2026 high of ¥219.61 in July. The pair traded near ¥208.6 in mid-October; MUFG expects ¥203 by the end of Q4 and around ¥201 by mid-2027 as the yen recovers.
Note: These are illustrative scenarios only, not price targets or investment recommendations. Actual outcomes may differ materially.
- Pound Forecast 2027: Bank forecasts point to a gradual GBP/USD recovery in 2027 once the Fed’s hiking cycle ends: MUFG sees 1.333 by Q2 and 1.349 by Q3 2027, J.P. Morgan 1.30 by March 2027 (a June forecast), and Crédit Agricole 1.39 by late 2027. Against the euro, MUFG expects the pound to give back some ground, with EUR/GBP at 0.875 by Q3 2027, if the Bank of England hikes less than markets expect.
- Pound 5-Year Forecast (2027–2030+): Few banks publish forecasts beyond 2027. The long-term case for sterling rests on UK interest rates staying among the highest in the G7 and on restored fiscal credibility; the main risks are the same ones that pushed 30-year gilt yields above 6% this year — heavy borrowing and limited fiscal headroom.
Trade GBP pairs with NAGA: GBP/USD, GBP/EUR, GBP/JPY and more — CFDs with tight spreads on the NAGA platform.
British Pound Fundamental Analysis 2026
Sterling’s fundamentals in autumn 2026 look stronger than a year ago: UK GDP grew 2.1% year-on-year in August, the fastest pace in almost four years, and Bank Rate at 3.75% looks set to rise rather than fall. The risks have shifted to inflation and the public finances: CPI is 3.1% and rising with energy costs, 10-year gilt yields hit 5.51% on October 1, the highest since 2007, and the Budget has to close a sizeable gap in the public finances.
Growth, Inflation, and Fiscal
The UK economy has surprised to the upside. GDP rose 0.1% in August against expectations of a fall, 0.7% over the three months to August and 2.1% on a year earlier, and Q2 growth was revised up to 0.5%. “We have to shift from describing UK growth this year as resilient to calling it strong,” says Rob Wood, Chief UK Economist at Pantheon Macroeconomics. The labour market is softer — unemployment is 4.9% and regular pay growth is 3.5% — and inflation is moving the wrong way: CPI rose to 3.1% in August, driven by a 23% jump in motor fuel prices, and the Bank of England expects it to reach about 3¾% by the end of the year.
The fiscal side is the bigger worry. Chancellor John Healey presents his first Budget on October 28 and has said it will comply with the fiscal rules, but the Institute for Fiscal Studies estimates that around £35 billion of tax rises or spending cuts may be needed, and its director Helen Miller warns that “a ‘steady-as-she-goes’ budget is not an option available to the chancellor.” Bond markets are already nervous: on October 1, 30-year gilt yields reached 6.03%, the highest since 1998. A Budget that restores headroom would support sterling; one that relies on optimistic assumptions could revive the gilt selloff.
The Interest Dynamics
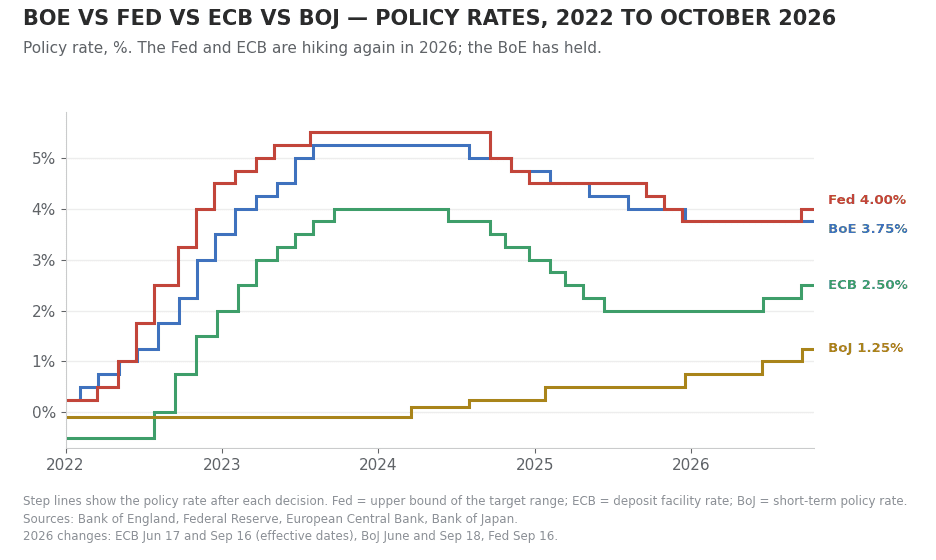
The Bank of England hiked aggressively in 2022–23 (reaching 5.25%), held there longer than the ECB or Fed, and cut six times between August 2024 and December 2025 — leaving Bank Rate at 3.75%, against 3.75–4.00% at the Fed after its September 16 hike and 2.50% at the ECB after its September hike. This configuration gives sterling a yield advantage against the euro (125bp) and a massive advantage against the yen (250bp), while leaving it slightly behind the dollar. The BoJ's slow but steady normalisation journey — from -0.10% in 2022 to 1.25% in September 2026 — is the most structurally significant long-term trend for the sterling crosses, as it is gradually compressing the GBP/JPY carry trade that has driven the pair to historically elevated levels. The BoE side of that picture is about to change: Bank Rate has been on hold since December, but the vote has split — 7–2 in June, then 6–3 in July and September, when Greene, Mann and Pill voted to raise rates to 4% — and markets now see a November 5 hike as near-certain. “It’s going to get harder to maintain that stance the longer we have high energy prices,” Governor Andrew Bailey said on September 25.
Yield Convergence with the US Dollar
UK 10-year gilt yields are only slightly above US Treasuries: on October 1 the 10-year gilt hit 5.51% while the US 10-year reached about 5.34%, its highest since 2002. That leaves little yield advantage to draw pension funds, insurers and sovereign investors into sterling. With the Fed now hiking and US inflation back at 3.7%, the dollar offers a similar yield with less fiscal risk — one reason GBP/USD has lagged even as the pound gained against the euro.
The path for GBP/USD into year-end depends on how far the Fed goes. Minutes of its September meeting show most officials expect another hike by year-end, and hot US inflation on October 14 revived bets on a move as early as October 28. If US data cool and the Fed stops after one more hike, GBP/USD could recover toward 1.34–1.36; if the Fed signals a longer cycle, 1.28–1.30 becomes the relevant range. Walbaum also cautions that “dollar strength has already become relatively stretched,” so a temporary pullback in the dollar should be part of any Q4 plan — and would give GBP/USD room to rebound.
Why Is the Pound Strong Against the Euro?
On paper, sterling’s yield advantage over the euro has shrunk: the gap between Bank Rate (3.75%) and the ECB deposit rate narrowed from 175bp at the start of 2026 to 125bp after the ECB’s hikes in June and September. Yet the pound has gained about 3% against the euro this year and touched about 1.1867 on October 14, its best level since June 2025, because markets look ahead. They expect the Bank of England to hike several times over the next year, UK growth has surprised to the upside, and France’s fiscal and political troubles have weighed on the euro — the gap between UK and French 10-year yields shrank to 41bp in early October from 137bp in May.
The risk for the pound-to-euro rate is that markets have gone too far. ING expects EUR/GBP to hold in a 0.84–0.85 range for at least several more months and says “we like the pound in the G10 space”, but MUFG argues that pricing four BoE hikes is excessive and expects EUR/GBP to drift back toward 0.875 by Q3 2027. A Budget that unsettles gilts, or a Bank of England that hikes only once, would likely pull the pound back from its highs against the euro.
The Carry Trade Under Pressure
GBP/JPY, at about ¥208.6 in mid-October after a 2026 high of ¥219.61 on July 15, remains well above its 10-year average, reflecting the extraordinary rate differential between the Bank of England (3.75%) and the Bank of Japan (1.25%). This 250bp gap has attracted substantial carry trade positioning — borrowing cheaply in yen and investing in sterling — which mechanically keeps the pair elevated if the differential persists. The risk, as the August 2024 yen flash crash illustrated, is that carry trades unwind violently and quickly when sentiment shifts.
Each BoJ rate hike compresses the differential further. The BoJ raised its rate to 1.25% on September 18, a 31-year high, in a 7–2 vote, and GBP/JPY has been stuck in a ¥207–¥211 range since an early-September drop of about 4%. It is likely to remain volatile at historically elevated levels into 2027, with the risk tilted lower as the rate gap narrows.
BANK OF ENGLAND
3.75%
Held Sep 17 — 6-3 vote, three members wanted a hike
UK CPI rose to 3.1% in August (services 3.4%) as energy costs climbed. Greene, Mann and Pill voted for 4%. Markets price a November 5 hike as near-certain; the BoE expects inflation near 3¾% by the end of the year. Bank Rate has been 3.75% since December 2025.FEDERAL RESERVE
3.75–4.00%
Hiked Sep 16 — first hike since 2023
US CPI rose to 3.7% in September (core 2.6%). Minutes show most officials expect another hike by year-end; a December move is about 90% priced. Next decision October 28 — Budget day in the UK. The Fed’s hiking cycle is the biggest near-term headwind for GBP/USD.EUROPEAN CENTRAL BANK
2.50%
Hiked Sep 10 — second hike of 2026
The deposit rate rose to 2.50% (effective September 16), narrowing the BoE–ECB gap to 125bp. French fiscal and political stress weighs on the euro. Next ECB decision October 29.BANK OF JAPAN
1.25%
Hiked Sep 18 — 31-year high
Voted 7–2 to raise rates from 1% to 1.25%, further narrowing the carry advantage that took GBP/JPY to ¥219.61 in July. USD/JPY was near 157.8 in mid-October. The BoJ’s normalisation is gradually unwinding the carry trade that has kept GBP/JPY above ¥200.
British Pound Technical Analysis
Sterling’s technical picture splits by pair: GBP/USD is testing the bottom of its 2026 range, EUR/GBP has broken down to a 16-month low, and GBP/JPY is stuck in a tight range below its key moving averages. Levels below are as of October 15–16, 2026.
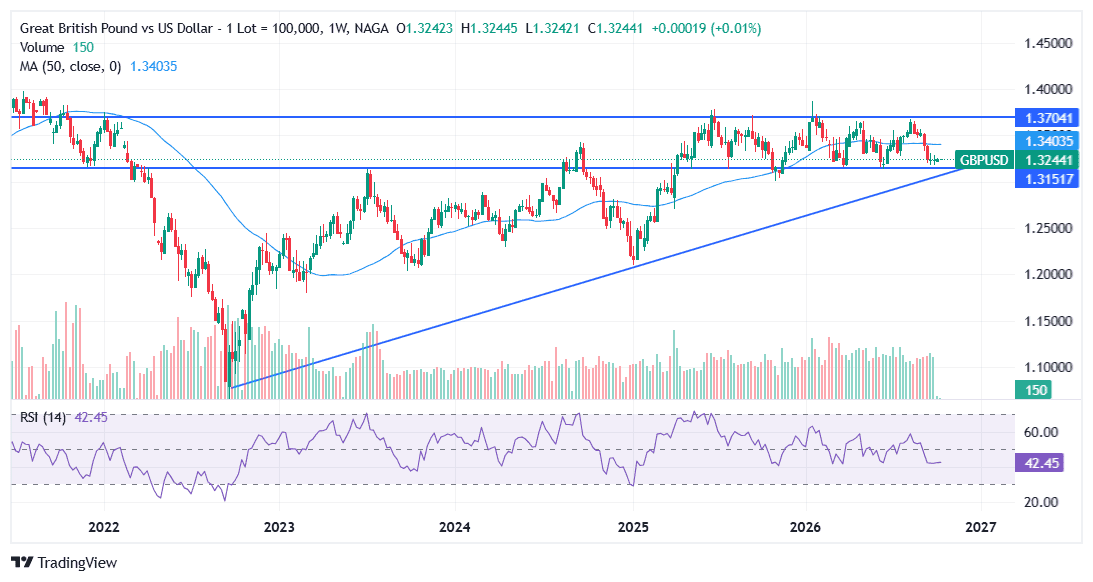
GBP/USD — Testing the 2026 Low Near 1.3140
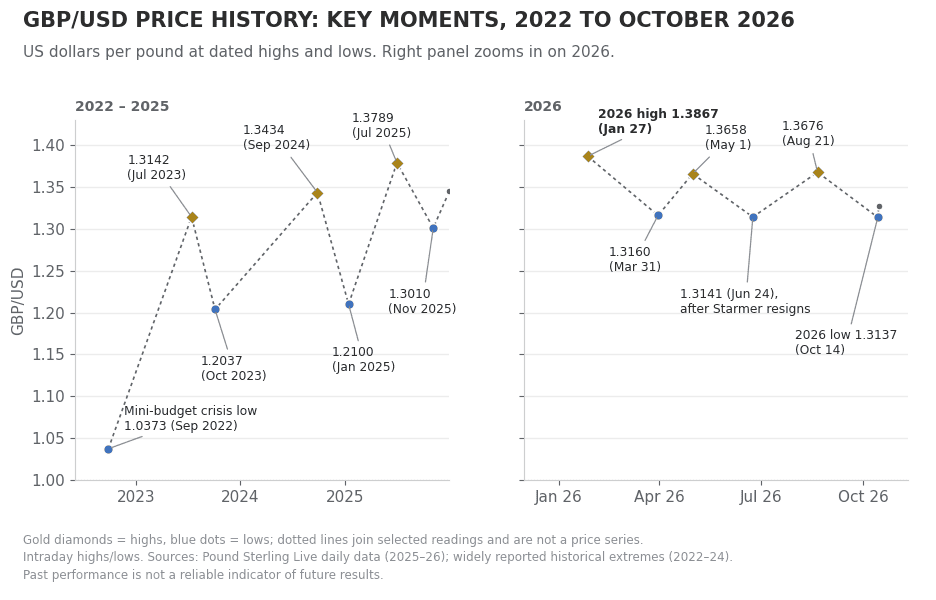
GBP/USD set its 2026 high of 1.3867 on January 27, then traded in a broad 1.31–1.37 range: lows at 1.3160 (March 31) and 1.3141 (June 24), and highs at 1.3658 (May 1) and 1.3676 (August 21). The August–October leg has taken the pair back to the bottom of that range, with a new 2026 low of 1.3137 on October 14 after hot US inflation data, before a rebound to about 1.3276 on October 15 as UK GDP beat forecasts.
Technically, the 1.3135–1.3140 area is now a triple-tested floor. UOB sees a 1.3135–1.3280 range and says “GBP must clearly break either of these levels before a more directional move can be expected.” Below it, the next supports are 1.3100, the November 2025 lows at 1.3030–1.3038 and the 52-week low at 1.3010. A break below the psychological 1.3000 level would take GBP/USD out of the range it has held for the past year.
On the upside, the first hurdles are the three-week range top at 1.3300 and the 38.2% retracement of the August–October decline at 1.3345. Above that, the 100-day simple moving average near 1.3400 and the 50- and 200-day averages around 1.342–1.344 form a dense resistance zone. Société Générale has flagged the 1.3565 pivot high as the level that must break to confirm a broader recovery, with the August high at 1.3676 and the 2026 high at 1.3867 beyond.
Momentum has improved, but the trend has not turned. The pair trades above its 20-day average (about 1.3255) and below the 50-, 100- and 200-day averages, while the daily RSI has recovered from oversold readings near 24 in late September to about 47. FXStreet’s Guillermo Alcala sees the August–October decline as a possibly completed five-wave move, but adds that “a bearish reaction at 1.3137 cancels this view.”
What would change the picture: a daily close above 1.3300–1.3345 would be the first sign of a rebound toward 1.3400, while a break below 1.3137 would expose 1.3030–1.3010. The triggers are likely to be the October 28 Fed decision and Budget, and the Bank of England on November 5.
Past performance is not a reliable indicator of future results. All historical data, including but not limited to returns, volatility, and other performance metrics, should not be construed as a guarantee of future performance.
EUR/GBP — Range Break Puts the Pound at a 16-Month High
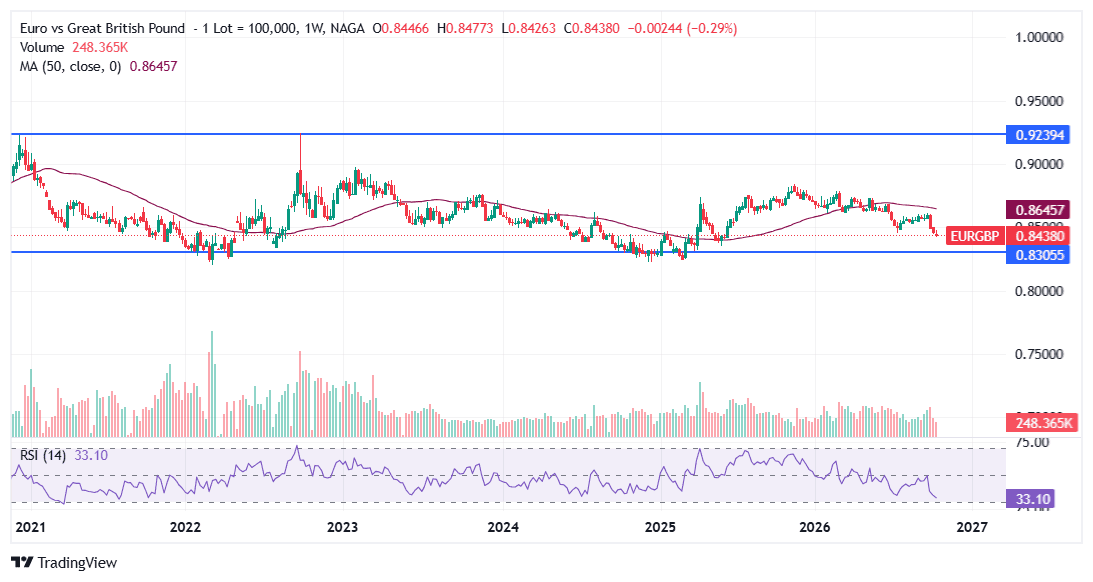
EUR/GBP broke down from its 2025–26 range in October. After trading mostly between 0.85 and 0.88 this year (high 0.8789 on February 27), the pair fell for nine straight sessions to October 7 and set a 2026 low of 0.8427 on October 14 — in pound-to-euro terms, a peak of about 1.1867 and the pound’s best level since June 2025. Price is below the 50-, 100- and 200-day averages (about 0.856, 0.857 and 0.863), and Société Générale warns: “Failure to reclaim last week’s high at 0.8500 could result in a continuation of the decline,” with projections at 0.8405 and 0.8370/0.8355.
The decline looks stretched, though. The daily RSI fell to about 29–31, and Pound Sterling Live flagged a reversal candle in GBP/EUR at the October 14 high. A daily close back above 0.8500 would ease the pressure, with 0.8523–0.8545 and the 200-day average near 0.8630 the bigger tests; a break below 0.8400 would open the April 2025 low at 0.8322.
Past performance is not a reliable indicator of future results. All historical data, including but not limited to returns, volatility, and other performance metrics, should not be construed as a guarantee of future performance.
GBP/JPY — Historically Elevated, Carry-Trade Vulnerable
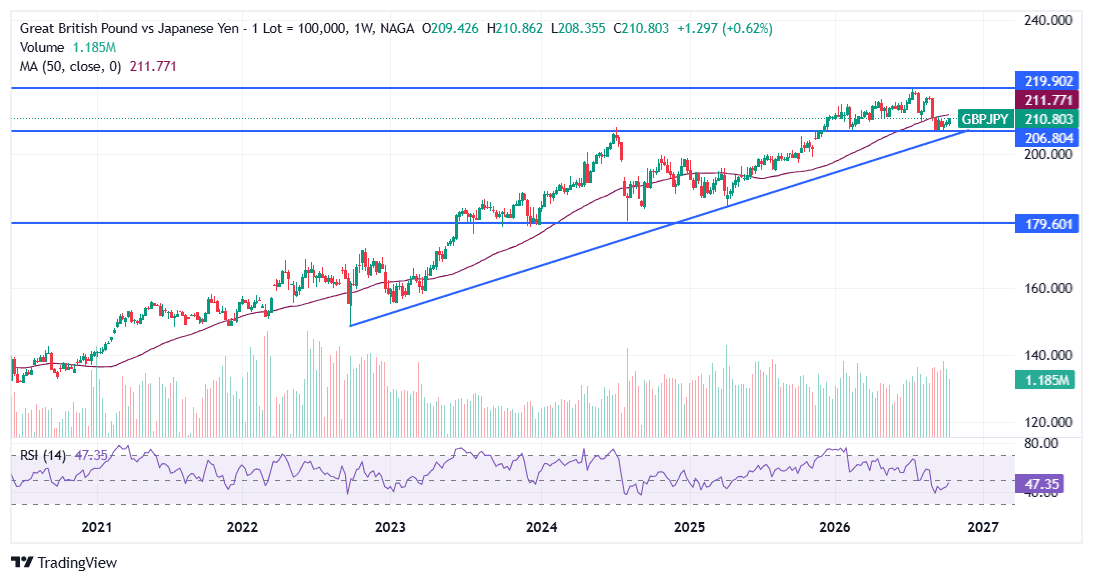
GBP/JPY, at about ¥208.6 in mid-October after a 2026 high of ¥219.61 on July 15, is well above its 10-year average. The pair has been in an overall uptrend since 2020, driven by the BoE's aggressive hiking cycle and the BoJ's ultra-loose policy — but with the BoJ now in a genuine normalisation cycle, the structural support for the pair is gradually eroding. The 50-day average has now crossed below the 200-day, and the pair has been stuck in a ¥207–¥211 range since an early-September drop of about 4%.
Technical levels to watch: ¥210.00–¥210.31 is the first resistance — a breakout above a falling trendline failed at ¥210.31 on October 14 — and analysts see a daily close above ¥210.00 as the first step toward easing the bearish pressure. Beyond that, the September 18 high at ¥211.28, the 50-day average near ¥211.9 and the 200-day average around ¥213 are the bigger hurdles. On the downside, ¥208.00–¥208.25 is first support, then the September 30 low at ¥206.89. A break below ¥207 would expose ¥205 and the round-number floor at ¥200, which would signal a more serious unwinding of the carry trade.
Past performance is not a reliable indicator of future results. All historical data, including but not limited to returns, volatility, and other performance metrics, should not be construed as a guarantee of future performance.
Pound Forecast 2026–2027 — Institution Price Predictions
GBP/USD forecasts have come down since the Fed turned hawkish: MUFG cut its Q4 target to 1.31 on October 1, and Goldman Sachs now sees 1.28 in 12 months. Scotiabank’s more bullish 1.37 for end-2026 was published before the Fed’s September hike. Several banks now favour the pound against the euro. Here is the full pound forecast from banks, as of October 16, 2026.
INSTITUTION LATEST TARGET BIAS KEY DRIVER / CAVEAT Scotiabank 1.37 (end-2026) Most bullish “We remain constructive on the GBP outlook, largely reflecting our broadly bearish view on the USD” (September 10, before the Fed’s hike). MUFG 1.31 (Q4 2026) → 1.349 (Q3 2027) Bearish near term Cut from 1.364 on October 1 as Fed hikes support the dollar; sees market pricing of BoE hikes as excessive. EUR/GBP 0.855 in Q4. JPMorgan 1.31 (Sep) → 1.28 (Dec) → 1.30 (Mar 2027) Bearish (June call) June 16 call, no update found since: “The hawkish Fed repricing has moved rate differentials in favor of the dollar both in real and nominal terms.” Goldman Sachs 1.28 (12 months) Bearish Reported by Pound Sterling Live on October 12. Expects one 25bp BoE hike in November, then a hold. ING EUR/GBP 0.84–0.85 Pro-sterling vs EUR Now expects one or two BoE hikes: “we like the pound in the G10 space.” Commerzbank EUR/GBP 0.88 (Q4 2026) → 0.86 (Q4 2027) Neutral Now expects BoE hikes in November and February, taking Bank Rate to 4.25%. Crédit Agricole 1.31 (Dec 2026) → 1.39 (late 2027) Bearish now, bullish 2027 Dollar strength near term, sterling recovery in 2027 (reported in early September). Rabobank EUR/GBP 0.85 (3 months) Pro-sterling vs EUR Raised its pound-to-euro forecasts on October 5, citing France’s political and fiscal problems.
MUFG cut its GBP/USD path after the Fed’s September hike, Goldman Sachs’ latest call is below its January view, and several banks now expect the Bank of England to hike in November — which is why forecasters are more positive on the pound against the euro than against the dollar. The next round of revisions is likely after the October 28 Budget and the November 5 BoE decision.
AI-Based Pound to US Dollar Forecasts
Algorithmic and AI-driven models show a wider range of outcomes for GBP/USD than the bank consensus, reflecting the pair's sensitivity to two distinct macro regimes (dollar-driven vs. sterling-driven) that models struggle to assign probabilities to.
MODEL 2026 YEAR-END 2027 Last updated LongForecast 1.324 (close Dec.) 1.329 (Dec. 2027) 18 Oct. 2026 Panda Forecast AI 1.3706 (target Dec.) 1.4367 (Dec. 2027) 19 Oct. 2026 WalletInvestor 1.33 ~1.35 (Oct. 2027, +1,12% in 12 months) 18 Oct. 2026 ExchangeRates.org.uk (model) 1.3638 1.3800 (Mar. 2027) last updated on 2 March 2026
AI model outputs move with recent price momentum, so they can change sharply from week to week. Treat them as a cross-check on the bank forecasts above rather than as forecasts in their own right: they extrapolate price patterns and do not model the Fed, the Bank of England or the UK Budget.
Forecasts are based on algorithmic and AI models using historical data and assumptions. They are uncertain and may not reflect future market conditions. This content is for informational purposes only and is not investment advice. Past performance is not indicative of future results.
GBP/USD Price History — Key Moments
The pound has experienced more dramatic swings than almost any other G10 currency over the past four years, from the depths of the 2022 mini-budget crisis to multi-year highs in early 2026.
September 2022: The Mini-Budget Crisis Low (1.0373)
GBP/USD fell to 1.0373 — an all-time record low — in the early hours of September 26, 2022, in the immediate aftermath of Chancellor Kwasi Kwarteng's "mini-budget," which proposed £45 billion in unfunded tax cuts. The market reaction was the most severe for sterling since the Black Wednesday ERM crisis of 1992: gilt yields spiked to levels not seen since the 2008 financial crisis, forcing the Bank of England into emergency intervention to prevent a UK pension fund liquidity crisis. Liz Truss resigned as Prime Minister shortly afterwards. The episode remains the defining moment for Sterling's volatility in the current cycle and serves as the relevant precedent for market participants weighing the risks around the October 2026 Budget.
2023: Recovery Alongside the BoE Hiking Cycle
GBP/USD recovered steadily through 2023 as the Bank of England continued hiking to 5.25% — making Bank Rate the highest since 2008 — while UK inflation, though sticky, began to ease. The pair reached 1.31 intraday in July 2023 before pulling back sharply in autumn as the US dollar strengthened on "higher for longer" Fed messaging that took GBP/USD back toward 1.21.
2024–2025: The BoE Cutting Cycle Begins
The Bank of England began cutting rates in August 2024, delivering six quarter-point cuts by December 2025 that brought Bank Rate from 5.25% to 3.75%. Despite this easing, GBP/USD held up well — making sterling the best-performing G10 currency against the dollar in 2024 — largely because the Fed was also cutting and because UK yields remained attractive in relative terms. The pair peaked near 1.38 in early July 2025 and ended the year at 1.3448.
January 2026: The 2026 High (1.3867)
GBP/USD reached its 2026 high of 1.3867 on January 27, 2026, driven by the same dollar-weakness narrative that lifted EUR/USD at the same time — expectations that the Fed would continue cutting while the BoE held at a relatively high rate.
March 2026: Hormuz Shock Low (1.3160)
The Strait of Hormuz conflict drove a broad risk-off episode in March 2026, taking GBP/USD down to 1.3160 by March 31 — below its 2025 close, erasing all of the year's gains in a matter of weeks. The pound recovered through April and May as ceasefire hopes improved market sentiment, climbing back to 1.3658 on May 1.
June 2026: Political and Monetary Shock
The week of June 16–22 delivered a cluster of events that reshaped the sterling outlook: the Fed turned hawkish on June 17, the Bank of England held at 3.75% in a 7–2 vote on June 18, and Prime Minister Keir Starmer announced his resignation on June 22. Much of the political risk had already been priced in after the May local elections, and on the day the pound and gilts edged higher. GBP/USD fell to 1.3141 on June 24, then the year’s low, before recovering as Andy Burnham’s uncontested path to Downing Street calmed nerves.
July–October 2026: Burnham, a Fed Hike and a New 2026 Low
Andy Burnham became Prime Minister on July 20, with John Healey as Chancellor, and GBP/USD rallied to 1.3676 on August 21. The tide turned in September: the Fed’s first hike since 2023 on September 16 and strong US business surveys pushed the pair below 1.33, a global bond selloff on October 1 lifted 30-year gilt yields above 6% for the first time since 1998, and hot US inflation data on October 14 sent GBP/USD to a new 2026 low of 1.3137 before a stronger-than-expected UK GDP report lifted it back toward 1.33.
GBP forecasts are inherently uncertain, and the 2026 experience — with political shocks, a Middle East conflict, and central bank pivots all arriving within weeks of each other — illustrates how quickly conditions can change. Forecasts are based on fundamental and technical analysis of historical price movements; past performance and analyst projections are not reliable indicators of future results. Never invest more than you can afford to lose.
Sources
- Bank of England — Monetary Policy Summary, September 17, 2026
- Federal Reserve — FOMC Statement, September 16, 2026
- JPMorgan Global Research — Currency Volatility: Dollar Strength (June 2026)
- MUFG Research — Monthly Foreign Exchange Outlook, October 2026
- Scotiabank Economics — Foreign Exchange Outlook, September 2026
- ONS — GDP monthly estimate, UK: August 2026
- ONS — Consumer price inflation, UK: August 2026
- European Central Bank — Key ECB interest rates
- FXStreet — British Pound: Firmer ground with BoE hike risk (ING), October 13, 2026
- Reuters via Zawya — Sterling holds near 16-month high vs euro, October 13, 2026
Other Resources
- EUR/USD forecast & price predictions 2026
- NASDAQ 100 forecast & price predictions 2026
- DAX 40 forecast & price predictions 2026
- Gold forecast & price predictions 2026
- Silver forecast & price predictions 2026
- Oil forecast & price predictions 2026
- How to trade forex
- Fundamental analysis — what moves FX
- Technical analysis tools guide