


At the beginning of 2026, the global financial landscape found itself at a fascinating crossroads. Following three years of stellar performance in 2025, where the S&P 500 index returned roughly 26%, 25% and 18%, investors asked a critical question: Is this a maturing bull market preparing for a blow-off top, or are we witnessing the structural repricing of the American economy, fuelled by the AI "Phase 2" revolution?
In this comprehensive stock market forecast 2026, we analyse the technical hurdles, fundamental catalysts, and geopolitical risks that will define the S&P 500 outlook. Whether you are looking for a 3-month stock market forecast or a prediction for the next 5 years, this guide provides the data-driven insights necessary to navigate the current volatility.
S&P 500 forecast 2026 — key takeaways
- Institutional targets: Top analysts project the S&P 500 to probably range between 7,500 and 8,000 by year-end 2026.
- Earnings drivers: AI adoption is shifting from infrastructure (Nvidia) to broad corporate productivity, supporting a 12-14% EPS growth forecast.
- Monetary policy: The Federal Reserve is expected to maintain a "shallow easing" path, targeting a neutral rate of 3.00-3.25%.
- Volatility risk: While a stock market crash forecast is not the base case, "brittle" valuations make the market susceptible to geopolitical shocks.
2026 US stock market outlook – S&P 500 performance
To understand where we are going, we must look at where we have been. The recent S&P 500 and US stock market performance is defined by a period of incredible resilience. In 2025, the S&P 500 defied sceptics who argued that valuations were overextended. The index closed 2025 near the 6,900 level, marking its third consecutive year of double-digit returns.
The 2025 stock market outlook was dominated by the easing of inflationary pressures and the start of the Federal Reserve's rate-cut cycle. The "soft landing" narrative transitioned into a "no landing" scenario, where growth remained robust despite high (but falling) interest rates. This momentum carried into early 2026, with the SPX breaching the psychological 7,000 barrier on April 15, after a 10% correction in Q1 driven by the Iran conflict and crude oil price rally.
As of May 2026, the S&P 500 outlook shows a market that is preparing for the next phase of the rally, a new leg up driven by a strong rebound in Big Tech, optimism regarding a potential peace deal in the Iran conflict, and anticipation of robust corporate earnings. Investors have largely looked beyond geopolitical risks and inflation fears, betting on a swift economic resolution.
S&P 500 forecast 2026: stock market fundamental analysis
The fundamental stock market forecast for the remainder of the year hinges on two primary pillars: Corporate Earnings and the Federal Reserve’s "Neutral Rate."
The AI Evolution: Beyond the "Magnificent 7"
In 2024 and 2025, the market was carried by a handful of tech titans. However, the stock market outlook for 2026 shows a significant broadening of the rally. We are now in "Phase 2" of AI adoption.
- Sector Rotation: We are seeing capital flow from hardware providers (like Nvidia) into the adopters—companies in healthcare, logistics, and finance that are using AI to slash operational costs.
- Productivity Gains: Analysts project that AI-driven productivity could add 150 basis points to corporate margins by the end of 2026, justifying current P/E ratios that many historically minded bears find alarming.
The S&P 500 recently traded around 23 times trailing earnings, which is high but well below the triple-digit valuations applied to tech giants in previous booms. Even the largest tech leaders, the “Magnificent 7,” recently traded at a relatively modest P/E of 25, based on estimated earnings for the next 12 months. This supports the bullish stock market outlook for 2026, with the tech index, NASDAQ-100, forecast to reach 30,000 points.
The Fed’s final descent to neutral
In 2025, the stock market forecast was characterised by the anticipation of cuts. Now, in 2026, we are dealing with the reality of a "higher-for-longer" neutral rate.
- The Pause: The Fed paused at 3.5%–3.75% in early 2026. This has created a "valuation ceiling" for the S&P 500.
- Impact on Cyclicals: While tech remains insulated by cash-rich balance sheets, the stock market outlook for cyclical sectors (Industrials, Materials) depends on whether the Fed delivers one or two final cuts late in 2026 to bring the rate toward 3.25-3.00%.
Historically, oil shocks have often triggered recessions and bear markets. Yet even at its maximum drawdown in response to the Iran conflict so far, the stock market benchmark fell less than 10%, as expectations for accelerating earnings growth among S&P 500 companies offset price-to-earnings (P/E) valuations that declined by as much as 20%.
S&P 500 technical analysis: stock market forecast for the next 3 to 6 months
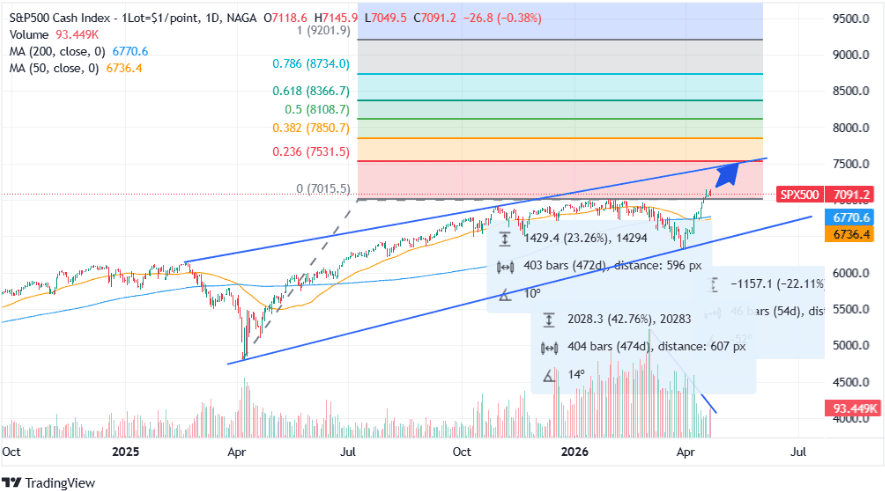
Technical indicators for the S&P 500 forecast suggest a market that is overbought but in a strong structural uptrend. The index surged by more than 12% from its March lows near 6,300. Furthermore, that rally reclaimed its 20-, 50-, and 200-day moving averages in rapid succession.
Short-term stock market outlook: S&P 500 forecast July 2026
In the stock market forecast for the next 3 months, analysts point towards a period of "healthy digestion."
- Support Levels: If the index pulls back, initial support sits at 6,880, followed by the 200-day moving average at 6,650.
- Resistance: The immediate upside target is 7,200-7300 (Fib extensions of the last counter trend).
Past performance is not a reliable indicator of future results. All historical data, including but not limited to returns, volatility, and other performance metrics, should not be construed as a guarantee of future performance.
The index is showing resilience near record highs, with the latest S&P 500 forecasts suggesting continued, though volatile, potential over the next 3 months. Analysts suggest a potential rise toward these targets by June/July 2026, despite risks from geopolitical tensions.
Stock market forecast for the next 6 months: technical targets
Looking further out, the stock market forecast for the next 6 months points toward a year-end "Santa Rally" toward the 7,600 mark.
- The Golden Star: In February 2026, the S&P 500 generated a "Golden Star" signal—a rare alignment of short-term and long-term moving averages—which historically precedes a 10%–12% gain over the following nine months.
- RSI Warning: However, the Relative Strength Index (RSI) is currently hovering around 70, indicating "overbought" conditions. Traders should expect high volatility and potential "shake-outs" after the recent new record highs.
The trend extension (last leg up) suggests the S&P 500’s normal target between 7,500 and 7,800 points, in line with big banks’ latest stock market price predictions for 2026.
Stock market forecast: Institutional S&P 500 predictions and price targets
Wall Street’s stock market predictions 2026 are notably more dispersed than they were for 2025, reflecting the uncertainty of the geopolitical climate and oil prices.
Goldman Sachs and JP Morgan forecast US stocks to post their fourth-straight year of gains in 2026, forecasting double-digit returns for the S&P500. Earnings growth is likely to drive the rally amid a solid economy and the Federal Reserve’s continued easing.
Goldman Sachs' S&P 500 price target remained anchored by projected earnings of $309 per share in 2026 and $342 in 2027. Goldman’s strategists describe the current phase as a “marathon broadening,” a shift from narrow, mega-cap tech leadership toward cyclicals and industrials that have lagged for two years. Their argument is that 12% earnings-per-share growth creates a “fundamental floor” that limits downside even in a choppy macro environment.
"The bull market is maturing, not ending. The 7,600 year-end target for the S&P 500 is a vote of confidence in the underlying health of Corporate America. With 12% earnings growth acting as a safety net, the transition from a narrow, tech-led rally to a broad-based recovery offers a more sustainable path forward.” — Goldman Sachs Equity Strategy, April 2026
Morgan Stanley’s Global Investment Committee expects monetary, fiscal and regulatory support to further reinforce this narrative:
- Fed rate cuts: The Federal Reserve delivered 75 basis points of rate cuts in 2025, and markets expect another 50 basis points in 2026.
- “Stealth quantitative easing”: Rather than shrinking its balance sheet, the Fed is quietly supporting market liquidity by reinvesting proceeds from maturing bonds into short-term Treasury bills.
- Fannie Mae and Freddie Mac purchases: To drive down borrowing costs, these government-sponsored enterprises are executing a directive to purchase billions in mortgage-backed securities.
- “One Big Beautiful Bill” Act (OBBBA): This sweeping legislation extends Trump-era tax cuts and includes major spending and tax provisions expected to spur the economy.
Many strategists are forecasting even bigger gains. Major banks have recently updated their year-end and 12-month stock market outlooks.
While J.P. Morgan raised its year-end 2026 target to 7,600 (up from 7,200) on April 21, 2026, citing robust AI-driven earnings, State Street and Deutsche Bank forecast the S&P 500 could surge to 8,000 by year-end 2026 if bullish momentum continues.
Institution 2026 S&P 500 Target Stock Market Forecast Rationale Goldman Sachs 7,600 Base case anchored by $309 EPS projection and steady growth Morgan Stanley 7,800 Expects U.S. "exceptionalism," AI-driven earnings, and efficiency gains JPMorgan 7,200 Revised lower due to oil shocks and recession risks; cautious on near-term dips Deutsche Bank 8,000 Aggressive EPS growth from cyclical recovery and broader market participation Bank of America 7,100 Neutral on multiple compression and high valuations despite EPS growth Oppenheimer 8,100 Strong buy on AI-driven margin expansion and $305 EPS at 26.5x P/E UBS 7,500 Mean target aligned with economic expansion and earnings growth Citigroup 7,700 Balanced outlook amid policy shifts and corporate resilience Barclays 7,400 Moderate gains from steady GDP and sector rotation Société Générale 7,300 Cautious optimism on global recovery Wells Fargo 7,800 Bullish on energy-adjusted scenarios and productivity Evercore ISI 7,750 EPS-led upside with risk adjustments State Street 7,550 Consensus-aligned outlook with robust U.S. GDP at 2.4% and global growth offsetting slowdowns Table with the stock market (S&P 500) price predictions
Note: This forecast has been prepared based upon information from sources believed to be reliable, but it does not warrant its completeness or accuracy. Past performance is not indicative of future results.
The 2026 stock market predictions from these institutions suggest an average upside of approximately 10% from current levels, a moderation from the explosive gains of the previous two years.
Next stock market crash prediction: risks and bear case scenarios
No stock market prediction is complete without a sober look at the risks. While the bull market is intact, the "wall of worry" is growing.
Valuations are high. With a forward P/E of 24x, the S&P 500 is trading well above its 10-year average. This makes the index susceptible to a stock market crash prediction if earnings do not live up to the hype.
- The Oil Shock: Crude oil prices pushing toward $120 represent the single biggest threat to the stock market outlook 2026. High energy costs act as a "tax" on consumers and could force the Fed to hike rates again, which is currently not priced into the market.
- The VIX: A sustained move above 25 would indicate a shift from "buy the dip" to "sell the rip."
- Unemployment: If the US unemployment rate ticks above 4.5%, the "soft landing" is officially over.
- Credit Spreads: Widening spreads in high-yield bonds would signal that the corporate sector is struggling with debt refinancing.
While no one can give a definitive "next stock market crash prediction" with 100% accuracy, the indicators in early 2026 suggest a period of extreme caution. The combination of high interest rates, geopolitical shocks, and tech overvaluation creates a fragile environment.
Long-term outlook: stock market prediction for the next 5 years
For the long-term investor, the stock market prediction for the next 5 years remains overwhelmingly positive.
- The 10,000 Milestone: Based on current earnings growth trajectories, many analysts believe the S&P 500 could reach 10,000 by 2030.
- The AI Supercycle: Much like the internet boom of the 90s, we are in the early innings of a multi-year investment cycle. While the S&P 500 forecast 2026 might see some turbulence, the secular trend is up.
- Demographics: As the "Great Wealth Transfer" continues, trillions of dollars are expected to flow into equities from ageing Boomers to younger, tech-savvy generations who favour index-based investing.
The analysts say the long-term trends remain positive, though the pace of growth is likely to be slower and less consistent compared with recent periods. Market valuation models suggest stocks are expensive relative to their average earnings over the past 10 years, signalling future returns could decline to single-digit rates from the robust 15% growth rates of the past decade.
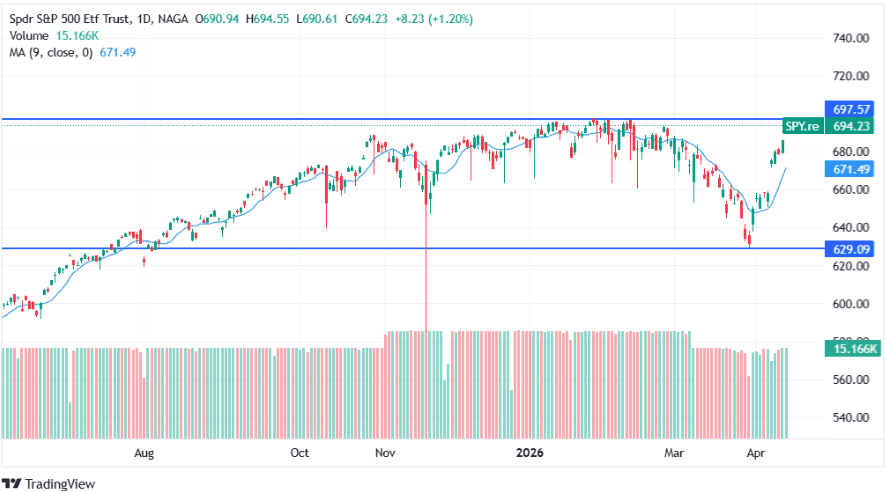
SPDR S&P 500 ETF Trust (SPY) forecast and analysis
For many retail traders, the SDPR S&P 500 ETF Trust forecast is more practical than tracking the index itself.
As of mid-April 2026, SPY is trading at $701.66.
- Liquidity: With a market cap exceeding $710 billion, SPY remains the most liquid vehicle for trading the stock market forecast.
- Technical setup: SPY is currently trading above its 200-day moving average. Technical analysts note an "Elliott Wave" structure that suggests we are in the middle of a powerful Wave 3, which could carry the ETF to $770 by December.
- Divergence alert: While prices are rising, volume has slightly declined. This "volume-price divergence" is a yellow flag for short-term traders looking for a stock market forecast for the next 3 months.
Past performance is not a reliable indicator of future results. All historical data, including but not limited to returns, volatility, and other performance metrics, should not be construed as a guarantee of future performance.
How to trade the S&P 500 on NAGA
Navigating the US stock market requires the right tools and a flexible strategy. NAGA provides multiple ways to gain S&P 500 exposure on both bullish and bearish scenarios:
CFDs on S&P 500-related assets
Trade CFDs on cash indices like USA500 (S&P 500), or individual stocks (e.g., Apple, Nvidia) with leverage up to 1:30. Go long or short for bidirectional exposure, low spreads, and no ownership—ideal for speculating on rallies or dips without expiry.
S&P stocks with ownership for long-term growth
Buy actual shares of S&P 500 constituents (3,000+ global stocks, including top index components) via NAGA's investing platform. Hold indefinitely for dividends and growth; funds are segregated for security.
ETFs tracking the S&P 500
Access CFDs or real shares in trackers like SPDR S&P 500 ETF (SPY), Vanguard S&P 500 UCITS ETF (VUAA) and other ETFs with exposure to the US stock market. Instant diversification across 500 large-caps; CFDs enable leverage/short-selling, while shares suit buy-and-hold.
Learn how to trade and invest in ETFs
Copy lead traders
Use NAGA Autocopy to mirror leaderboard traders focusing on S&P 500 assets (indices, stocks, ETFs). Allocate funds by risk level; access real strategies without manual execution—ranked by win rate and profit.