


Corn is one of the world's most essential agricultural commodities and a critical raw material for the global food, fuel, and animal feed industries. Because ethanol mandates, weather disruptions, USDA supply reports, and geopolitical trade flows all intersect in the corn market, prices can shift sharply and quickly — creating potential opportunities for investors seeking commodity exposure and portfolio diversification.
The current corn market is navigating a transition from record-breaking oversupply in the 2025/26 crop year toward a tighter 2026/27 balance sheet, with the USDA projecting a 6% decline in US production and a potential 7% drop in global corn ending stocks — a dynamic that many traders and analysts believe is setting the stage for a price recovery.
Corn Trading and Investing — Key Takeaways
- From the US Corn Belt to global ethanol mandates and livestock sectors, corn's supply chain creates predictable price drivers you can track for better-informed decisions.
- Weather, USDA reports, export demand, and biofuel policy shape corn price trends — learning these helps you anticipate potential opportunities before they fully develop.
- Investors can gain direct exposure through corn futures, CFDs, corn ETFs and ETCs, agriculture ETFs, and shares of grain processors, fertiliser companies, seed producers, and farm input businesses.
- Live charts, multiple instruments, and risk tools guide you from learning to live trading corn positions with NAGA.
Understanding the Corn Market
Corn, also known as maize, has been central to human civilisation for thousands of years, first domesticated in Mexico's Tehuacan Valley before spreading across the globe. Today, it is the most widely produced grain in the world and the most planted crop in the United States by both dollar value and acreage. Global corn production consistently exceeds 1.2 billion metric tons annually, and the market is projected to reach $377.27 billion by 2030.
Unlike other agricultural commodities such as cocoa, coffee, cotton or sugar, corn is deeply tied not only to food demand but also to livestock feed, ethanol production, and industrial supply chains, making its price drivers broader and more macro-sensitive.
The corn market attracts traders and investors because its price is simultaneously influenced by weather, energy markets, government policy, export geopolitics, and livestock demand — a rare combination that creates both volatility and clear, trackable price catalysts.
Before getting started, it helps to understand where corn comes from and why certain countries and sectors play such a critical role in shaping its price.
Top Corn-Producing Countries
Global farmers produce approximately 1.2 to 1.3 billion metric tons of corn annually. The United States is the dominant force, accounting for roughly 32% of global production (approximately 380–390 million metric tons per year), followed by:
- China (~280–290 million metric tons) — primarily for domestic feed and industrial use
- Brazil (~130–140 million metric tons) — a rising export powerhouse
- Argentina (~50–55 million metric tons) — a major Southern Hemisphere exporter
- Ukraine (~25–30 million metric tons) — a critical Black Sea supplier to European and Asian markets
- EU (combined) (~65–70 million metric tons)
On the demand side, the United States, China, and the European Union are the largest consumers, while Japan, Mexico, South Korea, and Egypt are among the world's top importers.
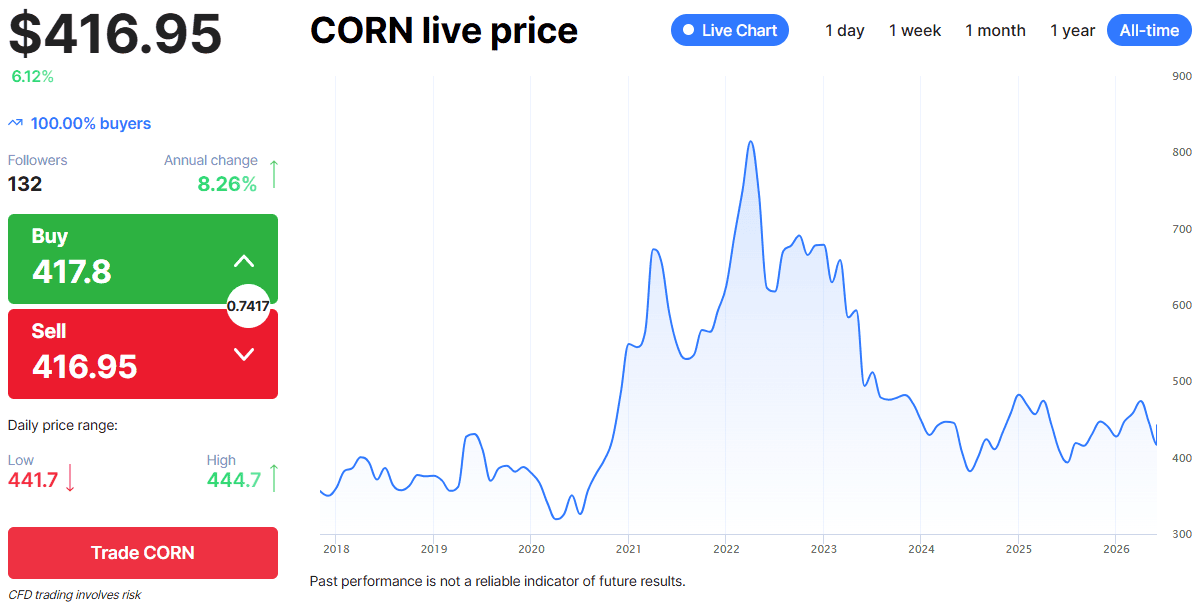
Corn Prices in Recent Years
Corn prices have experienced significant volatility since 2020, driven by pandemic supply chain disruptions, the 2022 Russia-Ukraine war (which sent prices to multi-year highs above $8.00/bushel), subsequent demand destruction, and now a gradual normalisation.
After peaking in 2022, corn prices retreated sharply through 2023 and 2024 as global harvests recovered and export demand softened. Despite the current weakness, corn rebounded to around $4.60 per bushel earlier in 2026 when geopolitical supply risks briefly flared. The USDA's June 2026 prospective plantings report confirmed that US corn acreage would fall to 95.3 million acres — 3.5 million fewer than in 2025 — providing a structural underpinning for a potential price recovery over the 2026/27 marketing year.
These price cycles — from multi-year lows to historic spikes and back — underscore corn's appeal to both speculative traders and long-term commodity investors. Producers, food companies, and livestock farmers also rely heavily on corn futures to hedge their cost exposure.
What Affects Corn Prices?
Corn prices respond to a wide and complex set of supply-side, demand-side, and macroeconomic variables. Because corn is simultaneously a food, a fuel, and a feed ingredient, it sits at the intersection of energy markets, agricultural cycles, and geopolitical trade flows — making it one of the most richly driven of all commodity markets.
Weather and Crop Conditions
Weather is the most immediate driver of corn prices, especially during the June–August US growing season. Heat, drought, or flooding during pollination can quickly reduce yield expectations and trigger futures rallies. Traders closely monitor weekly USDA Crop Progress ratings, as sharp declines in crop conditions can signal tightening supply risk and spark rapid price moves.
Supply and Demand Balance
Corn demand remains strong, with global use exceeding production for much of the past decade. However, record US output has kept supplies comfortable, including a 2025/26 crop of 16.8 billion bushels and elevated ending stocks. For 2026/27, the balance is expected to tighten as USDA projects lower global ending stocks, reduced US acreage, and more normal yields. A lower stocks-to-use ratio would support higher corn prices, making supply tightening a key bullish factor for traders and investors.
USDA Reports and Planting Cycles
USDA reports are major catalysts for corn prices, with the monthly WASDE often driving the largest moves by updating US and global supply, demand, and price forecasts. Traders also watch Grain Stocks, Prospective Plantings, and June Acreage reports for signals on inventory levels and planted area. Surprises in these releases can move futures sharply and often lift options volatility around report dates.
Export Demand and Trade Policy
Export demand is a major driver of corn prices, with the US remaining the world’s largest supplier and Mexico its top buyer. Japan, Colombia, South Korea, and China are also important sources of demand. Trade policy is a key risk: the 2026 USMCA review, tariffs, or retaliatory measures could disrupt flows to major buyers and shift demand toward Brazil or Argentina. Any loss of export share would weigh on prices, while strong foreign demand would support futures.
Currency Movements
Because CBOT corn is priced in US dollars, currency swings directly affect export competitiveness. A stronger dollar makes US corn more expensive for foreign buyers, weighing on demand and prices, while a weaker dollar supports exports and futures. The impact is most visible during periods of sharp FX moves, especially around trade-policy shocks.
Energy Prices and Input Costs
Corn is closely tied to energy markets through ethanol demand and farm input costs. Higher oil prices can support ethanol use, which absorbs a large share of the US crop, while elevated energy and fertiliser costs pressure farmer margins. With production costs still high and corn prices near breakeven or below, planting decisions may shift, potentially tightening future supply.
These drivers do not affect the corn market in isolation. They often interact with each other, meaning that a weather shock, a change in ethanol demand, or a surprise USDA report can quickly shift expectations for supply, inventories, and future prices. That is why corn forecasts usually focus less on a single price target and more on the balance between crop production, global demand, stock levels, and macroeconomic conditions.
Corn Price Forecast 2026–2030
The outlook for the corn price in 2026 and beyond reflects a transitional market. In the short term, prices are being held down by the record supplies in the 2025/26 period. However, the 2026/27 period is expected to see a significant tightening of the balance sheet, as US planted acres fall and global stocks decline.
Institution Latest corn-market outlook Market implication USDA The 2026/27 U.S. corn outlook is broadly stable, with the season-average farm price around $4.40 per bushel. Global corn ending stocks were raised in the latest update. Neutral to mildly balanced near term. Supply is not tight enough to create a clear shortage premium, but the market remains sensitive to weather. Goldman Sachs Research Disruption to nitrogen fertiliser flows could lift fertiliser costs and affect corn production economics. A risk factor for acreage, yields, and food inflation, especially because corn is nitrogen-intensive. ING Record production pressured corn prices, but a tighter 2026/27 balance could support prices as global stocks decline. Suggests prices may have already found a medium-term floor if demand holds, and production normalises. Rabobank Corn prices are expected to gravitate toward roughly $4.00 per bushel over the first five years of its baseline outlook. Points to a lower-price environment than 2021–2022, but still above some of the weakest price levels of the previous decade. J.P. Morgan Global Research J.P. Morgan remains bullish on corn, citing tighter global stocks-to-use ratios and resilient demand from ethanol and livestock markets. The bank views corn demand as structurally strong, supported by livestock growth in Asia and domestic ethanol mandates, which could help underpin prices despite supply fluctuations. OECD-FAO Global maize production is expected to expand over the next decade, driven by rising feed demand and yield growth. Long-term demand remains supported, but productivity gains may limit real price increases.
Overall, the consensus view is for a gradual recovery in corn prices through 2026/27 and beyond, underpinned by tighter global supply-demand balances. However, risks are skewed to the downside in the near term if favourable US growing season weather and strong South American output persist.
How to Trade and Invest in the Corn Market
There are several ways traders and investors can gain exposure to the corn market, depending on trading style, risk tolerance, and investment objectives. Some prefer direct speculative products like futures and CFDs for precision and leverage, while others may choose longer-term indirect exposure through funds or shares of corn-related companies.
Trading Corn Futures
When you trade corn, it is likely that you will be trading futures, the most popular way to gain corn exposure, offering high liquidity and volatility. Corn futures are standardised contracts that let traders agree to buy or sell corn at a set price on a future date.
They are traded on major commodity exchanges and are used by speculators (hedge funds, algorithmic traders, and retail investors) and commercial hedgers (farmers, exporters, etc.) to manage corn price risk.
Corn futures on CME allow traders to go long or short based on price expectations and are central to global grain price discovery. High liquidity, leverage, and extended market access make them attractive to traders, but they also amplify the risk.
Key corn futures mechanics
- Margin trading: Traders do not pay the full contract value. They deposit a small fraction (initial margin) as collateral to open a position.
- Daily settlement: At the end of each trading day, the exchange adjusts accounts. Profits are credited, and losses are deducted based on closing prices.
- Resolution: Over 99% of contracts are closed out (offset) before maturity. Very few result in actual physical delivery of corn to exchange-approved warehouses.
Key corn futures trading specifications
- Primary exchanges: CME Group CBOT (Chicago), traded in US dollars
- Contract size: One contract equals 5,000 bushels per standard contract (approximately 127 metric tons)
- Price quotation: Traded in US cents per bushel (e.g., 440 = $4.40 per bushel)
- Delivery months: Active contracts mature in March, May, July, September, and December
With NAGA, you can trade CFDs on Corn Futures. With CFD trading, you can deal on changing prices of corn futures without buying or selling the contract. CFD trading uses leverage, which means you only need to put up a small margin to gain exposure to the full value of the trade. This can magnify your potential profit – but also your potential loss.
Corn ETFs and Exchange-Traded Products
Because corn is a physical agricultural commodity, investors cannot hold physical corn bushels in a traditional fund. Instead, asset managers use Exchange-Traded Products (ETPs) that primarily fall into three structural types:
Pure-Play Corn ETFs
Pure-play corn ETFs are the most accessible way to trade corn price movements through a standard brokerage account. They provide exposure to corn futures prices without requiring investors to trade futures directly.
- How they work: The fund holds a basket of CBOT corn futures contracts with staggered expiration dates. This structure helps reduce roll risk and smooth the “contango roll cost” that can affect single-month commodity ETFs.
- Key example: Teucrium Corn Fund (Ticker: CORN). Listed on the NYSE, CORN is the only ETF offering pure, unleveraged exposure to corn futures prices. The fund has an expense ratio of 0.94% and issues a K-1 for US tax purposes, which investors should consider during due diligence.
Leveraged and Inverse Corn ETPs
Leveraged corn ETPs are designed for short-term tactical traders who want amplified exposure to daily corn futures price movements. They are not intended for long-term buy-and-hold investing because daily rebalancing can cause performance to diverge over time.
- How they work: The fund targets a multiple of the daily return of corn futures, usually through futures contracts or derivatives. Because exposure is reset daily, returns over several days may differ significantly from the stated leverage multiple, especially in volatile or trending markets.
- Key example: Teucrium 2x Daily Corn ETF (Ticker: CXRN). CXRN targets twice the daily return of front-month corn futures. If corn futures rise 1% in a day, the fund seeks a 2% gain; if prices fall 1%, it targets a 2% loss.
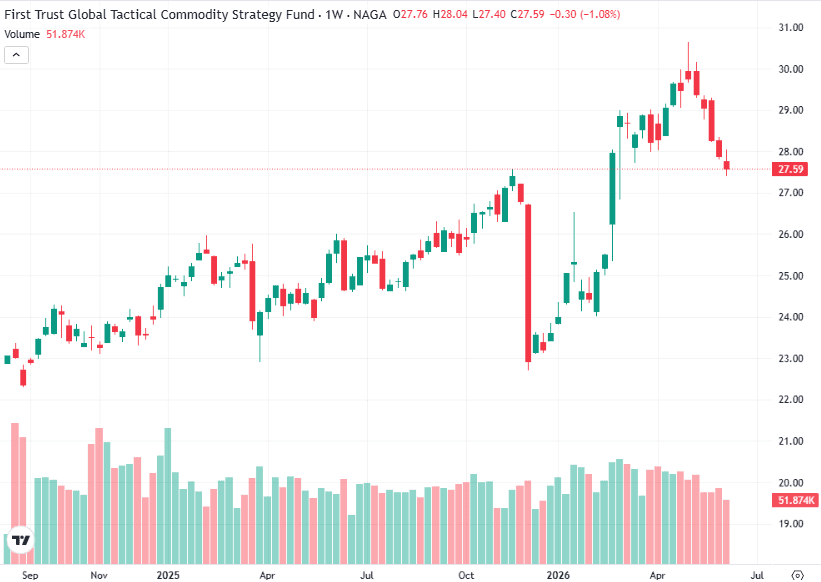
Multi-Commodity Agricultural ETFs
Multi-commodity agricultural ETFs provide diversified exposure to corn alongside other major agricultural markets. They help reduce single-commodity concentration risk by spreading exposure across grains, livestock, and broader commodity assets.
- How they work: These funds hold or track a basket of agricultural futures, ETFs, or commodity-linked instruments. By combining corn with other commodities such as wheat, soybeans, sugar, and livestock, they can help cushion corn-specific volatility.
- Key example: First Trust Global Tactical Commodity Strategy Fund (FTGC). FTGC is a broader commodity fund that includes agricultural exposures, including corn, alongside energy and metals.
Past performance is not a reliable indicator of future results. All historical data, including but not limited to returns, volatility, and other performance metrics, should not be construed as a guarantee of future performance.
These multi-commodity funds cushion corn-specific volatility by diversifying across the agricultural sector. They are generally better suited to investors seeking broad agricultural exposure rather than direct corn price speculation.
Exchange-traded funds (ETFs) are one of the most rapidly gaining in popularity as an investment asset. You can take advantage of it for trading on NAGA on convenient terms.
Corn and Agriculture Stocks
Corn-related stocks are shares of publicly traded companies whose revenues, margins, and business models are tied to the corn supply chain. Because investors cannot buy stock in corn itself, they buy shares in the businesses that touch the crop — from field inputs to processing, logistics, and equipment. Agriculture stocks are categorised into three main stages:
- Input Providers (Upstream): Companies that supply seeds, fertilisers, and crop protection products used by corn farmers. Their revenues often rise when corn acreage is high, and farmers invest in premium inputs (e.g., Corteva, CF Industries).
- Processors and Traders (Midstream): Companies that buy, transport, trade, and process corn into ethanol, sweeteners, starches, and animal feed (e.g., Archer-Daniels-Midland, Bunge Global, Ingredion).
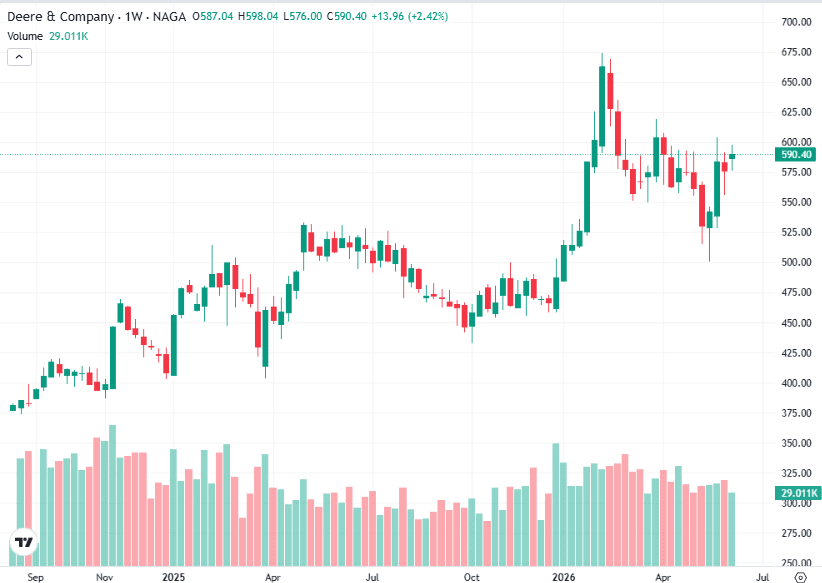
- Equipment Makers: Manufacturers of the machinery used to plant, treat, and harvest large corn crops. Demand can increase when corn acreage and farm profitability are strong (e.g., Deere & Co.).
Stock prices may be influenced not only by corn prices, but also by company performance, operating leverage, and broader market conditions.
Past performance is not a reliable indicator of future results. All historical data, including but not limited to returns, volatility, and other performance metrics, should not be construed as a guarantee of future performance.
With NAGA, you can invest in stocks with ownership or trade stocks via CFDs for more flexibility.
Pros and Cons of Investing in the Corn Market
Corn can be a useful commodity for active traders and diversified investors, but it carries specific risks.
✅ Pros of Investing in Corn
❌Cons of Investing in Corn
- Deep liquidity: Corn futures are among the most actively traded agricultural contracts.
- Global demand: Corn is used in feed, fuel, food, and industrial products.
- Diversification: Corn may behave differently from stocks and bonds.
- Seasonal opportunities: Planting, pollination, and harvest periods create repeatable market catalysts.
- Inflation sensitivity: Corn may benefit from food, energy, and input-cost inflation.
- Hedging utility: Farmers, food companies, and livestock producers use corn to manage price risk.
- Weather risk: Droughts, floods, heat, and frost can cause fast and unpredictable price swings.
- Leverage risk: Futures and CFDs can magnify losses as well as gains.
- Roll costs: Futures-based ETFs and ETCs may lose value when contracts are rolled in contango.
- Policy risk: Biofuel mandates, tariffs, export restrictions, and trade disputes can shift demand quickly.
- Currency risk: A stronger U.S. dollar can reduce U.S. export competitiveness.
- Company-specific risk: Corn-related stocks are affected by management, balance sheets, and broader equity markets.
Table with key advantages and risks of investing in the corn market
Are you looking to build a long-term buy-and-hold position in the corn market, or are you looking to execute short-term tactical trades? Open a demo account and find the most suitable strategy for you to gain exposure to the corn market.
Corn Futures Trading Strategies and Examples
Once you've familiarised yourself with the different ways to trade corn, you can choose the method and strategy that best fits your risk appetite, time horizon, and market view.
Popular Corn Trading Strategies
- Seasonal trend trading (crop cycle strategy): Trading the predictable seasonal patterns — buying ahead of weather-sensitive summer months, positioning around USDA WASDE reports
- Spread trading (calendar spreads): Exploiting price differences between different delivery months (e.g., July vs. December corn) based on expected storage costs and supply seasonal shifts
- Energy-corn correlation trading: Trading corn in conjunction with crude oil and ethanol markets when policy or energy price shocks are expected to drive demand shifts
- WASDE report positioning: Taking positions ahead of or reacting to the monthly USDA supply/demand report — one of the most market-moving scheduled events in agricultural commodities
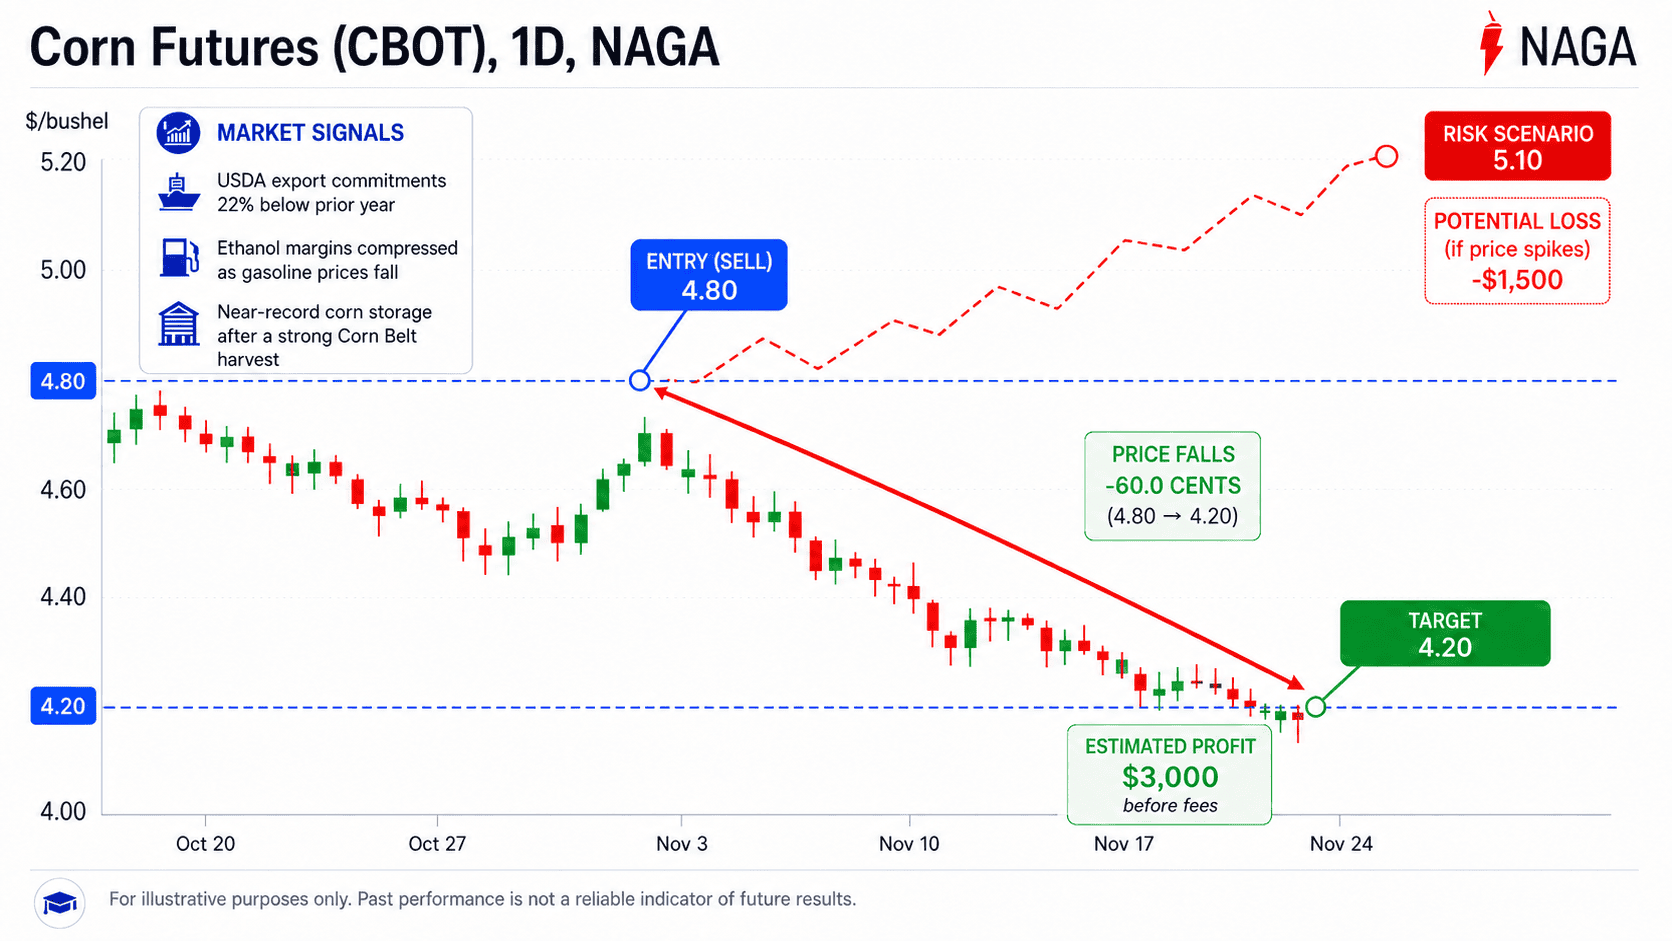
Example A: Trader Shorting Corn Futures on a Post-Harvest Supply Glut (Short Trade)
A retail trader using the NAGA trading app monitors USDA weekly export sales reports in late October and notices that U.S. corn export commitments are running 22% below the prior year's pace, while domestic ethanol margins have compressed sharply due to falling gasoline prices. Corn warehouses are reporting near-record storage levels following a strong Corn Belt harvest. The current price of CORN.f (CBOT Corn Futures) sits at $4.80/bushel ($24,000 per contract for a 5,000-bushel contract).
Past performance is not a reliable indicator of future results. All historical data, including but not limited to returns, volatility, and other performance metrics, should not be construed as a guarantee of future performance.
The Action: The trader opens a Short Position for 1 contract (5,000 bushels).
The Outcome: Three weeks later, continued weak export demand and strong harvest pressure push corn prices down to $4.20/bushel. The trader buys back the contract to close the position.
- Total contract value: $24,000
- Margin required (e.g., 10%): $2,400 deposit
Gross Profit Calculation: ($4.80 - $4.20) × 5,000 bushels = $3,000 profit (before trading fees)
The Downside Scenario: If an unexpected announcement of a large Chinese corn purchase order emerges — a common market catalyst — prices could spike back to $5.10/bushel, moving sharply against the short position.
Loss Calculation: ($5.10 - $4.80) × 5,000 = $1,500 gross loss. The floating loss would be immediately reflected in available account equity, and if margin levels drop below maintenance thresholds, a Margin Call or automatic Stop-Out may be triggered by NAGA's system to prevent the account from going into a negative balance.
Example B: Ethanol Producer Locking In Corn Input Costs (Long Hedge)
A mid-sized U.S. ethanol producer needs to purchase 500,000 bushels of corn over the next six months for their production facility. Current corn futures trade at $4.40/bushel. They fear summer drought could push prices significantly higher before they complete their purchases.
The Action: The producer executes a Long Hedge by buying 100 CBOT Corn Futures contracts (5,000 bushels each × 100 = 500,000 bushels) at $4.40/bushel.
The Outcome: A persistent Midwest drought drives spot corn prices to $5.20/bushel by harvest.
- Physical market impact: The producer must pay an extra $0.80/bushel ($400,000 total premium) to purchase physical corn from grain elevators.
- Futures market impact: Their 100 futures contracts gained $0.80/bushel — a $400,000 futures profit (gross).
- Net result: The futures gain completely offsets the physical market price increase. Their effective corn cost remains locked at approximately $4.40/bushel, protecting their ethanol production margins.
How to Start Trading Corn on NAGA
Getting started with corn trading on NAGA is straightforward. The platform gives you access to multiple corn exposure options, live market data, and tools to help you make informed decisions.
- Learn the corn market drivers – Track USDA WASDE reports, Corn Belt weather, U.S. ethanol data, and export sales weekly reports to understand what moves corn prices.
- Choose your trading instrument – Trade Corn Futures (CBOT) | CORN.f for direct exposure or explore corn ETFs and agriculture stocks for indirect exposure.
- Use NAGA's analysis tools – Live charts, technical indicators, economic calendar, and insights may help you identify optimised entry/exit points.
- Apply smart risk management – Set stop-loss and take-profit levels, size positions appropriately, and never risk more than you can afford to lose — especially around high-volatility events like WASDE report releases.
With your strategy ready, NAGA makes execution simple – whether trading manually, copying trade leaders, or using automated signals.
Conclusion
Corn investing offers exposure to one of the world's most strategically important commodity markets — one shaped by global food demand, energy policy, weather cycles, and geopolitical dynamics simultaneously. This multidimensional price driver set creates opportunities across different timeframes, whether through direct instruments like futures and CFDs or indirect exposure via ETFs and agriculture stocks.
NAGA simplifies corn market access with live pricing, multiple exposure options, and risk management tools to help traders and investors navigate this market's distinctive volatility. Understanding the key drivers — from USDA crop reports to ethanol mandates and Black Sea trade flows — and selecting the right instrument for your strategy can position you to benefit from both short-term swings and longer-term structural trends.
Start Trading Corn on NAGA Today
Sources:
- US Department of Agriculture (USDA) — World Agricultural Supply and Demand Estimates (WASDE) ↗️
- USDA Economic Research Service — Corn and Other Feed Grains Market Outlook ↗️
- CME Group — CBOT Corn Futures Specifications ↗️
- Food and Agriculture Organisation (FAO) — Food Agriculture Statistics ↗️️
- ING Think — Agricultural Commodities Outlook ↗️
- J.P. Morgan Global Research — 2026 Market Outlook ↗️
- Robobank — Agricultural Markets Research ↗️
- Goldman Sachs — Commodities Research ↗️