


Agricultural commodities — from wheat and corn to coffee and cocoa — are among the oldest and most actively traded commodities in the world. Their appeal comes from their dual nature: essential goods with steady demand, yet highly price-sensitive markets driven by weather, harvests, supply shocks and global trade.
The agricultural commodities market is forecasted to reach US$1.9 trillion by 2030, growing at a 2.2% CAGR. For traders and investors, this means access to a liquid global market with structural trends, recurring seasonal patterns and volatility events that can create opportunities across multiple timeframes.
Who Is This Guide For?
Beginners exploring agricultural commodity investing · Active traders seeking weather, harvest and supply-driven opportunities · Long-term investors seeking diversification through agri commodities, ETFs and agriculture-linked stocks.
Agricultural Commodities — Key Takeaways
- From wheat and corn to coffee, cocoa, and soybeans, agricultural commodities connect global food demand with weather-sensitive supply chains, creating predictable price drivers for traders and investors.
- Weather patterns, harvest cycles, geopolitical events, inflation, and currency movements can all influence agricultural commodity prices, making market research and risk management essential.
- You can invest in agricultural commodities directly through futures and CFDs, or indirectly through ETFs, agricultural stocks, and companies linked to farming, food production, or logistics.
- Live charts, multiple agricultural commodity markets, and trading tools can help you compare opportunities, manage exposure, and build a strategy with NAGA.
What Are Agricultural Commodities?
Key definition: Agricultural commodities are raw materials produced through farming, cultivation, or livestock production.
In financial markets, agricultural commodities are typically divided into three broad categories:
Category Examples Key Exchanges Grains & Oilseeds Wheat, Corn, Soybeans, Rice CME Group (Chicago), Euronext Soft Commodities Coffee, Cocoa, Sugar, Cotton, Orange Juice ICE Futures US, ICE Futures Europe Livestock Live Cattle, Feeder Cattle, Lean Hogs CME Group (Chicago) Table with agricultural commodities broad categories
They are distinguished from hard commodities — such as gold, oil, and copper — primarily because their supply is inherently seasonal and heavily dependent on biological and environmental conditions. Hard commodities are extracted; agricultural commodities are grown, which means weather, disease, pests, and soil health are just as important as any economic indicator.
Agricultural commodities are traded globally in standardised contracts on major exchanges, primarily the Chicago Mercantile Exchange (CME), the Intercontinental Exchange (ICE), and Euronext. Retail traders and investors can access them through futures, CFDs, ETFs, or stocks in companies along the agricultural value chain — each method carrying its own risk profile and return characteristics.
What Are the Most Traded Agricultural Commodities?
Not all agricultural commodities are created equal in terms of liquidity, accessibility, and investment appeal. Below are the most actively traded, with recent context to help you understand their current market relevance.
Grains
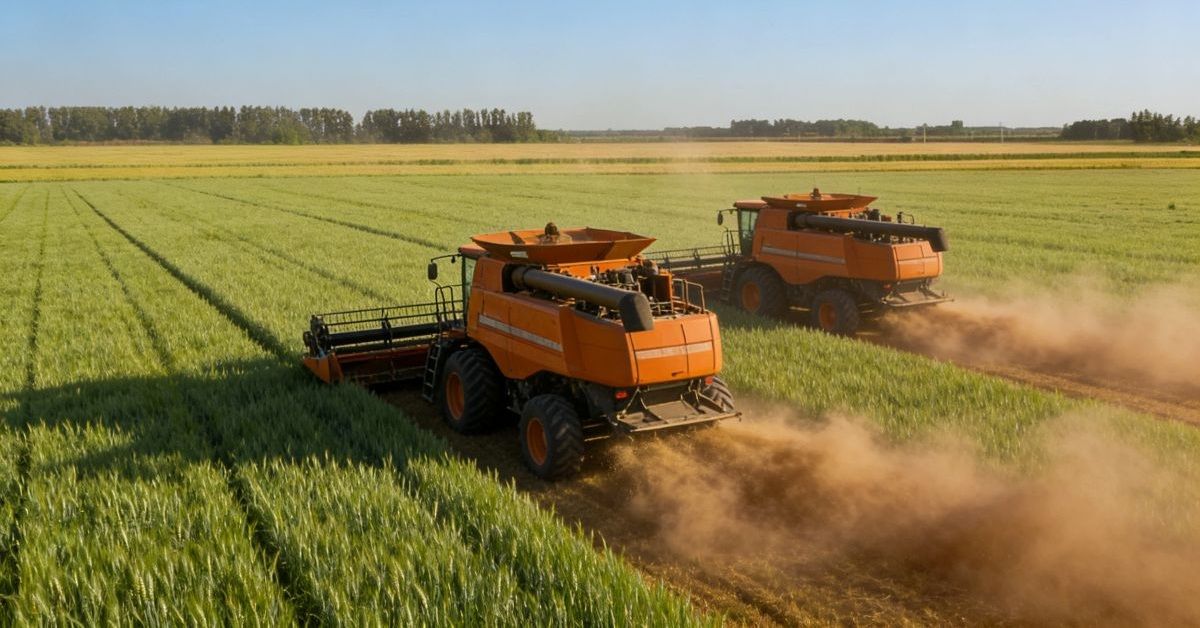
Grains are the backbone of the global food supply and among the most liquid commodity markets in the world. Because they are used in food, animal feed and biofuels, prices often react to crop reports, weather forecasts, export flows and changes in global demand. For traders, grain markets can offer seasonal opportunities around planting and harvest periods, while investors may use them to track broader food inflation and supply-chain trends.
1. Wheat
Wheat is one of the world’s most important grain commodities, used mainly for food products such as bread, pasta and flour, as well as animal feed. Major producers and exporters include the U.S., Russia, Canada, Australia, Ukraine and the EU.
- Key price drivers: Weather conditions in major growing regions, harvest yields, export flows, Black Sea supply risks, global food demand, inventory levels, currency movements and government crop reports.
- Trading Insight: Wheat prices can react sharply to droughts, floods, export restrictions or geopolitical disruptions, especially in the Black Sea region, while strong harvests and rising inventories may pressure prices lower.
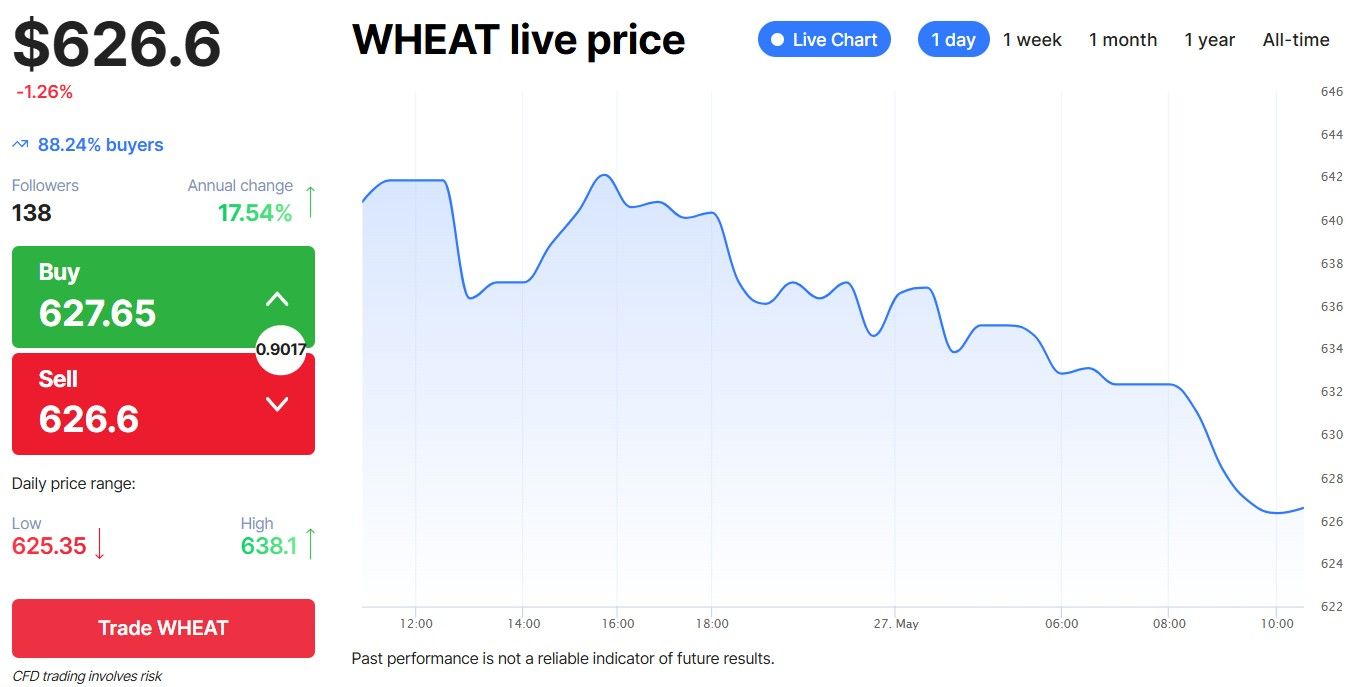
Wheat Outlook 2026: The mid-2026 USDA outlook is supportive: U.S. wheat production is projected at 1.56 billion bushels, down sharply from the prior year, while exports and ending stocks are also expected to fall. USDA projects 2026/27 U.S. wheat ending stocks down 18% year over year to 762 million bushels, with the season-average farm price rising to $6.50/bushel. The investor case is therefore shifting from post-war mean reversion to tighter supply and weather-risk exposure.
2. Corn (Maize)
Corn is one of the most actively traded grain commodities, used for food, animal feed, ethanol production and industrial products. The U.S., Brazil, Argentina, China and Ukraine are among the key producers and exporters.
- Key price drivers: Weather conditions during planting and growing seasons, U.S. crop reports, ethanol demand, livestock feed demand, export flows, inventory levels, energy prices and currency movements.
- Trading Insight: Corn prices often react to U.S. planting progress, summer weather and ethanol margins, while strong harvests or weaker feed and biofuel demand can pressure prices lower.
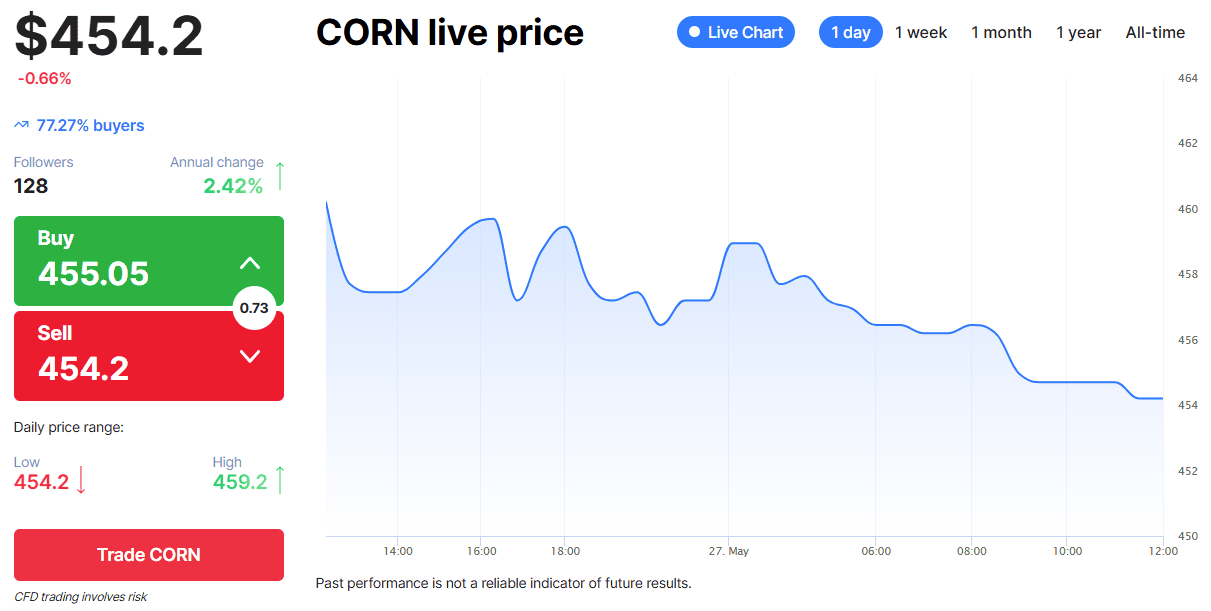
Corn Outlook 2026: USDA’s mid-2026 WASDE points to a tighter U.S. balance sheet: planted area is projected at 95.3 million acres, production at about 16.0 billion bushels, and ending stocks down 185 million bushels from the prior year. However, upside is capped by weaker demand signals, with total use down 2%, exports down 5%, and food/seed/industrial use flat. The key investor watchpoints are U.S. summer weather, yield risk, ethanol demand, and competition from Brazil and Ukraine.
3. Rice
Rice is a key global grain commodity and staple food, especially across Asia, Africa and parts of Latin America. It is traded in different varieties, with production and exports concentrated in countries such as China, India, Thailand, Vietnam and Pakistan.
- Key price drivers: Monsoon and weather conditions in Asia, Indian export restrictions, government stockpiling, global food security concerns, crop yields, currency movements and import demand from major consuming countries.
- Trading Insight: Rice prices can spike when major exporters restrict supply or when poor monsoon conditions threaten Asian harvests, while strong crops and relaxed export policies may ease price pressure.
Rice Outlook 2026: The May 2026 USDA outlook is mixed: U.S. rice production is projected down 15% year over year, with lower supplies, exports, domestic use, and ending stocks. USDA projects all-rice ending stocks down 18% to 42.3 million cwt and the 2026/27 season-average farm price up to $13.50/cwt. The bullish U.S. supply story is partly offset by larger global supplies and stronger trade, especially as India remains the dominant exporter.
With the fundamental outlook in place, here's what traders need to know about contract specifications and current price ranges before entering any grain market position.
Commodity Exchange Contract Size Mid-2026 Price Range Wheat (CBOT / Chicago SRW) CME / CBOT 5,000 bushels $6.05–$6.88/bushel Corn (CBOT) CME / CBOT 5,000 bushels $4.55–$4.88/bushel Rough Rice CME / CBOT 2,000 cwt $10.84–$13.00/cwt Table with commodity grains' exchanges, contract size, and mid-2026 price range
Oilseeds
Oilseeds link food, feed, vegetable oils, and biofuels, with prices shaped by China's demand, export competition, and energy-market spreads. Because soybeans, soybean oil, palm oil, and canola are closely linked, traders often watch relative pricing between vegetable oils, biodiesel margins and South American crop conditions. For investors, oilseeds can offer exposure to both food demand and renewable fuel trends.
1. Soybeans
Soybeans are a major oilseed commodity used in animal feed, cooking oil, biodiesel and food products. The U.S., Brazil, Argentina and China are key players in global supply and demand.
- Key price drivers: U.S. and South American weather, Chinese import demand, livestock feed demand, biodiesel demand, crop yields, export flows and inventories.
- Trading Insight: Soybean prices often move on U.S. crop updates, Brazilian weather and Chinese buying, while larger harvests or weaker feed demand can pressure prices lower.
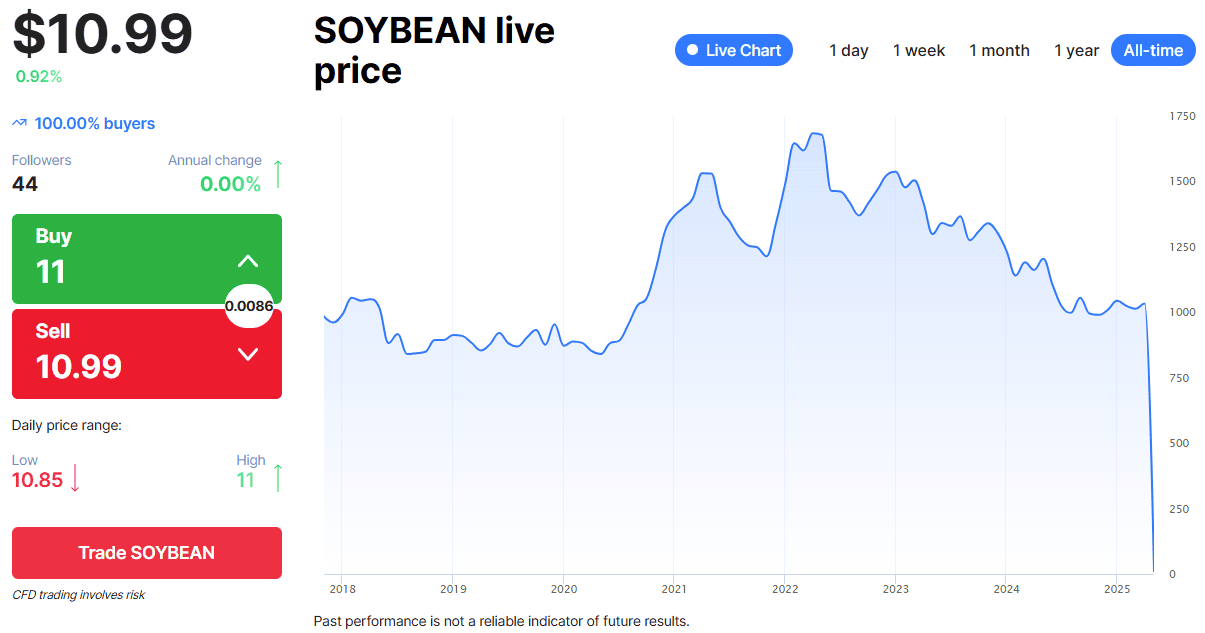
Soybeans Outlook 2026: Soybeans Outlook 2026: The May 2026 USDA WASDE points to a tighter U.S. balance sheet: planted area is projected at 95.3 million acres, production at approximately 4.46 billion bushels, and ending stocks down 185 million bushels from the prior year. However, upside is capped by weaker demand signals, with total use down 2%, exports down 5%, and crush demand relatively flat. The key investor watchpoints are U.S. summer weather and yield risk, Chinese import demand, and competition from Brazil's record production cycle.
2. Palm Oil
Palm oil is a major vegetable oil commodity used in food products, cosmetics, biofuels and industrial goods. Indonesia and Malaysia dominate global production and exports.
- Key price drivers: Southeast Asian weather, Indonesian and Malaysian export policy, biodiesel mandates, labour availability, inventory levels, soybean oil prices and crude oil prices.
- Trading Insight: Palm oil prices often move on Malaysian inventory data, Indonesian export rules and biofuel demand, while weaker vegetable oil demand or rising stocks can pressure prices lower.
Palm Oil Outlook 2026: The 2026 setup is supply-tight but policy-sensitive. Key drivers are Indonesia's export policy, Malaysia's production, biodiesel mandates, and the palm oil spread versus soybean oil and crude oil.
Soft Commodities
Commodity markets have historically moved in long supercycles — multi-decade periods of rising or falling real prices driven by structural shifts in supply and demand. Many analysts argue we entered a new agricultural supercycle post-2020, driven by climate change disrupting yields, rising global population (expected to reach 10 billion by 2050), and the surge in biofuel demand competing with food use for the same crops.
Soft commodities remain high-volatility, supply-concentrated trades. Coffee and cocoa have corrected from extreme 2024–25 highs as supply outlooks improve, while sugar and cotton are more exposed to energy prices, FX, policy decisions, and consumer demand.
1. Coffee
Coffee markets are divided into two main types: Arabica (traded on ICE, ticker KC) and Robusta (traded on Euronext/ICE Europe, ticker RC). Brazil accounts for roughly 30-40% of global coffee production.
- Key price driver: Brazilian weather, particularly frost risk in the Paraná and Minas Gerais growing regions.
- Trading insight: Coffee is one of the most volatile soft commodity markets, making it attractive for short-term traders but requiring strict risk management.
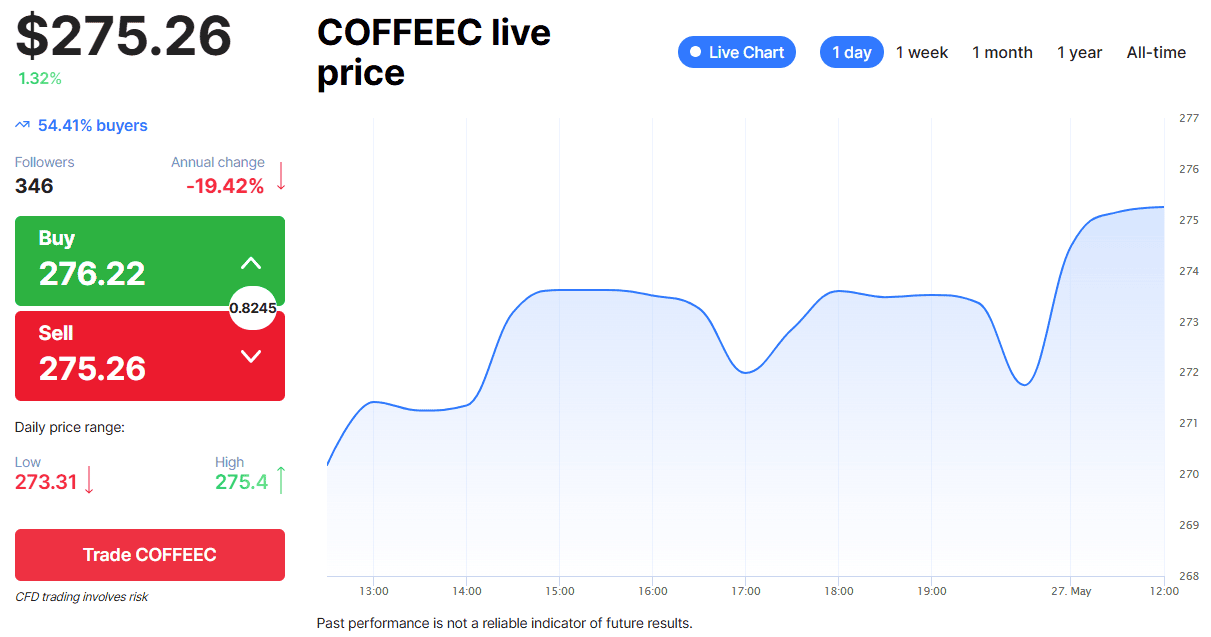
Coffee Outlook 2026: The key driver is Brazil’s 2026/27 crop: estimates point to a potentially record harvest and record exports, which is bearish for prices. The main risks are El Niño, flowering weather, low global stocks, and farmers' selling behaviour.
Learn how to invest in the Coffee market
2. Cocoa
Cocoa is highly concentrated geographically — The Ivory Coast and Ghana together produce over 60% of the world's supply.
- Key price drivers: West African weather, political stability in the Ivory Coast, mid-crop and main-crop harvest estimates.
- Trading insight: Cocoa prices can move sharply when West African crop expectations change, as tight supply from the Ivory Coast and Ghana can quickly amplify the impact of weather shocks, disease outbreaks or lower-than-expected harvest estimates.
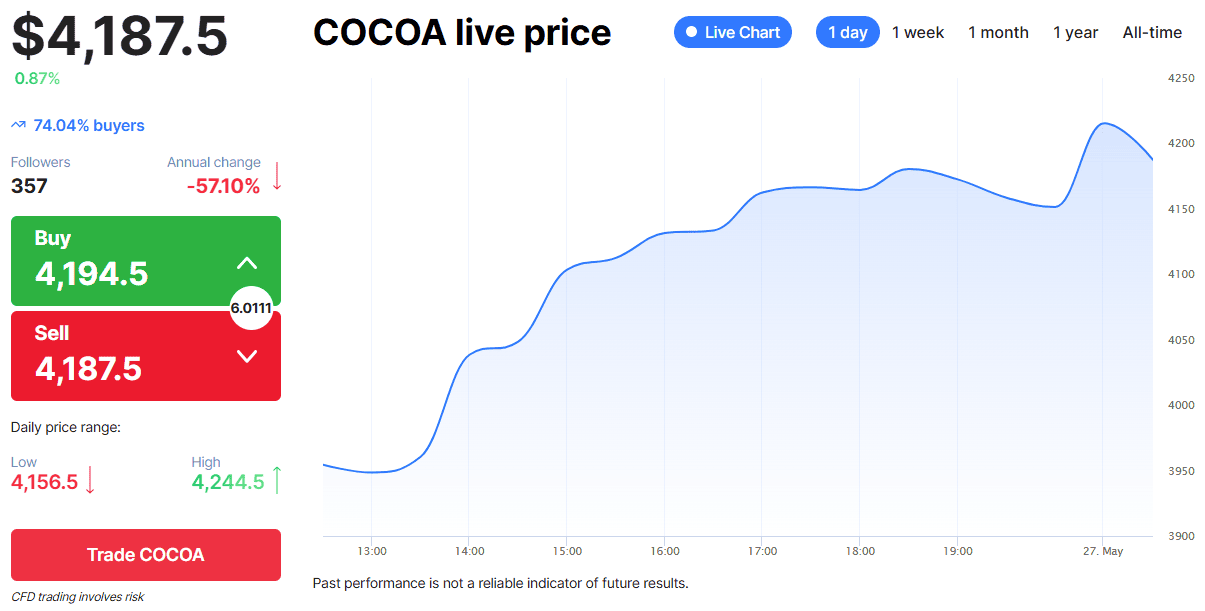
Cocoa Outlook 2026: The bullish shortage story has weakened as West African supply improves and demand remains soft. Watch Côte d’Ivoire/Ghana arrivals, chocolate demand destruction, inventories, and whether lower prices rebuild demand later in 2026.
Learn how to invest in the Cocoa market
3. Sugar
Sugar markets trade both raw sugar and white/refined sugar. Brazil is the dominant global producer and exporter.
- Key price driver: Brazilian sugarcane crushing season, Indian production policies, global energy prices (since Brazilian mills can switch between producing sugar and ethanol).
- Trading Insight: Sugar prices can move quickly when Brazil shifts more cane toward ethanol or sugar, while Indian export policy and weather in Brazil, India and Thailand remain key triggers for supply-driven volatility.
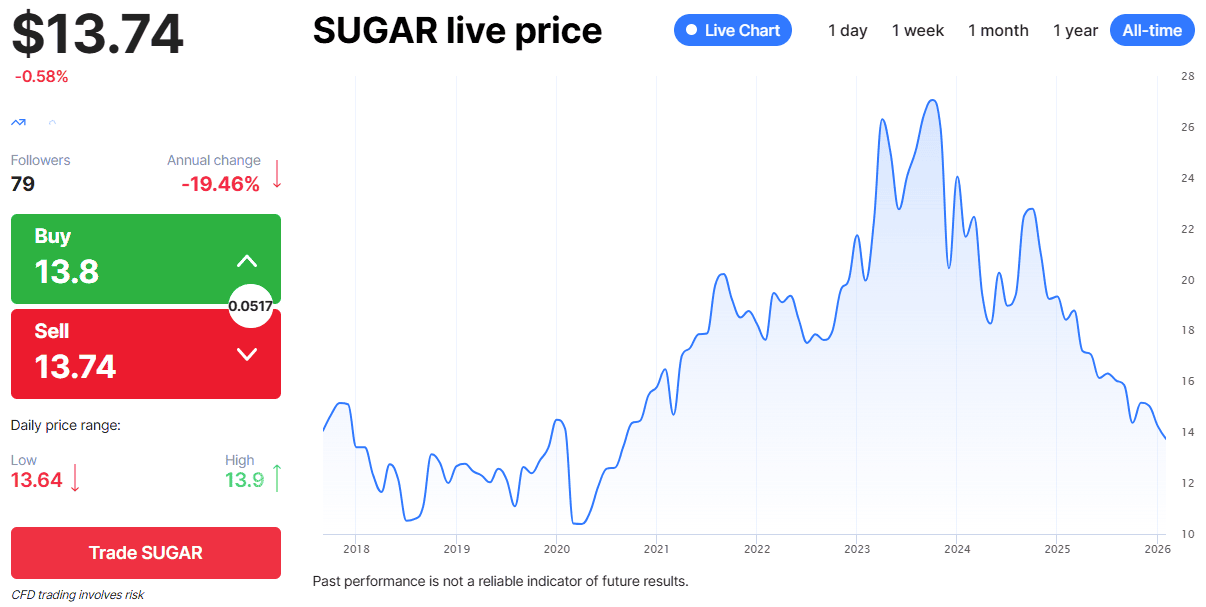
Sugar Outlook 2026: The market is capped by expectations of a record 2025/26 global crop and a larger surplus, but 2026/27 could tighten if Brazil diverts cane to ethanol or India limits exports. Key signals: oil prices, Brazil crush mix, India export quotas, ISO surplus/deficit revisions.
4. Cotton
Cotton is one of the world’s most traded soft commodities, mainly used in textiles, apparel and industrial fabrics. The U.S., China, India, Brazil and Pakistan are among the key producers and consumers.
- Key price drivers: Weather conditions in major producing regions, global textile and apparel demand, Chinese import demand, U.S. export sales, crop yields, inventory levels, and competition from synthetic fibres such as polyester.
- Trading insight: Cotton prices can react sharply to changes in global clothing demand, U.S. crop conditions and Chinese buying activity, while broader economic slowdowns may pressure prices by reducing textile and retail demand.
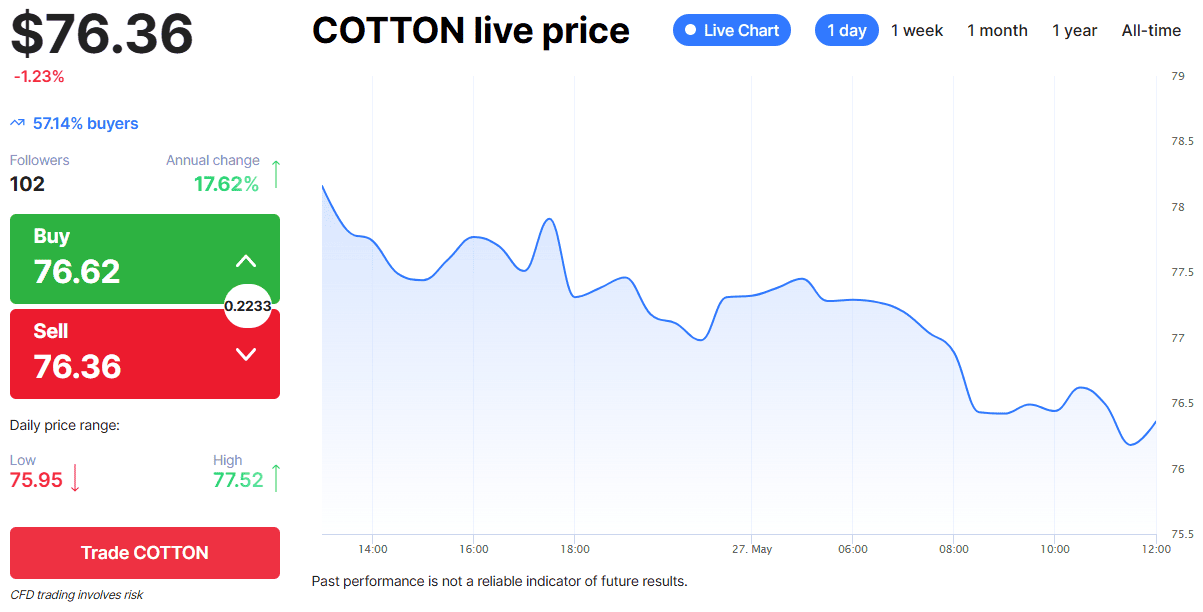
Cotton Outlook 2026: USDA’s mid-2026 outlook is mildly supportive: U.S. production is projected lower, exports higher, and ending stocks lower, with the 2026/27 farm price projected at 73 cents/lb. Key risks are consumer demand, China imports, polyester substitution, U.S. weather, and dollar strength.
Livestock
Livestock markets are mainly supply-cycle trades. Cattle remain structurally tight because herd rebuilding takes years, while hogs are more seasonal and more exposed to pork production, export demand, disease risk, and feed costs.
1. Live Cattle
Live cattle are a major livestock commodity, representing cattle ready for slaughter and beef production. The U.S. is the key futures market, while global demand is driven by beef consumption, exports and foodservice trends.
- Key price drivers: Herd sizes, feed costs, beef demand, export sales, drought conditions, slaughter rates, disease risks, consumer spending and corn prices.
- Trading Insight: Live cattle prices often move on herd supply, beef demand and feed costs, while droughts can tighten future supply, and higher corn prices may pressure producer margins.
Live Cattle Outlook 2026: USDA’s mid-2026 outlook remains bullish: beef production was lowered on slower slaughter and weaker feedlot placements, while the 2026 cattle price forecast was raised on tighter supplies. Key drivers: herd rebuilding, feedlot placements, beef demand, imports, and U.S. drought conditions.
2. Lean Hogs
Lean hogs are a major livestock commodity, representing market-ready pigs used for pork production. The U.S. is the main futures market, while global demand is influenced by pork consumption, exports and foodservice trends.
- Key price drivers: Herd sizes, feed costs, pork demand, export sales, slaughter rates, disease risks, cold storage levels, consumer spending and corn prices.
- Trading Insight: Lean hog prices often move on pork demand, herd supply and feed costs, while disease outbreaks or export changes can create sharp supply-and-demand swings.
Lean Hogs Outlook 2026: USDA’s mid-2026 view is softer for hogs: pork production is expected to rise in the second half of 2026, exports are improving, but hog prices were lowered on recent price weakness. Key drivers: pork exports, slaughter weights, feed costs, seasonality, ASF/disease risk, and China demand.
How to Trade and Invest in Agricultural Commodities
There are three primary ways retail traders and investors can access agricultural commodity markets. Each has a distinct mechanism, risk profile, and suitability depending on your goals.
Agricultural Futures and CFDs
Futures contracts are legally binding agreements to buy or sell a specific quantity of a commodity at a predetermined price on a set future date. Agricultural futures are standardised and traded on regulated exchanges like the CME and ICE. They are the original and most direct method of gaining commodity exposure.
However, futures have meaningful barriers for retail participants:
- Large contract sizes (e.g., one CBOT corn futures contract = 5,000 bushels ≈ $22,000+ notional value)
- Margin requirements and daily mark-to-market settlement
- Expiry dates requiring active contract management (rolling)
- Complexity around physical delivery rules (though most retail traders close before delivery)
Learn more about future contracts
CFDs (Contracts for Difference) solve many of these access issues. A CFD is a derivative contract between a trader and a broker (like NAGA) that tracks the price of an underlying asset — in this case, an agricultural commodity futures contract. With CFDs:
- You never own or handle the underlying commodity
- You can go long (buy) if you expect prices to rise, or short (sell) if you expect them to fall
- Leverage allows you to control larger positions with a smaller capital outlay, but it amplifies both potential profits and losses
- Position sizes are flexible — you're not locked into full futures contract sizes
- No physical delivery involved
How leverage works with NAGA: If NAGA offers 1:10 leverage on wheat CFDs, a $500 deposit can control a $5,000 position. A 5% move in wheat prices would generate a $250 gain or loss — representing a 50% return or loss on capital deployed. This illustrates both the opportunity and the risk of leverage.
Agricultural ETFs (Exchange-Traded Funds)
Commodity ETFs (Exchange-Traded Funds) and ETNs (Exchange-Traded Notes) offer a simpler, more accessible route for investors who want exposure to agricultural commodity prices without the complexity of derivatives. They trade on stock exchanges like ordinary shares and can be held in standard brokerage accounts.
There are two main types:
- Commodity ETFs/ETPs that hold futures contracts or physical commodities (e.g., the Invesco DB Agriculture Fund DBA, or the iPath Bloomberg Agriculture Subindex ETN JJA). These track the price of agricultural commodity baskets.
- Agricultural sector equity ETFs that hold shares in companies across the agricultural value chain — such as fertiliser producers, seed companies, farm equipment makers, and food processors (e.g., the VanEck Agribusiness ETF MOO).
Top Agricultural Commodities ETFs
ETF Name Ticker Exchange Type Agricultural Commodity Exposure
Invesco DB Agriculture Fund
DBA
NYSE Arca
Broad agriculture ETF / commodity poolA broad basket of agricultural futures, including grains, soft commodities and livestock.
Invesco Agriculture Commodity Strategy No K-1 ETF
PDBA
Nasdaq
Broad agriculture ETFActively managed exposure to agriculture-linked commodities, including wheat, corn, soybeans, cotton, sugar, coffee and cocoa.
Teucrium Agricultural Fund
TAGS
NYSE Arca
Broad agriculture fund-of-funds ETFDiversified exposure to corn, wheat, soybeans and sugar through Teucrium’s single-commodity ETFs.
Teucrium Wheat Fund
WEAT
NYSE Arca
Single-commodity ETFWheat futures exposure via CBOT wheat futures contracts.
Teucrium Corn Fund
CORN
NYSE Arca
Single-commodity ETFCorn futures exposure via CBOT corn futures contracts. Table with top agricultural commodities ETFs
For agricultural exposure, ETFs or ETCs may track:
- A basket of agricultural commodities
- A single commodity, such as wheat, corn, soybeans or sugar
- Agricultural futures indexes
- Agribusiness companies
- Fertiliser, farm equipment or food production stocks
Important consideration — Contango drag: Futures-based ETFs must periodically "roll" expiring contracts into the next month. When markets are in contango (future prices are higher than spot), this rolling process is costly and erodes returns over time. This is a key reason why commodity ETFs can underperform the underlying commodity price over the long run.
Agricultural Stocks
Investing in stocks of companies operating across the agricultural value chain provides indirect exposure to commodity prices — combined with company-specific fundamentals, dividends, and equity market dynamics.
Agricultural stocks examples by sector:
Sector Example company types Farm equipment Tractor and machinery manufacturers, such as Deere & Company (DE), AGCO Corporation (AGCO) or Caterpillar (CAT) Fertilizers Nitrogen, potash and phosphate producers, such as The Mosaic Company (MOS), CF Industries Holdings (CF) and K+S AG (SDFGn) Seeds and crop science Seed, pesticide and agricultural technology companies, such as Bayer AG (BAYGn), BASF AG (BASFn) and FMC Corporation (FMC) Food processing Grain processors, meat processors, sugar producers, such as General Mills (GIS), Tyson Foods (TSN) or Ingredion (INGR) Trading and logistics Commodity merchants, grain handlers, storage and transport firms, such as Archer-Daniels-Midland (ADM), C.H. Robinson Worldwide (CHRW) and Sysco (SYY) Retail and distribution Food retailers or agriculture supply companies, such as Kroger (KR), Walmart (WMT) or Costco Wholesale (COST) Table with agricultural stocks examples by sector
Top Agricultural Stocks Worth Watching
These top agricultural stocks are shares of companies connected to the agriculture value chain.
Company Ticker Sector Market Cap (as of mid-2026) What to Watch
Archer-Daniels-Midland
Grain processing, ag services & oilseeds
~$37.5BBiofuel-policy impact, crush/ethanol margins, Ag Services vs. Oilseeds volatility; ADM’s Q1 2026 AS&O profit fell 34%, while Carbohydrate Solutions rose 48%.
The Mosaic Company
Phosphate & potash fertilizers
~$6.9BSulfur/ammonia input costs, phosphate margins, potash resilience, production curtailments; Q1 EPS missed, but revenue beat on strong phosphate sales.
Deere & Company
Farm equipment & precision agriculture
~$151.8BFarm-equipment cycle, weak large-ag demand, small-ag/construction offset, precision-ag monetisation; Deere beat Q2 profit estimates but kept FY guidance unchanged.
Tyson Foods
Protein processing: beef, pork, chicken
~$23.5BBeef margin pressure vs. chicken strength; Tyson raised FY operating income guidance, but beef volumes fell, and cattle costs remain a major headwind.
Cal-Maine Foods
Egg production & specialty shell eggs
~$3.7B
Egg pricing, avian flu risk, speciality egg mix, retail contracts, Van’s Foods acquisition impact *Market cap figures are approximate as of mid-2026 and are subject to change
Learn more about stock investing
Each approach to trading and investing in agricultural commodities comes with its own risk profile, cost structure, and strategic fit. Whether you're an active trader looking for short-term price action or a long-term investor seeking inflation protection, understanding the key differences between Futures, CFDs, ETFs, and Stocks will help you choose the right instrument for your goals.
Feature Futures & CFDs ETFs Stocks Leverage Up to 1:10 (retail) None (1:1) None or margined (1:2 typical) Short Selling Easy — built in Requires inverse ETF or shorting ETF shares Requires a margin account Fees Spread + overnight swap Annual expense ratio (0.45–0.75% typical) Brokerage commission + spread Holding Period Short to medium term Medium to long term Medium to long term Risk Level Higher (leverage) Lower (no leverage) Medium (company-specific risk) Complexity Medium–High Low Medium Commodity Exposure Direct price exposure Basket of commodities or single crop Indirect via company performance Diversification Single commodity focus Built-in across multiple commodities Varies by company Suitable For Active traders seeking short-term opportunities Passive or long-term position investors Investors seeking equity + commodity exposure Table comparing the agricultural commodities trading and investing options (Futures & CFDs vs ETFs vs Stocks)
What Affects Agricultural Commodity Prices?
Agricultural commodity prices are shaped by a complex interplay of factors — many of which are unpredictable by nature. Understanding these drivers is essential for any investor or trader in this space.
Driver Type Price Impact Example
Weather & Climate
Supply
HIGH
Prolonged drought across key Brazilian coffee-growing regions in late 2024 pushed Arabica prices to record highs above $3/lb in early 2025
Geopolitical Events & Trade Policy
Mixed
HIGH
Renewed trade tensions and shifting US tariff policy in early 2025 created significant volatility across soybean and corn markets
Supply & Demand Fundamentals
Supply/Demand
HIGH
Tightening global cocoa supply, driven by consecutive poor harvests in West Africa, pushed cocoa futures to all-time highs in 2024–2025
USDA WASDE Reports
Sentiment/Supply
MEDIUM–HIGH
Early 2025 WASDE reports showing tighter-than-expected corn ending stocks triggered sharp intraday price moves across grain markets
Currency Movements (USD, BRL)
Macro
MEDIUM
USD strength in Q1 2025 weighed on agricultural export competitiveness, pressuring corn and soybean prices
Energy Prices
Supply-Cost
MEDIUM
Elevated natural gas prices in early 2025 kept fertiliser costs high, supporting grain production cost floors
Biofuel Demand
Demand
MEDIUM
Expanding US ethanol mandates in 2025 continues to divert corn supply away from food and feed markets
Seasonal Patterns
Supply
VARIABLE
Brazilian coffee harvest outlook (May–Sep 2025) is closely watched following the 2024 drought damage to the tree stock
Speculative Positioning
Sentiment
VARIABLE
Record net-long COT positioning in coffee futures in early 2025 amplified price moves beyond supply fundamentals Table with the main agricultural commodities price drivers
Advantages and Risks of Investing in Agricultural Commodities
Agricultural commodities may offer compelling opportunities for both investors and active traders — but they come with equally significant risks. Understanding both sides is essential before entering these markets.
✅ Advantages ❌ Risks Portfolio Diversification — Agri commodities have historically shown low or negative correlation with equities, acting as a natural portfolio buffer. Extreme Volatility — Cocoa gained over 300% in 12 months (2024–25); wheat lost 50%+ from its peak — moves of this magnitude can be devastating without proper risk management. Inflation Hedge — Food price inflation is a leading component of CPI; commodity exposure rises with inflation rather than being eroded by it. Leverage Amplification — CFD losses are magnified as much as gains — a 10% adverse move with 10x leverage wipes out 100% of deployed capital. Long-Term Demand Growth — Global population is projected to reach 9.7 billion by 2050, requiring significantly more food production. Contango Drag — Futures-based ETFs can consistently underperform spot prices in contango markets, eroding long-term returns. Two-Directional Trading — CFDs allow short positions, enabling traders to profit from both rising and falling prices. Weather Unpredictability — No model reliably forecasts seasonal weather; forecasts can shift dramatically within days. Multiple Entry Points — From a $50 ETF share to a leveraged CFD position, accessible across all capital levels. Policy Risk — Sudden government interventions, such as export bans, can disrupt markets overnight with little warning. Real-Asset Exposure — Unlike equities, commodities represent tangible goods with intrinsic utility and cannot go to zero. Seasonal Complexity — Missing a seasonal turn can result in holding losing positions for months, waiting for a catalyst that may not arrive on schedule. Event-Driven Opportunities — Weather events, crop reports, and geopolitical shocks create recurring high-probability trading setups. Currency Risk — Non-USD investors are exposed to USD/local currency moves that can erode commodity gains even when prices move favourably. Currency Diversification — Commodity exposure can provide implicit diversification against domestic currency weakness for non-USD investors. Liquidity Risk — Smaller commodity markets can have wide bid-ask spreads and limited liquidity, increasing overall trading costs. Table with key advantages and risks of investing in agricultural commodities
A thorough grasp of both the opportunities and inherent risks within agricultural commodities lays the groundwork for a well-informed investment strategy. The following section delves into sophisticated trading and investing approaches, supported by real-world examples to understand how seasoned investors navigate this dynamic market.
Agri Commodities Trading and Investing Strategies — With Examples
Once you’ve familiarised yourself with the different ways to trade and invest in agricultural commodities, you can choose which method best suits your trading strategy, market outlook and risk appetite. Some of the most popular are:
- Trend following: Traders ride longer-term price movements driven by changing agricultural fundamentals, weather disruptions, supply shortages or shifts in global demand.
- Spread trading: Traders look for price differences between related agricultural markets, such as different futures delivery months, similar crops, or prices across different exchanges.
- Range-bound trading: Traders capitalise on periods of quieter, more predictable price action when no major weather events, supply deficits or policy shocks are driving the market.
- Event-driven trading: Traders monitor crop reports, weather forecasts, export data and food price releases to identify potential short-term opportunities in commodities such as wheat, corn, soybeans, coffee or sugar.
- Long-term thematic investing: Use agricultural ETFs, agribusiness ETFs or stocks to gain exposure to food security, population growth, farm technology or biofuel demand.
Register for NAGA webinars to learn more about different trading strategies and read the following real-world trading examples.
Real-World Example — Long-Term Bullish Position via DBA ETF (Investor Approach)
Thesis: An investor believes that structural supply constraints, climate-driven crop stress, and persistent food inflation will continue to support elevated agricultural commodity prices through 2025–2026. The Invesco DB Agriculture Fund (DBA) is currently trading at $27.61 per share.
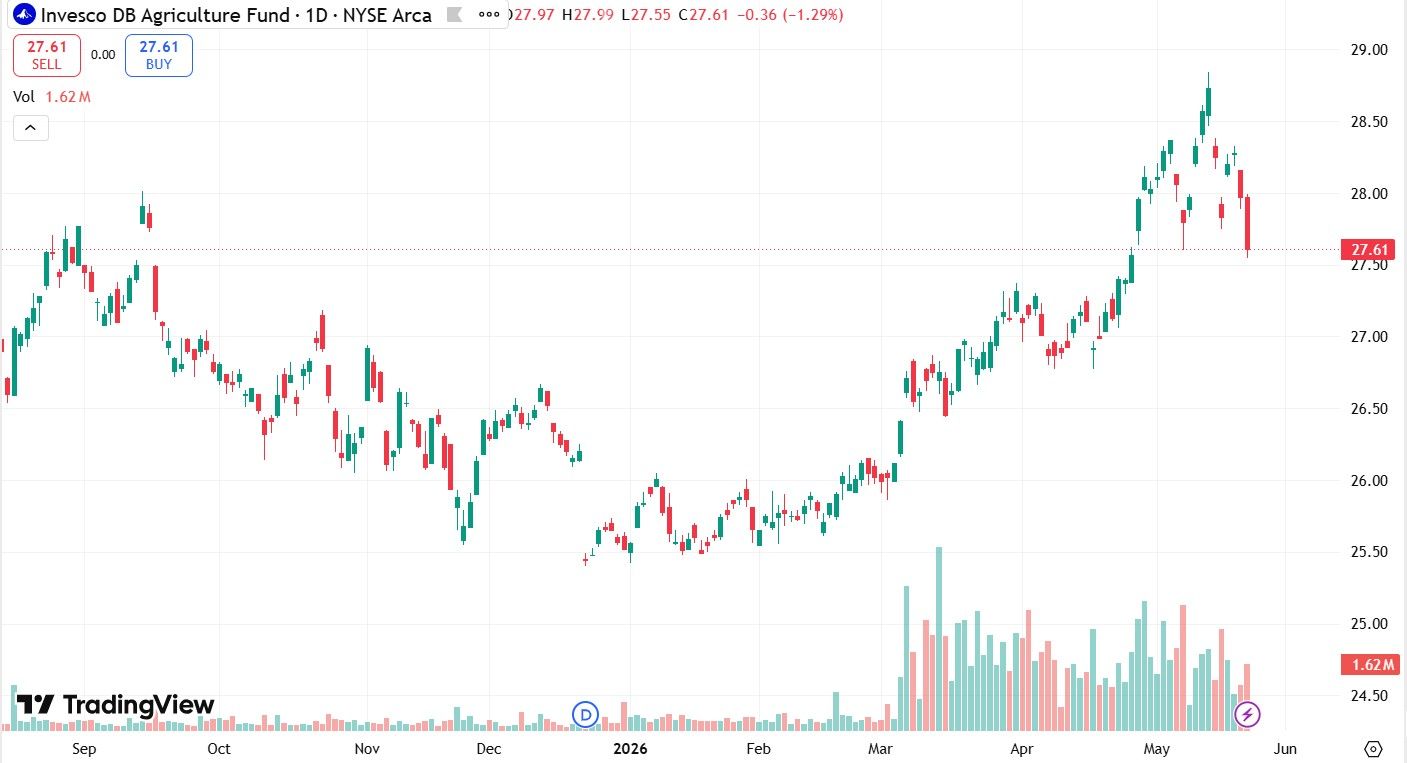
The Action: The investor decides to build a staged long position, purchasing 500 shares of DBA.
- Total position value: $13,805
- Capital deployed (no leverage): $13,805
The Outcome: Over the following 12 months, sustained food inflation and tighter global grain supplies push DBA to $33 per share. The investor sells the position.
Gross Profit Calculation: ($33 - $27.61) × 500 shares = $2,695 profit (minus trading fees)
What if the trade goes against you?
If macroeconomic conditions shift — a sharp USD rally, global recession, or bumper harvests across multiple crops — and DBA drops to $22 per share, the mechanics operate in exact reverse.
The Loss Calculation: The price decreased by $5.61 per share ($27.61 - $22). For a 500-share position, this creates a gross loss of $2,805.
💡 NAGA Tip: Consider using a staged entry strategy, such as Dollar-cost averaging (DCA), and purchase portions of your target position at different price levels to reduce timing risk on long-term ETF trades.
Real-World Example — Short-Term Bearish Trade on Coffee via CFDs (Trader Approach)
Thesis: A trader using the NAGA app notices that coffee inventory levels are rising across major warehouses, signalling a potential oversupply. After a significant rally driven by supply disruption fears from Brazil and Vietnam — the world's two largest coffee producers — the trader anticipates a mean-reversion sell-off as harvest data begins to normalise. The current price of COFFEE.f sits at $271 per pound.
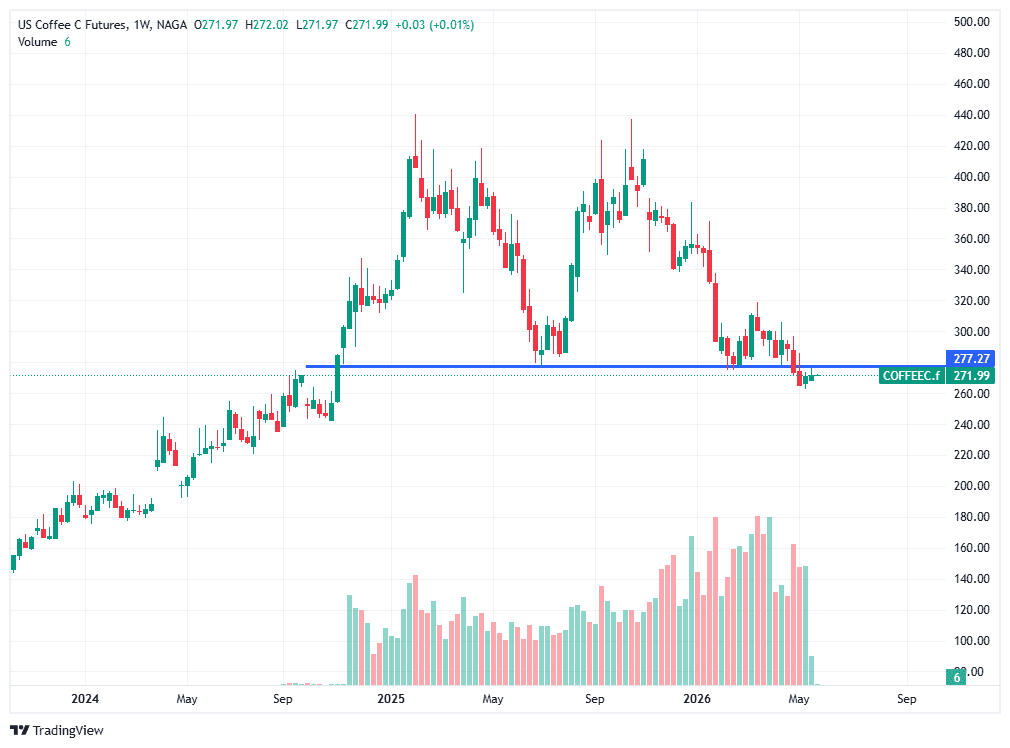
Past performance is not a reliable indicator of future results. All historical data, including but not limited to returns, volatility, and other performance metrics, should not be construed as a guarantee of future performance.
The Action: The trader opens a short position for 1 contract (37,500 pounds) on NAGA.
- Total contract value: $10,162
- Margin required (e.g., 10%): $1,016 deposit
The Outcome: Two weeks later, following improved harvest forecasts from Brazil and easing supply concerns, the market drops to $250 per pound. The trader buys back the contract to close the position.
Gross Profit Calculation: ($271 - $250) × 37,500 pounds = $787.5 profit (minus trading fees)
What if the trade goes against you?
If the market moves against the short position and jumps to $290 per pound, the mechanics operate in exact reverse.
The Loss Calculation: The price increased by $19 per pound ($290 - $271). For a 1-contract position (37,500 pounds), this creates a gross loss of $712.5.
The Margin Account Impact: NAGA's clearing system evaluates positions continuously in real-time. This floating loss is immediately subtracted from your available account equity. If your margin level begins to drop, the platform will issue an automatic Margin Call or Stop-Out, closing your trade to prevent your account from going into a negative balance.
💡 NAGA Tip: Use NAGA’s built-in Stop Loss tools when trading volatile soft commodities such as coffee. Setting a stop-loss when opening a position can help define your maximum acceptable risk in advance and support better money management, without requiring you to monitor the market constantly.
Now that you have seen some real-world examples of how you can approach the agricultural commodities market, here's how to start trading agricultural commodities directly on NAGA.
How to Trade and Invest in Agricultural Commodities with NAGA
Getting started with agricultural commodity trading on NAGA is straightforward. Follow these steps:
Step 1. Create your account — Visit NAGA.com, complete the registration form, and verify your identity with a government-issued ID and proof of address.
Step 2. Choose your account type — Open a risk-free Demo account with virtual funds or go straight to a Live account.
Step 3. Fund your account — Deposit via bank transfer, Visa/Mastercard, Skrill, or Neteller.
Step 4. Find your market — Navigate to Markets → Commodities → Agriculture for CFDs, or search by ETF/stock ticker directly.
Step 5. Analyse before you trade — Use NAGA's integrated charting tools and Economic Calendar to track USDA reports and crop seasons.
Step 6. Place your trade — Select your instrument, set your position size, and always define your stop-loss and take-profit levels before confirming.
Step 7. Monitor and manage — Track your positions via the NAGA mobile app and adjust stop-losses as the trade develops.
Step 8. Explore CopyTrading — Follow and automatically copy experienced commodity traders directly within the NAGA platform.
Conclusion
Agricultural commodities may offer a genuine opportunity across all investor types — whether you're seeking long-term inflation protection through ETFs, equity exposure via stocks like ADM or DE, or actively trading price swings in cocoa, coffee, and wheat CFDs on futures. They are essential, volatile, and increasingly shaped by climate and geopolitical forces that create recurring opportunities for those who know where to look.
The key to success is not predicting the weather — it's understanding the underlying dynamics well enough to manage risk intelligently, size positions appropriately, and stay ahead of the data releases and seasonal patterns that move these markets.
NAGA brings together the instruments, tools, and community features to help you do exactly that.
Start Trading Agricultural Commodities on NAGA
Sources:
- World Bank — Commodity Markets ↗️
- United States Department of Agriculture — USDA ↗️
- CME Group — Futures & Options Trading for Risk Management - CME Group ↗️
- Food and Agriculture Organisation of the United Nations — Home | Food and Agriculture Organisation of the United Nations ↗️
- Commodity Futures Trading Commission — Commodity Futures Trading Commission | CFTC ↗️
- National Oceanic and Atmospheric Administration — National Oceanic and Atmospheric Administration Home ↗️