


Brent crude prices surged to $138/bbl on April 7 — their highest level since the 2022 energy crisis — before partially retracing and averaging around $106/bbl in May–June, while West Texas Intermediate (WTI) crude oil futures peaked at $119.48 per barrel on March 9. The Strait of Hormuz, through which nearly 20% of global oil supply flows, has been effectively closed to shipping traffic since late February, triggering simultaneous production shut-ins of over 10 million barrels per day across six Gulf producers. The scale of this supply shock has forced every major Oil forecasting agency to dramatically revise its 2026 outlooks upward.
Despite the near-term spike, most forecasters expect crude oil prices to decline meaningfully through H2 2026 as Strait transit gradually resumes and shut-in Gulf production slowly returns. The trajectory, however, is exceptionally uncertain: a one-month delay in reopening the Strait would push prices $20+/bbl above the base case, while a rapid ceasefire could see structural oversupply reassert itself and prices fall back toward pre-conflict levels by 2027.
Oil Forecast & Price Predictions – Summary
- Oil price prediction H2 2026: Prices are expected to decline from current elevated levels as the Strait of Hormuz gradually reopens, though the pace and depth of that decline depend almost entirely on the conflict's duration.
- BASE CASE ~55%: Brent $89–106 · WTI $74–91 – The Strait reopens in June, easing Brent from ~$106/bbl to $89/bbl by Q4 and WTI to ~$74–77/bbl, with full-year 2026 averages near $95 and $84/bbl. A 2.6 mb/d inventory draw keeps a floor under prices as full production recovery stretches into early 2027.
- BULL/DELAY CASE ~25%: Brent $120–144+ · WTI $100–122 – A one-month delay in reopening — or a ceasefire collapse — would push prices $20+/bbl above base, driving Brent back toward $138/bbl and WTI toward $119/bbl or beyond. The IEA warns that a protracted disruption could double the stock deficit to ~2 billion barrels by year-end.
- BEAR/RAPID DEAL CASE ~20%: Brent $65–80 · WTI $58–68 – A rapid ceasefire restoring Strait traffic lets the pre-conflict oversupply of nearly 4 mb/d reassert itself, pulling Brent to $65–80/bbl and WTI toward J.P. Morgan's $58/bbl structural target. Stock rebuilding then becomes a price drag, not a floor.
- Oil price prediction 2027: The EIA projects Brent averaging $79/bbl in 2027 and WTI around $68–70/bbl, as most shut-in Gulf production is restored by early 2027 and inventories begin rebuilding — though the 900 mb cumulative stock deficit and reduced OPEC spare capacity (2.5 mb/d after the UAE's exit) will keep markets structurally tighter than before the conflict. Goldman Sachs targets Brent below $76/bbl; J.P. Morgan warns of a reset toward the $30s if OPEC+ fails to manage the returning oversupply.
- Oil price prediction for 2027, the next 5 years and beyond: Most mainstream forecasts converge on a $60–75/bbl Brent range by 2028–2030 (WTI $5–10/bbl below), as energy transition pressures and flattening production costs cap the upside while OPEC's demand projections of 106.5 mb/d by 2030 and the multi-year stock rebuilding requirement provide a structural floor. The key long-term risk is the pace of EV adoption in Asia — fast enough to accelerate the demand peak toward $50/bbl scenarios, slow enough to keep oil above $70/bbl through the decade.
With NAGA.com, you can trade US Oil Spot and UK Oil Spot futures through CFDs if you want to speculate on price movements and trade or invest in Oil stocks and Oil ETFs.
Crude Oil Forecast 2026 – Fundamental Analysis
Oil dominates the energy markets in mid-2026, impacted more directly by the Strait of Hormuz closure than any other asset class. Those forecasting rising crude oil prices face a narrowing window against the structural forces pulling in the opposite direction.
Strait of Hormuz Risk — Scale of the Disruption
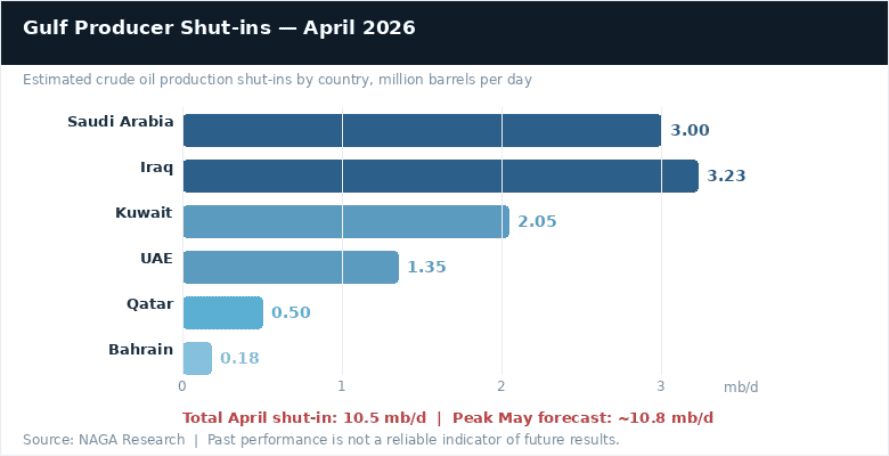
The primary driver of oil prices remains the effective closure of the Strait of Hormuz, which handled nearly 20% of global oil supply before the conflict. Six major producers — Iraq, Saudi Arabia, Kuwait, UAE, Qatar, and Bahrain — collectively shut in 10.5 mb/d in April 2026, with the figure expected to peak near 10.8 mb/d in May as onshore storage reaches capacity limits. Total supply losses since February have already exceeded 1 billion barrels in cumulative terms. Saudi Arabia and the UAE have successfully redirected some exports to terminals outside the Strait, and Atlantic Basin crude exports have increased by 3.5 mb/d since February — with notable gains from the US, Brazil, Canada, Kazakhstan, and Venezuela — but these cannot fully replace Gulf losses.
Past performance is not a reliable indicator of future results. All historical data, including but not limited to returns, volatility, and other performance metrics, should not be construed as a guarantee of future performance.
The base case from both the EIA and IEA assumes Strait traffic begins to resume in late May/early June 2026. Even then, most pre-conflict production and trade patterns are not expected to be restored until late 2026 or early 2027, and some Gulf producers may not return to pre-conflict output levels within the forecast period at all. The EIA modelled the impact of a one-month delay in reopening (to late June): it would push crude prices more than $20/bbl above the base case near term, with effects persisting well into 2027.
Inventory Draws — Record Pace, Prolonged Recovery
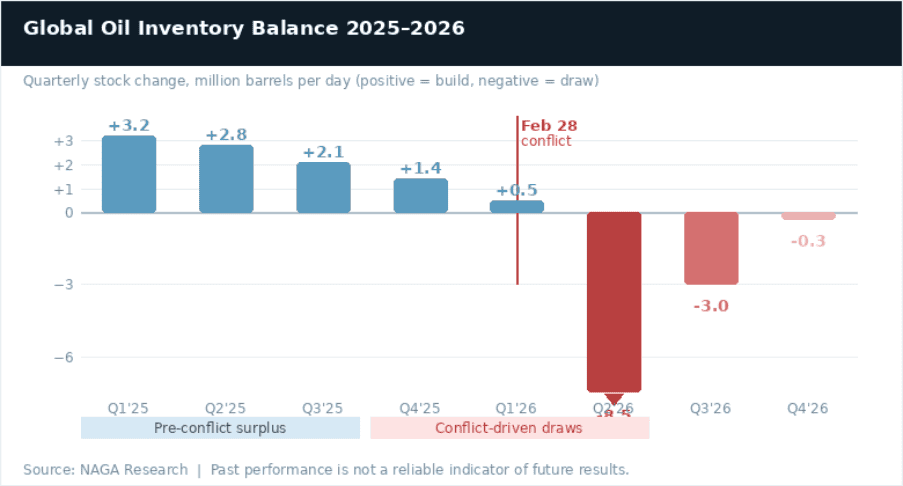
Global oil inventories are drawing at an unprecedented rate. The EIA estimates a global inventory draw of 8.5 mb/d in Q2 2026, the largest quarterly draw on record, keeping Brent prices elevated around $106/bbl in May and June even as ceasefire talks continue. For the full year 2026, the EIA forecasts a net global inventory decrease of 2.6 mb/d — a sharp reversal from the 3+ mb/d surplus that was projected before the conflict.
Past performance is not a reliable indicator of future results. All historical data, including but not limited to returns, volatility, and other performance metrics, should not be construed as a guarantee of future performance.
The cumulative stock deficit is expected to reach around 900 mb by September 2026, even after accounting for the IEA's 400 mb coordinated strategic reserve release. Rebuilding those depleted stocks — strategic reserves included — will require roughly 1 mb/d of extra supply above underlying demand growth for approximately three years. This structural overhang keeps markets meaningfully tighter than they would have been without the conflict, well into 2027 and beyond.
Global Oil Production Forecast
Outside of the Middle East, producers have responded aggressively. The IEA revised up 2026 supply growth expectations from the Americas by more than 600 kb/d since the start of the year, to 1.5 mb/d on average. The US, Brazil, Canada, Kazakhstan, and Venezuela are all contributing to the surge in Atlantic Basin exports now flowing to hard-hit East of Suez markets. Russia's crude oil exports have also risen as repeated attacks on its refineries have cut domestic use and redirected barrels to export.
Past performance is not a reliable indicator of future results. All historical data, including but not limited to returns, volatility, and other performance metrics, should not be construed as a guarantee of future performance.
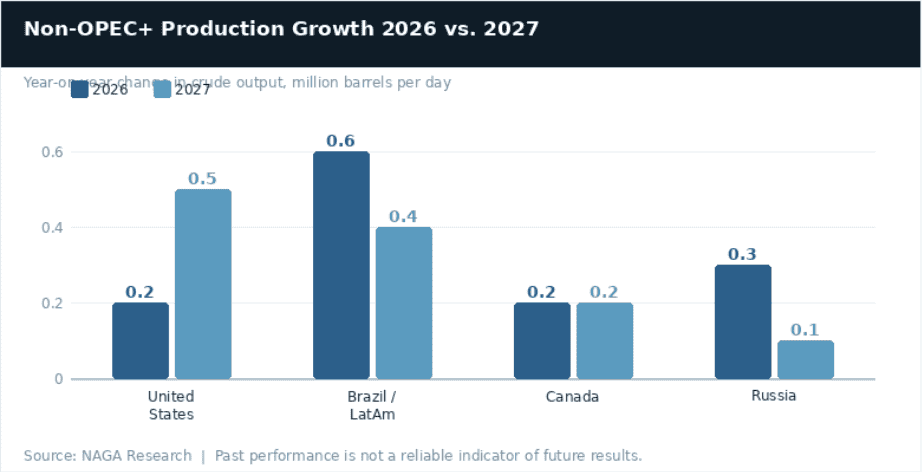
The EIA forecasts US crude oil production to average 13.6 mb/d in 2026, rising to 14.1 mb/d in 2027 as higher crude prices support continued drilling in the Permian Basin. Brazil, Guyana, and Argentina lead non-OPEC+ growth, accounting for a 0.6 mb/d rise in 2026. In 2027, South American output growth accounts for roughly two-thirds of the global non-OPEC+ increase. A notable structural development: the UAE announced its departure from OPEC effective May 1, 2026. Because the UAE held significant spare crude production capacity, this reduces OPEC's spare capacity from a prior forecast of 3.8 mb/d to just 2.5 mb/d in 2027, meaningfully limiting the cartel's ability to act as a market stabiliser in any future supply shock.
Global Oil Consumption Forecast
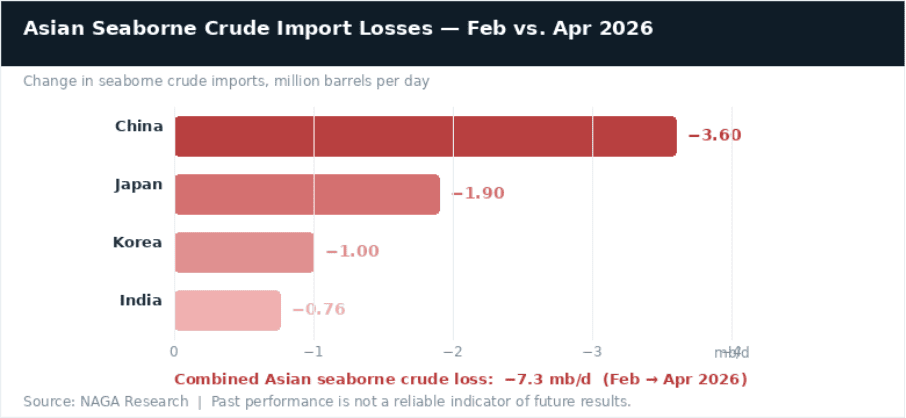
High prices and supply disruptions are driving significant demand destruction. World oil demand is now expected to contract by 420 kb/d year-on-year in 2026, to 104 mb/d — a swing of 1.3 mb/d versus the pre-war forecast of +1.1 mb/d growth. The steepest decline is in Q2 2026, down 2.45 mb/d year-on-year, with losses split roughly 930 kb/d in OECD countries and 1.5 mb/d in non-OECD. The impact is heaviest in Asia, which is most reliant on Middle East crude: Chinese seaborne crude imports fell by 3.6 mb/d from February to April, with additional large reductions in Japan, Korea, and India. The petrochemical and aviation sectors are currently the most severely affected — jet fuel prices nearly tripled after Middle Eastern product exports were cut off.
Past performance is not a reliable indicator of future results. All historical data, including but not limited to returns, volatility, and other performance metrics, should not be construed as a guarantee of future performance.
The EIA's May STEO revised global oil demand growth down to just 0.2 mb/d for full-year 2026, from 0.6 mb/d in April and 1.2 mb/d in the February pre-conflict outlook. Demand is expected to rebound by 1.5 mb/d in 2027 (to 105.6 mb/d) once supply flows return. Refinery crude throughputs are forecast to plunge by 4.5 mb/d in Q2 2026 globally, with operators contending with reduced feedstock availability and lower runs.
How to Trade and Invest in Oil
Oil Prices Forecast 2026 – Technical Analysis
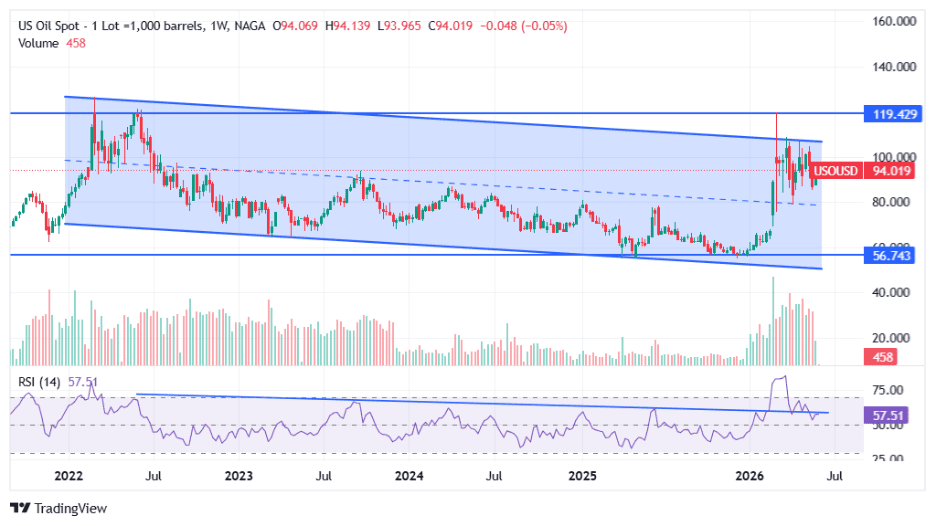
From a technical perspective, both Brent and WTI had been locked in a consistent descending channel since late 2023, confirming a structurally bearish multi-year trend. Each rebound had failed at lower highs. The Middle East conflict shattered that structure to the upside, driving prices far above prior resistance levels. The panic rally proved extreme, and a partial retracement has already occurred from the peaks. The key question technically is whether oil prices settle into a new, higher post-conflict range or revert toward the pre-conflict bearish channel once supply normalises.
WTI Crude Oil Outlook H2 2026
WTI Crude Oil prices are now consolidating above the pre-conflict range, supported by the 8.5 mb/d Q2 inventory draw. The EIA's base case (Brent at $89/bbl in Q4 and $79/bbl in 2027) implies WTI declining to approximately $75–82/bbl by Q4 and $65–70/bbl through 2027 — broadly aligning with the middle of the pre-conflict descending channel, but at levels higher than the pre-war $60–65 range as the structural stock deficit provides a floor.
Past performance is not a reliable indicator of future results. All historical data, including but not limited to returns, volatility, and other performance metrics, should not be construed as a guarantee of future performance.
Resistance levels
LEVEL (WTI) SIGNIFICANCE $120 April panic-rally and 2022 highs — major seller zone on any further spike $100 Upper band of the long-term descending channel; key psychological resistance
Support levels
LEVEL (WTI) SIGNIFICANCE ~$95–100 ⬤ Current zone — post-spike consolidation, sustained by record inventory draws $75–77 Mid-channel support; Q4 2026 EIA target zone (Brent $89 implies ~WTI $77) $55–50 Lower channel boundary; J.P. Morgan's ultimate structural bear target on full de-escalation
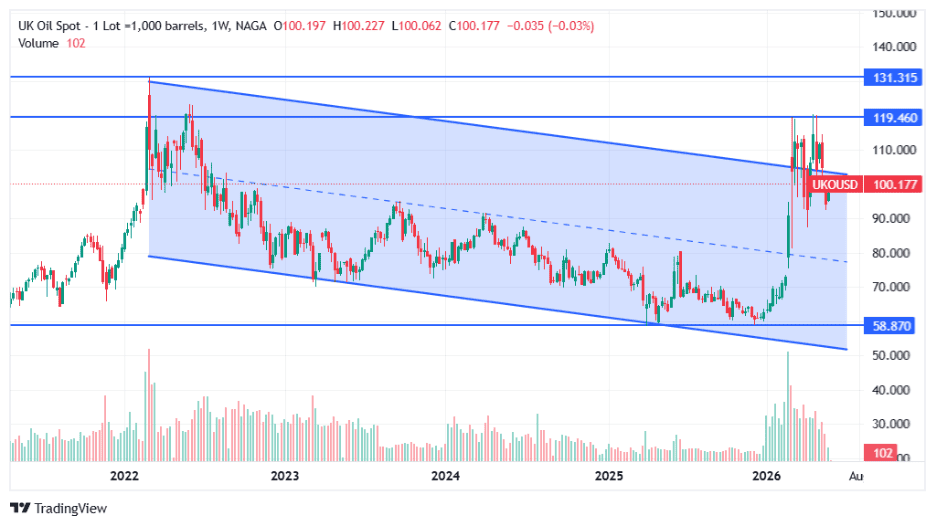
Brent Oil Outlook 2026
Brent broke sharply above the mid-range of its parallel channel (began in December 2023) during the conflict spike, reaching territory last seen during the 2022 Ukraine crisis. Despite the two-year bearish structural bias remaining intact in the background, the short-term picture is neutral-to-bearish hold at historically elevated levels. Current EIA projections see Brent consolidating around $106/bbl through May–June, before trending toward $89/bbl in Q4 and $79/bbl across 2027 as shut-in production gradually recovers.
Past performance is not a reliable indicator of future results. All historical data, including but not limited to returns, volatility, and other performance metrics, should not be construed as a guarantee of future performance.
Resistance levels
LEVEL (BRENT) SIGNIFICANCE $138 April 7, 2026 intra-day high — extreme bull case referenc $120 Panic-rally zone; strong seller area on any renewed spike $108 Upper band of the long-term descending channel
Support levels
LEVEL (BRENT) SIGNIFICANCE ~$106 ⬤ Current zone (May–Jun avg per EIA) — 8.5 mb/d Q2 inventory draw sustains price $89 EIA Q4 2026 base-case target as Hormuz flows resume $79 EIA 2027 average — most shut-ins restored, inventories rebuilding $60 Pre-conflict structural support; ultimate long-term bear target on full oversupply return
To learn more about technical analysis as a forecasting tool, visit NAGA Academy.
Oil Brands
When talking about the commodity oil traded on financial markets, we can distinguish two types. The most popular and among the most traded is US Oil, also known as WTI (about $91/bbl in March 2026). The other popular variant is UK Oil, also known as Brent (a North Sea benchmark, about $98/bbl).
How to Trade and Invest in Oil
West Texas Intermediate (WTI)
Light sweet crude oil (WTI) is widely used in US refineries and is an important benchmark for oil prices, with recent trading around $91 per barrel (March 2026). WTI is a light oil with a high API gravity and low sulfur content. This expresses the density of the oil in relation to water. WTI oil is widely traded between oil companies and investors. Most trading is done through futures via CME Group (NYMEX). The Light Sweet Crude Oil (CL) future is one of the most traded futures worldwide and is physically delivered at Cushing, Oklahoma.
Much of the commercial storage and the delivery point for this grade is in Cushing, an important hub for Oklahoma's oil industry. Here is large storage tanks connected to pipelines that transport the oil to all regions of the United States. WTI is an important feedstock for refineries in the Midwestern United States and on the coast of the Gulf of Mexico.
Brent Crude Oil
Brent oil is an important benchmark for the petroleum rate, especially in Europe, Africa, and the Middle East. Its name is derived from the Brent oil field in the North Sea. This Royal Dutch Shell (now Shell plc) oil field was once one of Britain's most productive oil fields, and most of the platforms there have since been decommissioned.
The correlation between these two futures' price development is high, and we have seen several times in recent years that Brent's price was more than $10 higher than the comparable WTI contract during periods of market stress, while in 2025, the difference has generally been more moderate. At the end of 2020, the difference was approximately $3,00, and as of March 2025 it typically ranges around $5,00–$8,00, with Brent near $98 per barrel. Such differences are caused, among other things, by supply and demand, including the costs of shipping or storing oil.
Oil Price Prediction for 2026 and beyond (2030)
Oil price forecasts from major institutions reflect a dramatically changed near-term picture since the Strait of Hormuz closure, alongside an unchanged long-term structural debate between energy transition and demand resilience.
Institution Key forecast Updated EIA 2026 Brent average $95/bbl, $79/bbl in 2027 May 12, 2026 J.P. Morgan Brent $96/bbl 2026, $75 in 2027; WTI $89/$70 May 12, 2026 Morgan Stanley Brent $110 Q2, $100 Q3, $80 in 2027; WTI mid-cycle $70 March–April 2026 UBS Brent $100 end-Jun, $95 end-Sep, $90 end-Dec, $85 Q1 2027; $150+ tail risk May 23, 2026 Citigroup Brent $110 Q2, $95 Q3, $80 Q4; $130 bull scenario; $150 tail risk April 26, 2026 HSBC Brent $95/bbl full-year 2026, WTI $90 May 2026 ANZ Brent $92 Q2, $76 Q3, $88 full-year 2026 April 9, 2026 Macquarie Brent $89 Q2, $74.50 Q3; $200 extreme tail risk March 27, 2026 Goldman Sachs Brent averaged $67 in Q4 and $79 in 2026 March 2026 *Oil price forecasts are subject to change and reflect each institution's most recently published figures. Past performance is not a reliable indicator of future results.
EIA’s Forecast 2026: Decline to continue
The US Energy Information Administration's May 2026 Short-Term Energy Outlook (May 12) — the most authoritative near-term forecast available — projects Brent averaging ~$106/bbl in May–June, supported by a record 8.5 mb/d global inventory draw in Q2, before falling to $89/bbl by Q4 2026 and $79/bbl across 2027 as Strait flows gradually resume and shut-in Gulf production slowly returns. The full-year 2026 average is $95/bbl Brent ($84/bbl WTI).
Goldman Sachs' Oil Forecast 2026-2028 (updated March 2026)
Goldman Sachs raised its Brent, WTI crude oil price forecasts for the fourth quarter of 2026 to $71/67 per barrel from $66/62 as it sees longer disruption to oil flows in the Strait of Hormuz due to the U.S.-Israeli war on Iran.
Goldman analysts said they now assume 21 days of low Strait of Hormuz (SoH) oil flows at 10% of normal levels, followed by a 30-day gradual recovery, compared with their earlier expectation of a 10-day disruption.
The bank also said that daily oil prices are likely to exceed their 2008 peak if SoH flows remain depressed through March.
Fitch Ratings' neutral oil price forecast (updated March 2026)
Fitch Ratings raised its 2026 annual average oil price forecast to $70 a barrel from $63 (Brent). This assumes that the Strait of Hormuz remains effectively closed for about a month, after which oil prices fall to the mid-$60s by 2H26. This revision has not had a major impact on their base-case economic forecasts.
But an adverse scenario – in which oil prices rise to $100/barrel and remain there – would be a significant global supply shock, reducing world GDP by 0.4% after four quarters and adding 1.2pp-1.5pp to inflation in Europe and the US.
J.P. Morgan’s bearish oil price forecast for 2026
J.P. Morgan published its first major upward revision in two months in the week of May 12, 2026, projecting Brent averaging $96/bbl for the full year 2026 and $75/bbl in 2027, with WTI at $89/bbl in 2026 and $70/bbl in 2027. Head of global commodities strategy Natasha Kaneva and colleagues revised the prior $60/bbl Brent baseline substantially higher, reflecting the structural impact of Hormuz-related supply losses on the global oil balance. The bank also flagged that if disruptions persist past mid-May, Brent could initially climb to $120–130, with $150 not out of the question in a prolonged outage scenario.
Morgan Stanley Forecast 2026–2027 (updated April 2026)
Morgan Stanley raised its 2026 Brent price deck by 44% on March 25, and has since left its quarterly targets unchanged: $110/bbl for Q2 2026 and $100/bbl for Q3 2026, before easing to around $80/bbl in 2027. The bank expects oil supply chains to take months to normalise even after a Hormuz reopening is achieved, keeping the near-term price premium intact well into Q3. Its WTI mid-cycle price assumption was raised to $70/bbl (from $65/bbl), with the bank assuming Hormuz exports recover approximately 70% of the decline during May–July and return to stable levels only by October 2026.
HSBC Forecast 2026 (updated May 2026)
HSBC raised its 2026 average Brent oil price forecast to $95/bbl in its May 2026 revision — broadly in line with the EIA's figure of $96/bbl — with both institutions citing sustained supply disruption as the dominant driver. This follows an earlier March revision to $80/bbl (from $65/bbl pre-conflict), when Brent and WTI had both briefly topped $119/bbl. HSBC's WTI forecast was raised to $90/bbl for 2026 and $83/bbl for 2027.
ANZ & Macquarie Forecasts (updated April 2026)
ANZ Research projects Brent averaging $92/bbl in Q2 and $76/bbl in Q3 2026, with full-year 2026 and 2027 estimates of $88/bbl and $76/bbl, respectively (April 9, 2026). Macquarie forecasts Brent at $89.28/bbl in Q2 and $74.50/bbl in Q3, with a full-year 2026 average of $82.93/bbl declining to $70/bbl in 2027. Macquarie also issued a tail-risk note: if the conflict continues through the end of June, oil prices may rise to $200/bbl — the most extreme institutional estimate in the current cycle.
Algorithm-based (AI) Oil Price Forecasts
Algorithmic and AI-based models have produced a wide range of estimates in the current volatile environment. Long Forecast projects Brent $88.82/bbl in June and $86.55/bbl in July 2026, with a full-year trajectory that remains well above pre-conflict consensus. CoinCodex projects a June high of $146.20/bbl with a low of $106.14 by August. WalletInvestor expects a narrower range, with WTI holding around $102 at mid-year and rising to $103.45 by December. These models capture geopolitical premium dynamics but tend to diverge significantly from institutional consensus in their precise H2 trajectories.
McKinsey's 2040 equilibrium model maintains its long-term oil price forecast in the $50–60/bbl range, driven by flattened production cost curves and ongoing pressures from the energy transition. OPEC upholds bullish demand projections, now forecasting global oil demand growth of 1.4 million b/d in 2026 alongside total demand reaching about 106.5 million b/d, fuelled by emerging market expansion in regions like China, India, and Latin America.
Structural shifts emerge in price drivers:
- The US–Israel–Iran conflict and Strait of Hormuz closure, erupting February 28, 2026, has shut in more than 10 mb/d of Gulf production and is the dominant near-term price driver — overriding all prior demand-driven moderation.
- The UAE's departure from OPEC (effective May 1, 2026) reduces spare capacity from 3.8 mb/d to 2.5 mb/d by 2027, structurally limiting the cartel's stabilising role and adding a new dimension of uncertainty to medium-term supply management.
- US sanctions on Russian energy exports may intensify in 2026, targeting major producers and their shadow fleet of over 180 vessels, though global supply growth from the Americas has mitigated prior disruption risks.
- Energy transition dynamics cap Brent at $65–75/bbl through 2035 in the medium-term consensus view, amid slower EV adoption and persistent demand from Asian emerging markets.
- OPEC+ announced 206,000 b/d production increases for April 2026 based on pre-conflict low inventories, but these are now dwarfed by the scale of the Hormuz shut-ins. Future OPEC+ policy decisions will hinge entirely on the pace of Strait normalisation.
When looking for oil-price predictions, it's important to remember that analysts' forecasts may be wrong. This is because their projections are based on a fundamental and technical study of WTI and Brent oil commodities’ historical price movements. But past performance and forecasts are not reliable indicators of future results.
The AI oil price forecast shown is generated using algorithmic and AI-based models. These models rely on historical data and assumptions, which may not capture future market conditions accurately. Outcomes may differ significantly from forecasts.
It is essential to do your research and always remember that your decision to trade depends on your attitude to risk, your expertise in the market, the spread of your investment portfolio, and how comfortable you feel about losing money. You should never invest money that you cannot afford to lose.
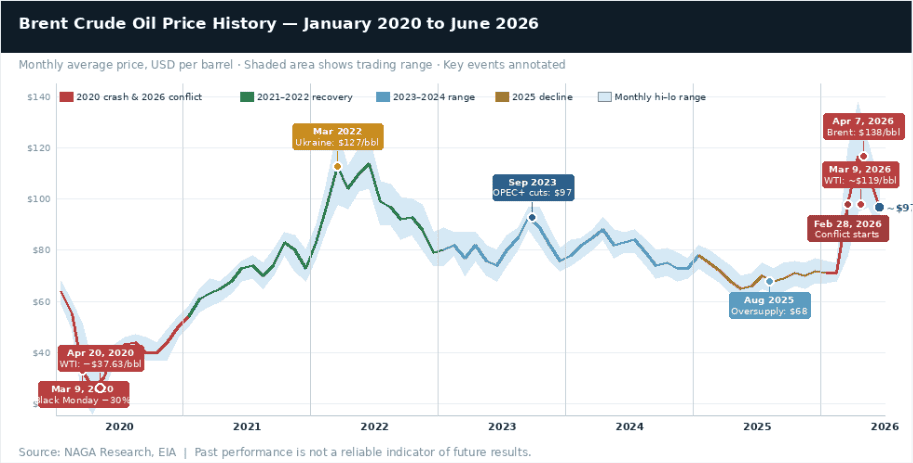
A Recent History of Oil Price Changes Over Time
From a pandemic-era low of $42/bbl in 2020 — including one extraordinary moment when WTI futures turned negative — to a 2022 war-driven peak above $127/bbl, and back down toward $65/bbl before the 2026 conflict sent Brent surging past $138/bbl, crude oil has traced one of the most dramatic price paths of any major asset class this decade. Understanding that history is an essential context for any forward-looking oil forecast.
Past performance is not a reliable indicator of future results. All historical data, including but not limited to returns, volatility, and other performance metrics, should not be construed as a guarantee of future performance.
2020: COVID Crash & Black Monday
Brent averaged just $42/bbl in 2020 — the lowest annual average since 2004. On March 9, the Saudi–Russia price war erupted simultaneously with COVID-19 demand collapse: Brent plunged roughly 30% in its biggest one-day fall since the Gulf War, crashing from $46 to $31/bbl as Riyadh announced steep discounts and ramped production toward 12.3 mb/d. Prices bottomed near $16/bbl in April. On April 20, WTI futures for May delivery fell to –$37.63/bbl — the first negative oil price in history — as Cushing, Oklahoma storage reached capacity. OPEC+ agreed to historic cuts of 9.7 mb/d in April 2020, stabilising markets and setting up the recovery.
2021–2022: Recovery, Then Ukraine Shock
Brent recovered steadily through 2021, averaging $70/bbl as vaccines rolled out and demand rebounded sharply. Russia's invasion of Ukraine on February 24, 2022, drove Brent above $127/bbl in March 2022 — its highest level since 2008 — before coordinated strategic reserve releases and demand destruction brought prices back toward $85–95/bbl through H2 2022. Brent averaged $101/bbl for the full year 2022, the highest annual average since 2013.
2023–2024: OPEC+ Cuts vs. Non-OPEC Supply Growth
Brent averaged $82/bbl in 2023 and $80/bbl in 2024 as OPEC+ maintained aggressive production cuts of up to 3.66 mb/d to support prices against rising non-OPEC+ supply from the US, Brazil, and Guyana. The market traded in a relatively narrow $72–$97 range across both years, with repeated OPEC+ cut extensions preventing the supply surplus from building into a full-blown bear market. US crude output reached record highs of 13.3 mb/d in 2024.
2025: Oversupply Returns, Brent Slides Below $70
OPEC+ began unwinding its production cuts in 2025, adding supply as non-OPEC+ output also continued to grow. Brent averaged $74/bbl in H1 2025 before declining sharply: by August 2025, the monthly average had fallen to $67.87/bbl — down $12/bbl from July 2024. WTI traded near $63/bbl. The pre-conflict consensus for 2026 pointed to Brent averaging just $55–63/bbl, with most banks forecasting a supply surplus of 2–4 mb/d. Refining margins compressed and upstream investment began to slow.
2026: Hormuz Closure Shatters the Trend
Brent opened 2026 near $69/bbl and averaged just $71/bbl in February — continuing the bearish channel. Then, on February 28, the US–Israel–Iran conflict erupted and the Strait of Hormuz was effectively closed. Brent surged 40%+ in March alone — the sharpest monthly gain since August 1990 — hitting $119/bbl on March 9 before briefly pulling back. Prices hit $138/bbl on April 7, the highest since June 2022, with the April monthly average settling at $117/bbl. As of June 3, 2026, Brent is trading near $97/bbl, supported by ongoing inventory draws of 8.5 mb/d in Q2 and stalled US–Iran ceasefire negotiations.
Factors That May Affect the Price of Crude Oil
1. OPEC+ production decisions
Quota changes directly drive supply volumes. The UAE's exit from OPEC (May 1, 2026) reduces spare capacity from 3.8 mb/d to 2.5 mb/d by 2027, limiting the cartel's stabilising role. OPEC meeting dates →2. US crude inventory data
Published weekly by the EIA, inventory builds signal oversupply and weigh on WTI prices; large draws signal tightness. The current record inventory draws of 8.5 mb/d in Q2 are the primary near-term price support. Economic calendar →3. Geopolitics & Strait of Hormuz
The current conflict has shut in 10.8 mb/d of Gulf production — nearly 10% of global supply. Any timeline shift in Strait reopening moves prices $20+/bbl (EIA sensitivity analysis). Market news →4. US Dollar value
As oil is denominated in USD, a weaker dollar stimulates demand from holders of other currencies, pushing oil prices higher. Dollar strength acts as a headwind. FX market outlook →
Final words
Make sure to create a free demo account on NAGA.com, which remains a useful multi-asset platform for both novice and expert traders. You will be up to date on data and market insights, and the user-friendly interface—with TradingView integration—will come in handy if you decide to trade crude oil or any other commodity.
If you look at the price changes of oil for a while now, you may see patterns, but they are driven by unpredictable forces—geopolitics, OPEC moves, and economic cycles—so as an investor, respond with care.
If you want to invest in oil, it can seem smart to get in when the price hits a bottom, but this timing approach is speculative and risky. There is no guarantee that oil prices will match past highs, and the energy transition and policy shifts still shape long‑term demand. Oil is finite and important, but it is not uniquely “the most precious”, and its role is changing as renewables and EVs expand. Investing in commodities can diversify your overall portfolio, though they are volatile and diversification does not guarantee profits or protect against losses.
Sources:
- EIA Short-Term Energy Outlook (STEO) — May 12, 2026
- IEA Oil Market Report — May 13, 2026
- OPEC Monthly Oil Market Report — May 2026
- EIA Annual Energy Outlook — Long-Term Narrative
- Reuters Commodities Coverage
- Rigzone — Industry News & EIA Coverage
- OilPrice.com — Market Intelligence
Other resources:
- Gold forecast & price predictions 2026
- EURUSD forecast & price predictions 2026
- Dow Jones forecast & price predictions 2026
- Natural Gas forecast & price predictions 2026
- Turkish Lira forecast & price predictions 2026
- Silver forecast & price predictions 2026
- NASDAQ 100 forecast & price predictions 2026
- British Pound forecast & price predictions 2026
- USD to INR forecast & price predictions 2026
- Egyptian Pound forecast & price predictions 2026