


Few assets in 2026 have moved as violently as silver. The metal carried 2025's extraordinary 148% rally into the new year, surging from December's $66 level to an all-time high of $90.00 per ounce on January 14, 2026 — driven by safe-haven demand, softening US inflation data, and expectations of Federal Reserve rate cuts.
That rally reversed sharply when President Trump nominated Kevin Warsh, a noted inflation hawk, as the next Federal Reserve Chair on January 30 — the shock triggered an immediate repricing of the entire rate-cut narrative that had underpinned silver's rise, and the metal fell more than 35% to the high-$50s by mid-February.
Since then, silver has staged a steady recovery, climbing back through the $60s and $70s as the Strait of Hormuz conflict added fresh safe-haven and industrial-disruption premiums, before this week's reported US–Iran ceasefire pushed silver up over 4% in a single session to $70.98 on June 15.
With such extraordinary volatility behind it, institutional silver forecasts for the remainder of 2026 have diverged dramatically. Will XAG/USD push toward $100 and beyond, or is a sharper correction overdue? Here is the full picture.
Silver Forecast & Price Prediction – Summary
- Silver price forecast H2 2026: From the current ~$71 level, the path forward depends heavily on whether the Iran ceasefire holds and how the new Fed chair's policy stance evolves — but the structural supply deficit provides a firmer floor than existed in prior cycles.
- BASE CASE ~50% ($75 – $90): The ceasefire holds and industrial demand continues recovering, pushing silver back toward J.P. Morgan's Q4 target of $85 and the Reuters poll median of $79.50. The fifth-year supply deficit provides a structural floor even as speculative froth from January unwinds further.
- BULL CASE ~25% ($100 – $150): Gold-silver ratio compression continues toward its long-term average of 65 or below as silver "catches up" to gold's own 2026 rally, while AI-driven industrial demand and a dovish Fed pivot push silver decisively above its January high. Bank of America's lower bull-case bound of $135 becomes a realistic year-end target.
- BEAR CASE ~25% ($50 – $60): J.P. Morgan's own Marko Kolanovic has warned silver could crash back to $50 if speculative positioning unwinds before fundamentals catch up — a repeat of February's Warsh-driven plunge is plausible if the ceasefire falters or a hawkish Fed signals higher-for-longer rates more forcefully than markets currently expect.
- Silver price prediction 2027: Morgan's own 2027 forecast holds silver at an average of $85/oz — effectively flat versus its 2026 Q4 target — suggesting the bank views the current repricing as largely complete rather than the start of a multi-year structural re-rating. This contrasts with the most bullish independent analysts, who argue that continuing supply deficits (now in their sixth consecutive year per Silver Institute data) and accelerating AI/solar demand growth point to a higher equilibrium price closer to $100+ sustained through 2027 rather than a peak-and-plateau pattern.
- Silver price prediction for the next 5 years: Longer-term silver bulls point to the gold-silver ratio's historical mean-reversion tendency: at a long-term average near 65 (and silver's own multi-decade average closer to 50–60), continued gold strength alone could pull silver meaningfully higher even without new catalysts. Structural demand drivers — solar panel manufacturing (potentially consuming 85–98% of current known silver reserves by 2050), EV electrification, and AI data centre buildouts — all point toward sustained, inelastic demand growth throughout the decade. The countervailing risk is substitution: silver's high price has already begun incentivising thrifting and substitution research in solar cell design, a multi-year risk to the bull case that several banks now flag explicitly.
With NAGA.com, you can trade Silver through CFDs (XAG/USD) if you want to speculate on price movements or invest in silver mining stocks and ETFs.
Silver Fundamental Analysis 2026
Silver's 2026 story is fundamentally a tug-of-war between an unprecedented monetary-policy shock and a deepening structural supply deficit that has now persisted for half a decade. Understanding both forces — and how they interact — is essential to making sense of the metal's extreme volatility.
The Warsh Shock — How a Fed Nomination Crashed Silver 35%
On January 30, 2026, President Trump nominated Kevin Warsh — a former Fed governor known for hawkish inflation views and criticism of post-pandemic monetary expansion — to succeed Jerome Powell as Federal Reserve Chair. The market reaction was immediate and severe: gold plunged from a record peak of $5,594/oz to settle near $4,745 that same day, and silver, trading at even higher beta to rate expectations, fell from its $90 peak into the high-$50s within weeks.
The move reflected a wholesale repricing of the rate-cut path that had driven silver's January surge — investors had been pricing aggressive Fed easing through 2026, and Warsh's nomination signalled a far more cautious, "sound money" approach to monetary policy. Warsh was confirmed by the Senate and sworn in on May 22, 2026, and held his first policy meeting as chair in mid-June, with rates remaining unchanged at 3.50–3.75% for a fourth consecutive meeting.
The Iran Ceasefire — A Fresh Catalyst for Recovery
Silver's most recent leg higher is tied directly to reports that the United States and Iran have reached a draft ceasefire agreement, expected to be signed in Switzerland this week, which would lift the US blockade and reopen the Strait of Hormuz to oil shipping. On June 15, 2026, silver spot prices rose 4.09% to $70.75, while gold gained 2.76% to $4,358.75 — with the gold-silver ratio compressing to 61.6 as silver's industrial-demand recovery story added momentum to its renewed monetary bid.
Commodity strategists caution that the rally could prove fragile: Saxo Bank's Ole Hansen specifically warned traders not to "chase headlines," noting investors should focus on what Iran is actually doing rather than presidential claims that the conflict has ended, while oil markets continued to price meaningful uncertainty around implementation even as risk assets rallied.
Fifth Consecutive Year of Global Supply Deficit
Beneath the headline volatility, silver's multi-year structural story remains intact. The global silver market is now in its fifth consecutive year of supply deficit, with cumulative shortfalls since 2021 approaching 910 million ounces — equivalent to roughly a full year of global mine output absorbed entirely by the deficit. While the 2025 gap was smaller than the peak deficits of 2022–2024, it continues eroding above-ground inventories in an already inelastic market.
Some 70–80% of global silver supply comes as a by-product of copper, lead, zinc, or gold mining, meaning higher prices cannot quickly translate into new supply — developing a new primary silver mine typically takes a decade from discovery to production. Exchange inventories have fallen to multi-year lows, spiking lease rates and delivery stress, such that even modest demand upticks can spark outsized price rallies.
AI and Data Centres — Silver's Newest Demand Driver
Silver is carving out a structurally important role in the AI infrastructure buildout. AI servers and accelerators consume two to three times more silver than traditional data centre hardware, owing to the metal's superior electrical and thermal conductivity in printed circuit boards, connectors, busbars, and thermal interfaces. With global data centre power demand set to roughly double, millions of additional silver ounces are being absorbed into hardware that is rarely recycled.
Crucially, this demand is largely price-insensitive: silver represents only a small fraction of multi-billion-dollar data centre build costs, dwarfed by far larger considerations like processing speed and energy efficiency — meaning even sharp silver price spikes do little to dent this consumption, intensifying pressure on an already tight physical market. Beyond AI, the solar industry remains silver's largest industrial consumer, with some projections suggesting solar panel manufacturing could absorb 85–98% of currently known global silver reserves by 2050, while the automotive sector's shift toward EVs and increasingly sophisticated electronics adds a further structural demand layer.
Gold-Silver Ratio — A Key Relative-Value Signal
The gold-silver ratio — how many ounces of silver it takes to buy one ounce of gold — is a closely watched signal of silver's relative strength. The ratio swung dramatically over the past 18 months: from a typical 80–90 range through most of 2024–2025, it compressed sharply to just 48 in January 2026 as silver's rally outpaced even gold's own strong run, before widening back out to around 72 during the February correction.
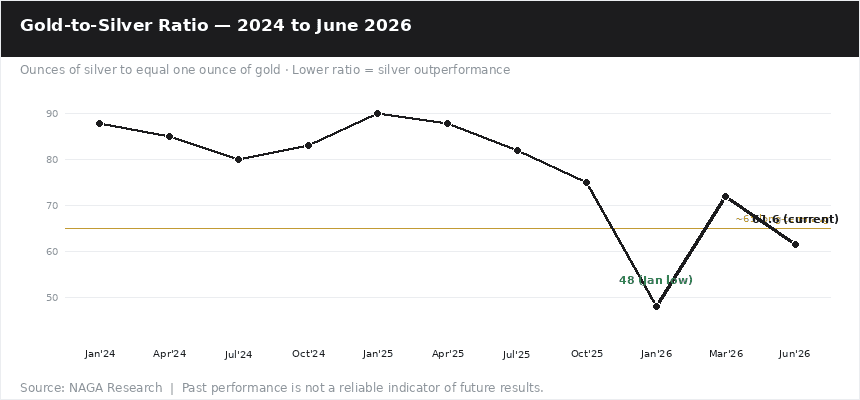
As of the end of Q2, the ratio sits above 60 — below its roughly 65 long-term historical average — suggesting silver remains relatively cheap versus gold by recent historical standards, even after its extraordinary 2025–2026 run. Many silver bulls view continued ratio compression toward the 50s or below as the clearest technical signal that silver's bull market has further to run.
How to Trade and Invest in Silver
Technical Silver Price Forecast 2026
Technically, silver's 2026 chart is dominated by the extreme January spike-and-reversal pattern. The rally to $90 on January 14 represented an unprecedented breakout above any prior resistance level, but the speed of the subsequent Warsh-driven reversal — over 35% in roughly three weeks — left the move looking unsustainable even to many silver bulls.
XAG/USD Weekly Chart Analysis
Silver's weekly chart shows price compressing into a symmetrical/descending triangle right at a pivotal level — the converging trendlines (the steep ascending support that's carried price up since spring, and the descending resistance capping each lower high since the January spike to $90+) are meeting almost exactly where price now sits, near $70-71, which also lines up with the horizontal support/resistance zone built during the August-November base before the breakout.
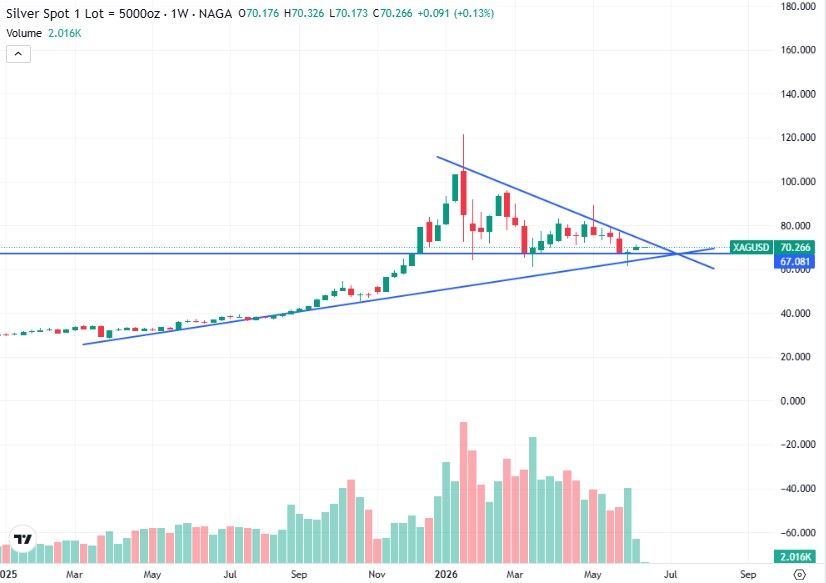
Past performance is not a reliable indicator of future results. All historical data, including but not limited to returns, volatility, and other performance metrics, should not be construed as a guarantee of future performance.
A confirmed close below the rising trendline (currently intersecting just under $70) and the horizontal floor around $67-68 would target a deeper retracement toward $58-60, the zone of the February-March correction lows, and would suggest the parabolic January spike was a blow-off top rather than the start of a sustained re-rating; conversely, holding the trendline here and reclaiming the $75-78 area would keep the broader uptrend intact and open the path back toward retesting the $90 high, consistent with the volume pattern showing declining selling pressure, which often precedes a continuation rather than a breakdown.
Given the bullish ceasefire-driven bounce already underway off this exact confluence zone, the immediate technical bias favours the bulls holding the line, but the triangle's apex is now so tight that the next weekly closes should resolve the pattern decisively in either direction.
Key Technical Levels
LEVEL PRICE SIGNIFICANCE 2026 All-Time High $90.00 January 14 peak; major resistance; a retest would require renewed rate-cut optimism Psychological Resistance $80.00 J.P. Morgan's Q4 2026 target zone; round-number resistance ⬤ Current Zone ~$71.00 Post-ceasefire-news level; highest since the Warsh-shock correction February Correction Low ~$58.00 Post-Warsh-nomination trough; key support if sentiment sours again 2025 Year-End Close $66.00+ Where silver started 2026; a reasonable "reset" level in a deeper pullback Bear Case Floor $50.00 J.P. Morgan's Kolanovic crash-case target if speculative positioning unwinds sharply Past performance is not a reliable indicator of future results. Technical levels are analytical reference points, not guaranteed price targets.
To learn more about technical analysis as a forecasting tool, visit NAGA Academy.
Silver Price Predictions 2026 — Institution Forecasts
The institutional forecast range for silver in 2026 is the widest of any major asset class this cycle. Here is where the leading voices stand, as of mid-June 2026:
INSTITUTION 2026 FORECAST 2027 BIAS KEY NOTES J.P. Morgan $81/oz avg; $85 Q4 $85/oz avg Constructive More than double the 2025 average; cites industrial demand, safe-haven flows, investor positioning Bank of America $135–$309 (Widmer) — Most bullish — extreme range Based on gold-silver ratio compression and supply constraints; widest single-bank range of the cycle Reuters Analyst Poll $79.50 (median) — Bullish consensus Keeps prices far above pre-rally historical norms; aggregates dozens of sell-side forecasts GoldSilver.com Survey $100+ (bull cases) — Bullish Highlights bull cases after a reported 147% prior-year surge Scottsdale Bullion & Coin $50–$80 (range) — Wide consensus range Reflects persistent bullish long-term sentiment within a wide forecast band J.P. Morgan (Kolanovic, bear case) $50/oz (downside risk) — Bear case Warns of a crash if speculative positioning unwinds before fundamentals catch up Forecasts reflect each institution's most recently published figures as of mid-June 2026 and may be revised further depending on how the Iran ceasefire and Fed policy under Chair Warsh evolve. The extraordinary spread between forecasts (from $50 to $309) reflects genuine uncertainty in this market rather than a typo — read all targets with appropriate caution. Past performance is not a reliable indicator of future results.
J.P. Morgan — $81/oz Average, $85 in Q4
J.P. Morgan Global Research's silver outlook leans on three core drivers: industrial demand (especially solar, EVs, and electronics), silver's role as a safe-haven asset during volatility spikes, and substantial investor flow into the metal as a hedge against inflation and regional conflict risk. The bank's $81/oz average for 2026 is more than double silver's 2025 average, with the fourth quarter expected to be the year's strongest at $85/oz.
For 2027, J.P. Morgan holds its forecast roughly flat at $85/oz, implying the bank views the bulk of the structural re-rating as complete rather than ongoing. The bank does flag a meaningful risk to the downside: analyst Marko Kolanovic has warned that silver could fall back to $50 if speculative positioning unwinds faster than underlying fundamentals can support current prices.
Bank of America — The Most Bullish Outlier
Michael Widmer, BofA's head of metals research, holds the most aggressive bull case among major banks, projecting silver could reach anywhere between $135 and $309 per ounce before the end of 2026. The thesis rests on gold-to-silver ratio compression — Widmer argues silver remains historically cheap relative to gold even after 2025's rally — combined with the same supply-constraint dynamics other banks cite but extrapolated more aggressively.
This silver price forecast represents the widest single-bank target range of the current commodities cycle and should be read as a genuine outlier rather than the institutional centre of gravity, though it illustrates how seriously some desks are now taking the possibility of a sustained silver super-cycle.
AI-Based Silver Forecasts — What the Algorithms Say
Alongside traditional bank research, a growing number of algorithmic and AI-driven forecasting platforms publish their own silver price models, typically blending historical price patterns, technical indicators, and market sentiment data. These models have produced some of the widest and most actively updated forecasts in the current cycle and are worth reading alongside — not instead of — fundamental bank research.
MODEL NEXT 7–30 DAYS END OF 2026 2027 BIAS CoinCodex (live algorithm) $77.12 by Jun 22 (+10.5%) $62.11 (−11% vs. spot) — Bullish near-term, bearish year-end WalletInvestor $75.24 high / $62.79 low (14-day) $73.16 $66.13 Neutral-bearish, technical model LongForecast $77.53 (early Jun) $97.04 (Q4 high) $90.52–$129.34 range Bullish, momentum-based CoinPriceForecast — ~$110 $109–$134 Aggressively bullish
The spread across AI models is, if anything, even wider than the spread across traditional bank forecasts.
- CoinCodex's own live forecast is bullish in the immediate near term, but turns sharply bearish on a 12-month view, targeting just $62.11 by year-end, a divergence that reflects how heavily these technical models weight recent price momentum and mean-reversion patterns over structural fundamentals.
- WalletInvestor's model sees near-term two-way risk ($75.24 upside versus $62.79 downside over 14 days) before settling lower into 2026 year-end and 2027.
- By contrast, LongForecast and CoinPriceForecast lean firmly bullish, with LongForecast targeting a Q4 2026 high of $97.04 and CoinPriceForecast projecting roughly $110 by year-end — both far closer to the institutional bank consensus than CoinCodex's bearish year-end call.
Note: Treat any single AI-generated silver price target as one data point among many, not a standalone forecast.
Silver Price History — The Most Important Moments
Silver's price history is a story of recurring speculative manias separated by long, quiet bear markets — and 2026 has already produced one of the most dramatic chapters in that nearly 50-year history.
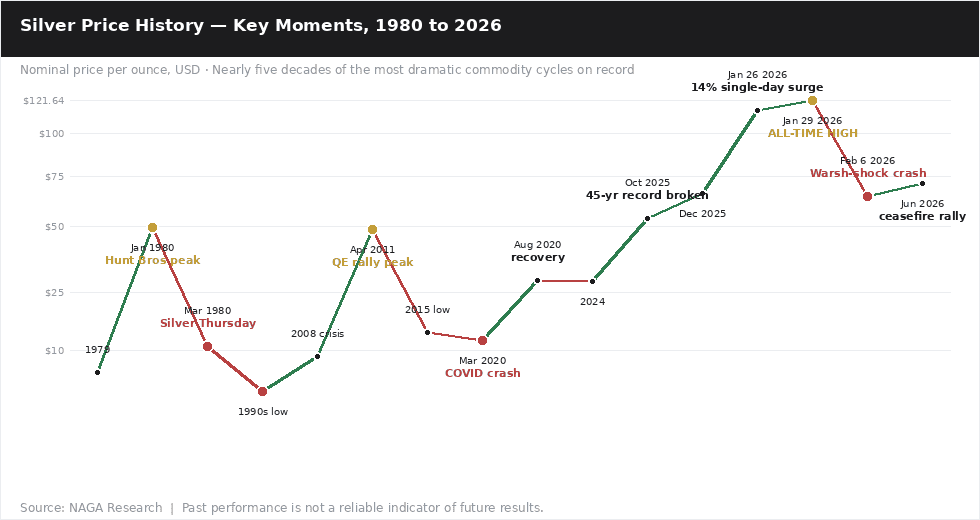
1979–1980: The Hunt Brothers Corner and Silver Thursday
The defining event in silver's modern history. Texas oil billionaires Nelson Bunker Hunt and William Herbert Hunt accumulated an estimated 100–200 million ounces of silver — roughly a third of the world's deliverable supply outside government reserves — driving the price from $6.08 on January 1, 1979, to a then-record $49.45 on January 18, 1980 (with futures briefly touching $50.35 intraday). When the COMEX imposed emergency margin rules restricting purchases on credit, the brothers were unable to meet margin calls, and on March 27, 1980 — forever known as "Silver Thursday" — the price collapsed to $10.80, losing half its value in a single day.
2011: The Post-Financial-Crisis QE Rally
Riding a wave of post-2008 quantitative easing, dollar weakness, and the launch of major silver ETFs like iShares' SLV, silver rallied from an $8.88 financial-crisis low to $48.70 in April 2011 — briefly surpassing the Hunt Brothers' nominal record before pulling back sharply as the global economy stabilised and risk appetite normalised.
2020: The COVID Crash and V-Shaped Recovery
Silver fell to $12.01 in March 2020 as the pandemic triggered a global liquidity crunch and industrial demand collapsed alongside locked-down economies. The recovery was remarkably swift: by August 2020, silver had rallied to $29 — a seven-year high — as massive monetary and fiscal stimulus reignited inflation-hedge and store-of-value demand, a pattern that would become a recurring theme through the 2020s.
October 2025: The 45-Year Record Finally Falls
After 45 years as the nominal ceiling, the 1980 Hunt Brothers record was finally broken in October 2025, when spot prices in London vaulted above $53.40 amid a severe bullion liquidity squeeze — one-month silver lease rates soared past 30%, signalling acute physical market stress as traders and arbitrageurs scrambled for metal.
January 26–29, 2026: The Parabolic Blow-Off to a New All-Time High
Silver's most explosive move in modern history came in the final days of January 2026. On January 26, the metal surged 14% in a single session to $115.08 — its largest 24-hour gain since 1985 — as the breach of the psychological $100 barrier triggered cascading forced liquidations among short-sellers. The rally culminated on January 29 at $121.64, the highest nominal silver price ever recorded, comfortably surpassing even the October 2025 breakout. The move was driven by a brutal physical supply-demand mismatch layered on top of the existing structural deficit, rather than pure speculation alone.
February 6, 2026: The Warsh-Shock Crash
The euphoria proved short-lived. Following President Trump's January 30 nomination of inflation-hawk Kevin Warsh as the next Federal Reserve Chair, silver collapsed from its $121.64 peak to around $64 by February 6 — a drawdown of nearly 47% in just over a week, wiping out a substantial share of the January gains as markets violently repriced the expected pace of Fed easing.
June 2026: The Ceasefire Rally
Silver has spent the months since steadily rebuilding, climbing back through the $60s and into the low-$70s. The latest leg higher came on June 15, 2026, when reports of an imminent US–Iran ceasefire agreement — to be signed in Switzerland — sent silver up 4.09% in a single session to $70.98, with the gold-silver ratio compressing to 61.6 as renewed risk appetite and an improving industrial-demand outlook combined to support the metal.
When looking for silver price predictions, it is important to remember that analysts' forecasts can be wrong — sometimes by extraordinarily wide margins, as the current $50–$309 institutional range demonstrates. Projections are based on fundamental and technical analysis of historical price movements; past performance and forecasts are not reliable indicators of future results. It is essential to conduct your own research. Your decision to trade depends on your attitude to risk, your expertise in the market, the spread of your investment portfolio, and how comfortable you feel about losing money. Never invest money you cannot afford to lose.
Sources:
- J.P. Morgan Global Research — Silver Price Outlook 2026
- TheStreet — Bank Forecast Survey, June 2026
- The Silver Institute — Global Silver Market Data
- USAGOLD — Daily Precious Metals Market Report
- Yahoo Finance — Silver Prices Today
- GoldSilver.com — Industry News & Forecast Survey
Other Resources:
- Gold forecast & price predictions 2026
- Oil forecast & price predictions 2026
- Natural Gas forecast & price predictions 2026
- EUR/USD forecast & price predictions 2026
- Dow Jones forecast & price predictions 2026
- NASDAQ 100 forecast & price predictions 2026
- British Pound forecast & price predictions 2026
- Turkish Lira forecast & price predictions 2026
- USD to INR forecast & price predictions 2026
- Egyptian Pound forecast & price predictions 2026