


The USD/INR pair has swung through one of its widest ranges in modern history in the first half of 2026 — from a low of 89.86 in early January to an all-time record high of 96.84 on May 20, before staging a partial recovery to around 94.35 by late H1.
The proximate causes of the rupee's slide were well understood: a 50% US tariff overhang dating back to mid-2025 that hammered Indian export competitiveness, sustained foreign portfolio outflows from Indian equities, and a sharp spike in oil prices following the Strait of Hormuz conflict, which directly worsens India's import bill given the country's heavy dependence on imported crude.
The recovery since the May 20 record low has been driven by a coordinated policy response. The RBI held the repo rate at 5.25% on June 5 while expanding foreign access to government bonds, loosening portfolio limits, raising NRI equity caps, and adding liquidity support, while the government cut taxes on certain foreign investments in government securities.
Together with lower oil prices as Strait of Hormuz tensions eased, these measures have helped the rupee rebound from its record low — but whether that recovery lasts into H2 2026 remains the key question.
Indian Rupee Forecast 2026 — Key Notes
USD/INR price prediction H2 2026: The Indian Rupee outlook for the rest of 2026 will likely be determined by the same two external variables that have driven the entire year: oil prices and the US dollar's broader trajectory, layered on top of India's own capital-flow dynamics.
- BASE CASE~45% (93 – 96): USD/INR remains range-bound, consistent with Cambridge Currencies' 93–98 forecast and the May 2026 bank survey average. RBI intervention and the new capital-account measures provide a floor against renewed selling, while persistent trade tensions and oil-price sensitivity cap any sustained rupee strength below 93.
- BULL CASE (Rupee)~25% (88 – 92): A durable Iran ceasefire holds, Brent crude falls toward $60–65, and the RBI's capital-account liberalisation package succeeds in reversing the 2026 FPI outflow trend. ING and Bank of America's more optimistic published targets (87 and 86 respectively) become achievable as foreign capital returns to Indian government bonds and equities.
- BEAR CASE (Dollar) ~30% (96 – 100): The Strait of Hormuz conflict reignites, oil spikes back above $100, and a hawkish Fed (one or two further 2026 hikes) drives sustained dollar strength globally. Combined with continued FPI outflows and a wider trade deficit, USD/INR breaks above the May record of 96.84 and tests the psychologically significant 100 level — Cambridge Currencies' explicit tail-risk scenario.
With NAGA, you can gain exposure on the Indian market through CFDs, stocks, and ETFs, or by following and copying lead traders who specialise in fast-growing emerging markets.
Indian Rupee (USD/INR) Fundamental Analysis 2026
The H2 2026 Indian Rupee outlook hinges on a coordinated RBI policy response, capital-account liberalisation, and whether structural headwinds from US tariffs, oil dependency, and foreign outflows will reassert themselves in the second half of the year.
RBI Policy — Holding Rates Amid Stagflation Risk
The Reserve Bank of India's Monetary Policy Committee voted unanimously to hold the repo rate at 5.25% on June 5, 2026 — its second consecutive hold — while simultaneously cutting its FY27 GDP growth forecast to 6.6% (from 6.9% in April) and raising its inflation forecast to 5.1% (from 4.6%). Governor Sanjay Malhotra maintained a "neutral" policy stance even as wholesale price inflation has been alarming, though core retail inflation has remained relatively contained, giving the RBI some breathing room.
The combination of slowing growth and rising inflation has sparked genuine market discussion about emerging stagflationary risk in India — a markedly different narrative from the disinflationary, high-growth story that characterised India's macro picture for most of 2024–2025. The RBI's Standing Deposit Facility rate remains at 5%, with the Marginal Standing Facility and Bank Rate both at 5.5%.
The May 2026 Capital-Account Liberalisation Package
Alongside its June rate decision, the RBI announced one of the most significant capital-account liberalisation packages in recent Indian monetary history, explicitly designed to attract foreign capital and support the rupee. The measures included:
- expanding the Fully Accessible Route to include all new 15-, 30-, and 40-year government securities (which places these bonds in three major global bond indices);
- entirely removing investment and concentration limits for foreign portfolio investors under the General Route;
- increasing equity investment caps for Non-Resident Indians and Overseas Citizens of India; and introducing tactical liquidity facilities.
The government complemented these measures by removing capital gains and withholding taxes on certain foreign investments in government securities. The RBI also introduced a concessional forex swap facility through September 30, 2026, to incentivise external commercial borrowings, and committed to bearing the full hedging costs on fresh 3–5 year Foreign Currency Non-Resident deposits through the same date. This represents a coordinated fiscal-and-monetary push to reverse the $13.7 billion in foreign equity outflows recorded so far in 2026.
Trade Tensions and the Tariff Overhang
The 50% US tariff on Indian exports — announced in mid-2025 amid stalled bilateral trade negotiations — remains the single largest structural headwind for the rupee. The tariff has directly undermined the competitiveness of Indian goods in the US market, India's largest single export destination, contributing to a wider trade deficit and reduced dollar inflows from exports. Whether the US and India reach a trade agreement that reduces or removes these tariffs is one of the most important — and least predictable — variables for the rupee's medium-term trajectory. A resolution would directly support the bull case for INR appreciation; continued stalemate keeps structural pressure on the currency intact regardless of what RBI policy does.
Oil Prices and the Strait of Hormuz Factor
India imports approximately 85% of its crude oil needs, making it one of the most oil-price-sensitive major economies globally. The Strait of Hormuz conflict that began in early 2026 drove Brent crude sharply higher, directly worsening India's import bill and current account position at the same time foreign capital was already leaving.
The subsequent partial de-escalation — including a 60-day US-Iran negotiating period and reports of tanker traffic gradually normalising through the Strait — has allowed oil prices to retreat from their peaks, providing meaningful relief to the rupee's recovery from the May 20 record low. This relationship is direct and immediate: every sustained $10 move in Brent crude has historically corresponded to a meaningful shift in USD/INR, given the scale of India's energy import dependency.
Oil forecast and price predictions 2026
Foreign Portfolio Flows — The Structural Swing Factor
Foreign portfolio investors have withdrawn more than $13.7 billion from Indian equities in the first half of 2026, extending a trend that made the rupee one of Asia's weakest currencies for much of the year. This outflow reflects a combination of factors: reduced risk appetite for emerging markets amid global rate uncertainty, specific concerns about Indian growth following the RBI's downward GDP revision, and relative attractiveness of US assets during periods of dollar strength.
The RBI's June capital-account measures are explicitly designed to counteract this trend by making Indian government bonds more accessible and attractive to foreign investors — including placement in major global bond indices via the expanded Fully Accessible Route. Early signs suggest some stabilisation: capital-flow dynamics have reportedly improved since the June measures, with foreign investment into Indian debt markets strengthening even as equity outflows have moderated.
USD/INR Technical Analysis
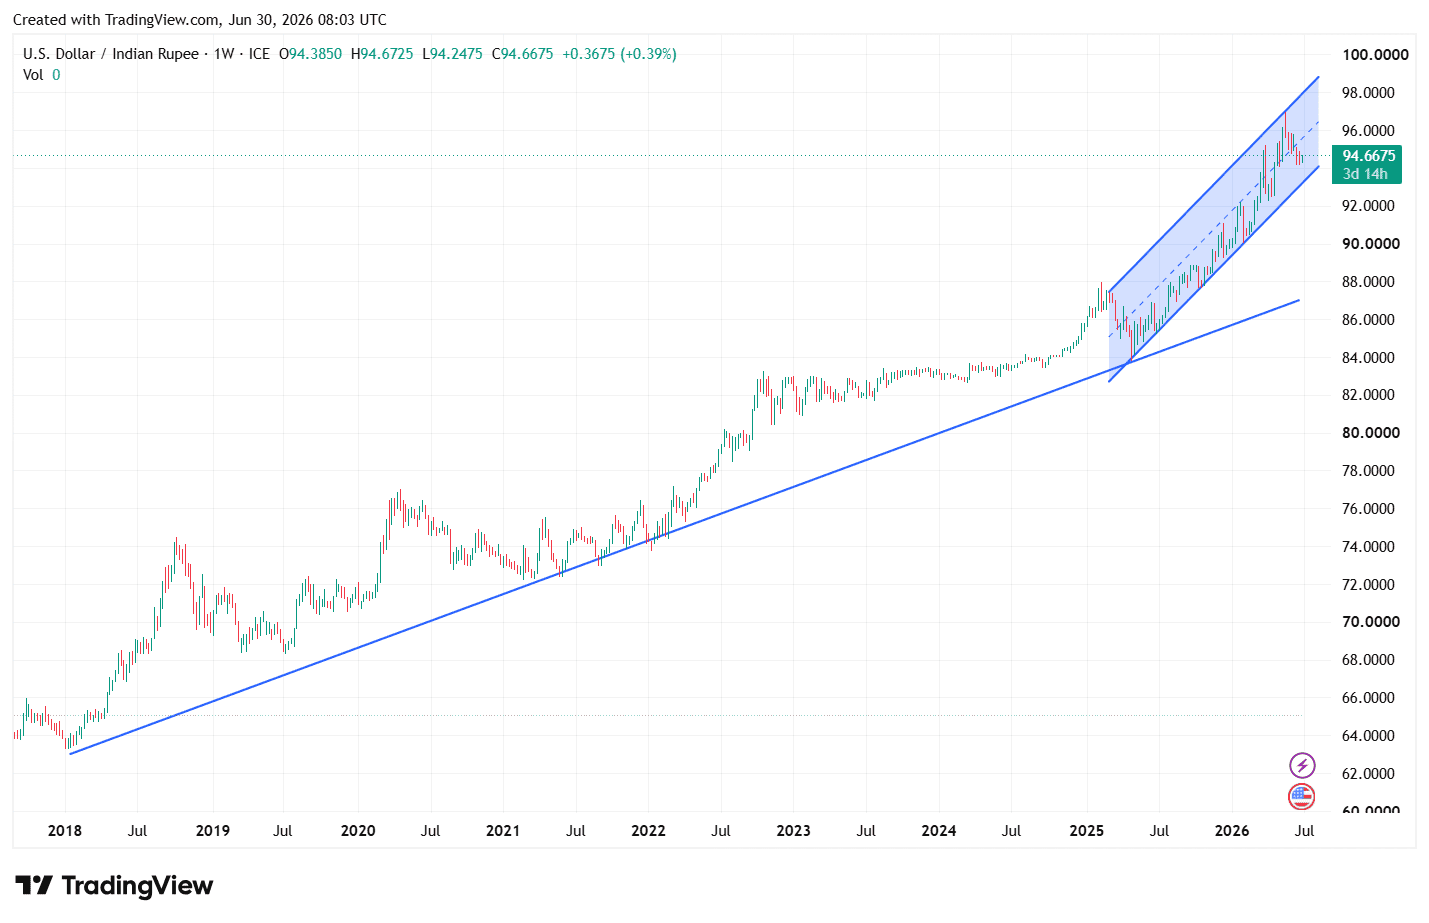
The USD/INR chart tells a three-timeframe story, and reading all three together is the key to interpreting where the pair goes from here: a 15-year structural uptrend, a much steeper intermediate channel that began in May 2025, and a short-term Fibonacci retracement.
Past performance is not a reliable indicator of future results. All historical data, including but not limited to returns, volatility, and other performance metrics, should not be construed as a guarantee of future performance.
Long-Term USD/INR Analysis — 15 Years of Structural Rupee Depreciation
The blue ascending trendline connects the 2011 low (~₹44) through over a decade of higher lows, now at ~83.77 — nearly where the May 2025 low also formed. This represents the structural, multi-decade rupee depreciation driven by India-US inflation differentials. A break below would be the first genuine violation of USD/INR's 15-year uptrend — a far more significant event than any shorter-term move.
Medium-Term USD/INR Analysis — 1 Year Ascending Channel
A steeper rising channel began at the May 2025 low (~83.77), capturing the acute 13-month rupee weakness driven by tariffs, portfolio outflows, and Hormuz oil pressure. Price has traded inside this channel for over a year; the May 20, 2026 all-time high of 96.89 tested the upper boundary. The pullback to ~94.35–94.69 is a normal retracement toward the channel's middle, not a trend reversal.
Short-Term USD/INR Analysis — Fibonacci Retracement
The Fibonacci from May 2025 low (83.77) to May 2026 high (96.89) provides the near-term map. USD/INR has pulled back through the 0.236 level (93.79) and is consolidating just above it in the 92–94 zone, bounded by 0.236 (93.79) above and 0.382 (91.88) below. The 0.5 sits at 90.33; the 0.618 (trend-change threshold) at 88.78. A drop to 88.78 would still be a retracement within the uptrend; only a sustained break below it, and ultimately below 84, signals genuine deterioration.
USD/INR H2 2026 Technical Forecast
Scenario Probability Outlook Key Drivers Bull (USD) / Bear (INR) ~30% 94 → New highs (>96.89) Oil shock or hawkish Fed surprise Base Case ~45% Consolidation near 92 Range 93–98; RBI smoothing volatility Bear (USD) / Bull (INR) ~25% Breakdown toward 88.78 Trade resolution + durable oil decline
Breaking the 0.618 (88.78) and 15-year trendline (84) would signal genuine trend deterioration.
USD to INR Forecast — Institution Predictions
A May 2026 survey of major investment banks by Exchange Rates UK Research revealed a genuine and notable split in institutional views — unusual for this currency pair, which has historically seen more forecaster consensus.
Institution 2026 Target Bias Key Driver / Caveat Danske Bank ~95–97 Dollar stays firm Sees USD/INR remaining close to current elevated levels through the rest of 2026 Goldman Sachs ~95–97 Dollar stays firm Also revised India GDP growth down to 5.9% from 7% — more cautious than RBI's own 6.6% forecast MUFG ~95–97 Dollar stays firm Part of the camp expecting limited rupee recovery through 2026 Bank of America ~86 Most bullish (rupee) Attributes 2025–26 weakness to global forces rather than domestic factors, expects reversion ING ~87 Bullish (rupee) Expects India to eventually secure a lower US tariff rate, providing upside for INR ExchangeRates.org.uk 95.508 Near current levels Quantitative model; six-month projection at 94.752, one-year at 94.231 Cambridge Currencies 93 – 98 (range) Range-bound, structurally weak Base case is range-bound rather than directional; explicit 97–100 tail risk and 93–94 relief scenario CoinCodex 90.85 – 95.37 Mildly bullish (rupee) Algorithmic model; average annualised 93.48 for 2026, bearish (for USD) trend into November
The institutional split is genuinely informative: banks projecting continued USD/INR strength near 95–97 (Danske, Goldman Sachs, MUFG) are generally those most weighted toward the structural headwinds — persistent trade tensions, India's twin deficit dynamics, and a still-resilient US dollar. Banks projecting a stronger rupee toward 86–87 (Bank of America, ING) are weighted more heavily toward a resolution of US-India trade tensions and a broader view that 2025–26 rupee weakness reflected temporary, reversible global forces rather than a structural Indian problem. Where this resolves likely depends most heavily on the outcome of US-India trade negotiations — a genuinely binary variable that most quantitative models cannot price with confidence.
AI-Based USD/INR Forecasts
Algorithmic and AI-driven forecasting models for USD/INR show a similarly wide dispersion to the institutional bank forecasts, reflecting the same underlying uncertainty about trade policy and oil prices.
Model 2026 Range / Year-End 2027 2030 Bias & Notes WalletInvestor ~93.21 year-end — 103.57 (2030) / 89.72 (2031)* Conflicting outputs across publication dates illustrate model instability; most recent run shows long-term INR strength toward 89.72 by 2031 AI Pickup Algorithm ~93.00 year-end 91.50 78.35 Most bullish (rupee) long-term model; projects steady INR appreciation from 2027 onward toward 78.35 by 2030 TradersUnion (statistical) ~99.59 year-end 96.98 108.37 (by end-2030) Most bearish (rupee) model; projects continued structural USD/INR appreciation through the decade LongForecast ~95.13 (Jun), volatile monthly swings ~102–107 range ~109–115 range Mechanical month-by-month model showing high volatility and a persistent weakening (USD strength) bias over time XS.com Research Near 90–91 short term 85 by Sep–Dec (base); DBS 92.60 vs Westpac 77 (polarised) 76–92 range (highly polarised) Explicitly highlights diverging 2027–2028 institutional views; DBS bearish (rupee) vs Westpac bullish (rupee) scenarios shown side by side
The single clearest takeaway from the AI and algorithmic models is the scale of disagreement on long-term direction — TradersUnion's 108.37 and AI Pickup's 78.35 for the same approximate 2030 horizon represent a difference of more than 30 rupees, an extraordinary spread for a currency pair with India's scale of trade and capital flows. This divergence is largely explained by differing assumptions about two variables: whether US-India trade tensions resolve in the medium term, and whether the US dollar's broader multi-year cycle turns lower (supporting EM currencies including INR) or remains structurally elevated. Both XS.com and the institutional bank survey explicitly flag this same polarisation, suggesting it reflects genuine, unresolved uncertainty in the underlying drivers rather than a flaw in any individual model.
USD/INR Price History — Key Moments
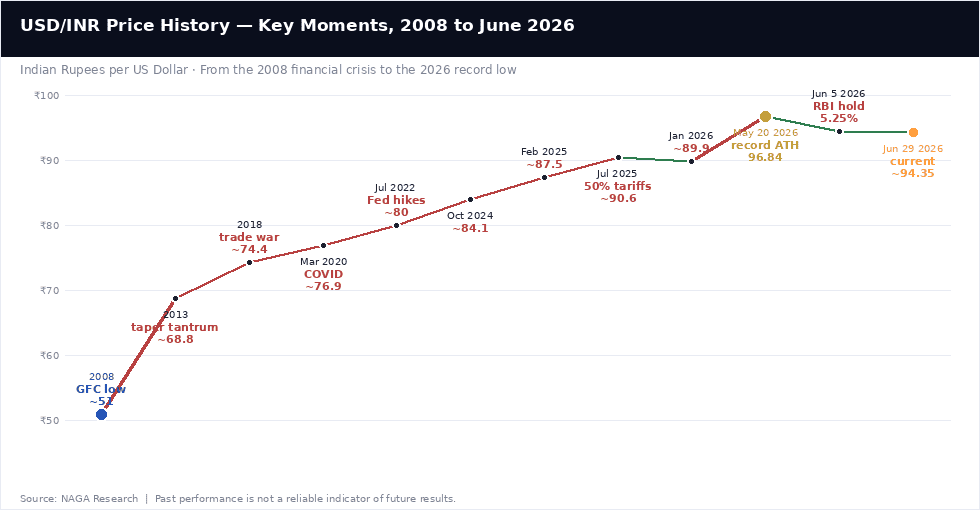
The Indian rupee's depreciation against the dollar has been a multi-decade trend, punctuated by periods of acute stress and partial recoveries.
2008: The Global Financial Crisis
USD/INR rose from approximately 40 to over 51 during the 2008 global financial crisis, as foreign capital fled emerging markets en masse and the dollar strengthened broadly as a safe-haven currency. This marked the rupee's first major modern depreciation episode and established the pattern — global risk-off events driving sharp, rapid INR weakness — that would recur repeatedly over the following decade and a half.
2013: The Taper Tantrum
USD/INR spiked to nearly 68.8 in 2013 when then-Federal Reserve Chairman Ben Bernanke signalled that the Fed would begin tapering its quantitative easing programme, triggering a broad emerging-market selloff as capital rushed back toward US assets. India was identified as one of the "Fragile Five" emerging economies most vulnerable to the taper tantrum, given its twin fiscal and current account deficits at the time — a vulnerability profile that, in a different form, persists in 2026's structural narrative around trade deficits and capital outflows.
2018–2020: Trade War and the COVID Shock
USD/INR climbed steadily through the US-China trade war years, reaching approximately 74.4 by 2018, before the COVID-19 pandemic drove a sharp risk-off spike to around 76.9 in March 2020. The rupee's relative resilience during the pandemic — compared to the scale of the global shock — reflected both RBI intervention and India's substantial foreign exchange reserve buffer built up in preceding years.
2022–2024: The Fed Hiking Cycle
The Federal Reserve's most aggressive rate-hiking cycle in decades drove USD/INR from approximately 76 to 80 through mid-2022, as the dollar strengthened broadly against virtually all major and emerging-market currencies. The rupee continued its gradual depreciation through 2023 and 2024, reaching approximately 84.1 by October 2024, broadly tracking the persistent pace of Indian inflation differentials against the US alongside periodic bouts of capital outflow.
2025: Tariffs and Asia's Weakest Currency
The Indian rupee fell more than 5.5% against the dollar in 2025, making it Asia's worst-performing major currency for the year. The proximate cause was the announcement of 50% US tariffs on Indian imports amid stalled bilateral trade negotiations, which directly undermined Indian export competitiveness and contributed to sustained foreign portfolio outflows from local equity and bond markets. USD/INR rose from the high-80s to approximately 90.6 by July 2025 as the tariff news was fully priced in.
2026: Record Low, Then Recovery
USD/INR opened 2026 near 89.9 before a combination of continued trade tensions, persistent FPI outflows (over $13.7 billion in equities by June), and the impact of the Strait of Hormuz conflict on oil prices drove the pair to an all-time record high of 96.84 on May 20, 2026. The Reserve Bank of India's June 5 policy decision — pairing a repo rate hold at 5.25% with an aggressive capital-account liberalisation package — combined with falling oil prices following the Iran-Israel-US de-escalation, drove a meaningful recovery to approximately 94.35 by late June. The rupee remains down 10.15% over the trailing 12 months, reflecting how much ground was lost even after the recent recovery.
The information provided is for general informational purposes only and does not constitute investment advice, an investment recommendation, a personalised recommendation, or an offer or solicitation to engage in any investment activity.
USD/INR forecasts are inherently uncertain, and the 2026 experience — where the pair moved from 89.86 to a record 96.84 and back to 94.35 within five months — illustrates how rapidly conditions can change for this currency pair. Forecasts are based on current fundamental and technical analysis; past performance and analyst projections are not reliable indicators of future results. Never invest more than you can afford to lose and always conduct your own research before making trading decisions.
Sources
- Reserve Bank of India — Reference Rate Archive
- Forbes India — RBI MPC June 2026 Decision Coverage
- Trading Economics — Indian Rupee Historical Data
- Exchange Rates UK Research — USD/INR Bank Forecast Survey, May 2026
- Cambridge Currencies — USD to INR Forecast 2026
- Federal Reserve Board — Foreign Exchange Rates H.10
Other Resources
- EUR/USD forecast & price predictions 2026
- British pound (GBP) forecast 2026
- Turkish lira forecast 2026
- Gold forecast & price predictions 2026
- Oil forecast & price predictions 2026
- Global interest rate forecast 2026
- How to trade forex
- Technical analysis academy guide
- Emerging markets currency guide
- Fundamental analysis — what moves FX