Price gaps are recurring after the weekend break; however, the market rarely sees a price gap measuring 7.99%. The global Organization of the Petroleum Exporting Countries over the past 24 hours confirmed the cartel would reduce production targets by 1 million barrels. As a result, the price of both Crude and Brent Oil surged between 7.5% and 8.0%. Today, the OPEC group will conduct an all-day meeting, and investors hope OPEC will confirm if they believe demand will decline in 2023. Today’s market analysis will examine the outlook for oil prices below.
The US Dollar Index (DXY) rose significantly higher during this morning’s Asian session. The DXY climbed above 103.00 for the first time since March 24th. However, traders are still cautious after the Dollar has taken significant hits over the past three weeks. The currency which is experiencing the most substantial declines across the currency market is the Japanese Yen. The Japanese economy largely relies on Oil imports. For this reason, investors are concerned that higher oil prices will again negatively affect Japan’s economy. The Japanese Yen is declining against the Dollar, the Pound, and the Euro.
Crude Oil
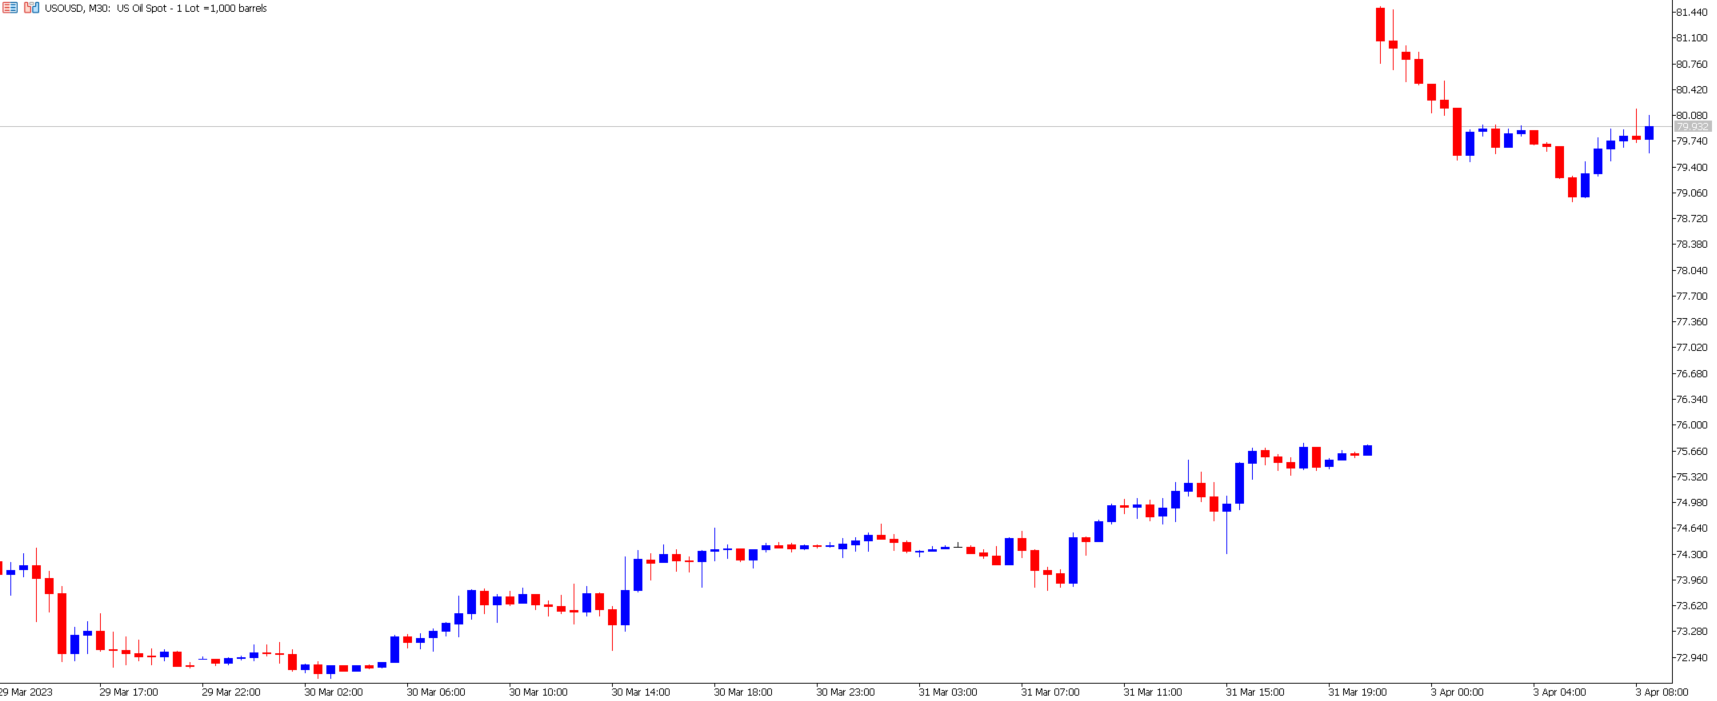
The crude Oil opened on a bullish price gap measuring 7.61% but has declined since the market opened. The price is now currently trading 5.45% higher than Friday’s market close. The main driver of the higher price is OPEC’s decision to cut production targets by 1 million barrels daily. Certain members also promise additional cuts.
The countries which have confirmed the highest cuts are Russia and Saudi Arabia cutting 500,000 per day. Iraq is cutting 210,000, UAE is cutting 144,000, and Kuwait is cutting 128,000. With the additional target cuts, experts believe the market may see targets decline by more than 1.6 million barrels daily. However, the market should note that most countries produced significantly less than their targets. Therefore the real supply will decline by a lesser amount and will likely be less than a 1 million drop.
Investors are now looking to determine whether the OPEC group is reducing supply as they believe the level of demand will significantly decline or if the decision is being made to push prices back to their pre-set target of $80 per barrel. So far, Saudi Arabia has advised the cuts will start from May onwards, and the decision was a “precautionary measure”. This indicates the group is not predicting a decline in economic activity, but many economists are not biting the bait.
The price is also being supported by factors influencing the oil market from last week. For example, the closure of the Iraqi pipeline was due to a political disagreement between Iraq and Turkey, which supplied about 400,000 barrels per day. The US Crude Oil Inventories also sharply declined by 7.5 million barrels, and data from Baker Hughes on the number of active oil rigs unexpectedly dropped from 593 to 592 units. This week the price will also be influenced by comments made during today’s OPEC meeting, economic data, and employment figures from the States.
According to many analysts, the price of Crude Oil may reach as high as $100 per barrel. However, analysts can only justify such a strong bullish run if the global economy can avoid a global recession, specifically in China, the US, and India. In addition, the higher energy costs, if they continue, will increase inflation which may reverse previous indications of no more rate hikes or cuts later this year. If the Central Banks are forced to raise interest rates close to 6%, the chances of a global recession will significantly rise.
Technical analysis points towards a bullish trend when monitoring regression channels and Moving Averages. The only concern for technical analysts is related to the resistance levels, which have caused a collapse over the past five months; however, this level may be less relevant due to alterations in supply and demand.
Summary:
- Crude and Brent Oil opened on a bullish price gap measuring almost 8.00%. The higher price is triggered by OPEC’s decision to cut production targets significantly.
- The countries which have confirmed the highest cuts are Russia and Saudi Arabia cutting 500,000 per day.
- According to many analysts, the price of Crude Oil may reach as high as $100 per barrel.
- However, a recession will weaken predictions of the market’s target price for crude oil. Economists fear that higher energy prices will trigger higher inflation. As a result, interest rates will rise further, putting more strain on the economy.