1. Home
  2. Markets Updates
  3. EURUSD Consolidates After Strong May-July Rally

EURUSD Consolidates After Strong May-July Rally

EURUSD trades in a narrow range following a bullish run, showing indecision between 1.1600 and 1.1800. Technical indicators point to potential momentum shifts in the coming sessions.

21 August 2025

Share the article:

EURUSD_ProDaily_21_aug.png


Past performance is not indicative of future results. All historical data, including but not limited to returns, volatility, and other performance metrics, should not be construed as a guarantee of future performance.   

EURUSD on a Daily timeframe 


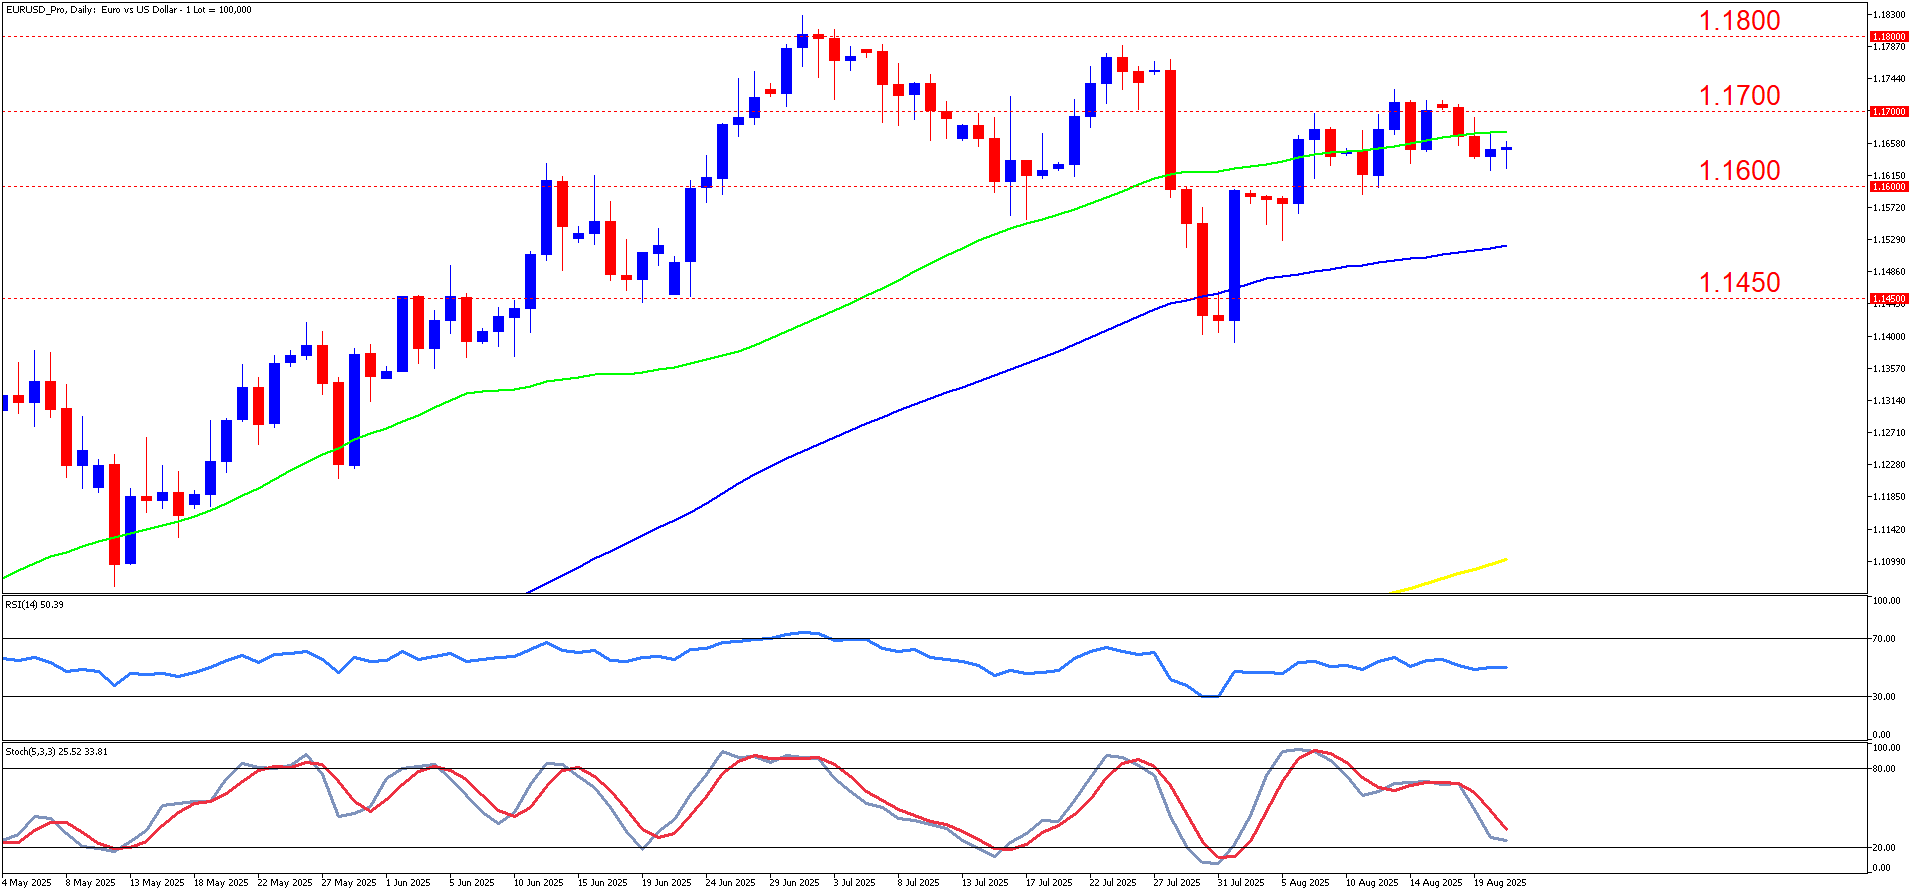
EURUSD on the daily timeframe shows that price action in May through early July was characterized by a strong bullish rally, pushing the pair from below 1.1400 up toward 1.1800. This uptrend established higher highs and higher lows while remaining above the 50-day moving average, showing solid momentum. However, after reaching the 1.1800 resistance area, the pair began to stall, with successive attempts to break higher failing and producing a sequence of lower highs since mid-July.
 

In the most recent sessions, EURUSD has been consolidating between 1.1700 and 1.1600, with choppy candlesticks suggesting indecision. Buyers attempted to hold the pair above 1.1700 but failed to sustain the breakout, and price has now drifted back closer to 1.1600 support. The candles show shorter bodies with wicks on both ends, reflecting a balance between buyers and sellers in this consolidation phase. 
 

Technical indicators provide mixed but telling signals. The RSI is sitting around 50, confirming the lack of clear directional momentum at present. The stochastic oscillator, however, is in the oversold zone near 25, suggesting bearish pressure has been dominant lately but is nearing exhaustion. The green moving average (short-term) has flattened, showing the slowdown in upward momentum, while the blue longer-term moving average is still trending upward, indicating that the broader uptrend structure has not yet been invalidated. Key support rests at 1.1600, with further downside potential toward 1.1450, while resistance levels stand at 1.1700 and 1.1800.
 

The primary scenario is that EURUSD continues to consolidate above 1.1600 before attempting another upward move. If buyers regain strength, the pair could retest 1.1700, and a successful breakout there would open the door to 1.1800 once again. Given the longer-term moving average trend, the underlying bias remains mildly bullish unless 1.1600 breaks decisively. 
 

The alternative scenario is a bearish breakdown below 1.1600. If sellers manage to push through this support, momentum could accelerate toward the 1.1450 area, which aligns with the rising longer-term moving average. Such a move would shift sentiment more decisively bearish and signal that the July top at 1.1800 was a medium-term high. 
 

From a fundamental perspective, in the past few days, the euro has been sensitive to European inflation readings, which showed signs of cooling, potentially reinforcing expectations that the European Central Bank will maintain a cautious stance. On the U.S. side, recent Federal Reserve commentary and stronger-than-expected labor data supported the dollar, adding pressure on EURUSD. Looking ahead this week, traders will closely watch Eurozone PMI releases and U.S. housing market data, as well as Fed Chair Powell’s upcoming speech for guidance on monetary policy. These events could provide the volatility needed for EURUSD to break out of its current range. 
 

SUMMARY:
 

  • Rally Paused: EUR/USD jumped from 1.1400 to 1.1800 in May–July, but momentum stalled mid-July. 
  • Sideways Action: The pair now trades between 1.1600 support and 1.1700–1.1800 resistance, showing indecision. 
  • Mixed Signals: RSI sits at 50, Stochastic near oversold, short-term MA flat, long-term MA still bullish. 
  • What’s Next: Staying above 1.1600 points to a retest of 1.1700–1.1800; a break below 1.1600 could drive a drop to 1.1450. 
IMPORTANT NOTICE: Any news, opinions, research, analyses, prices or other information contained in this article are provided as general market commentary and do not constitute investment advice. The market commentary has not been prepared in accordance with legal requirements designed to promote the independence of investment research, and therefore, it is not subject to any prohibition on dealing ahead of dissemination. Past performance is not an indication of possible future performance. Any action you take upon the information in this article is strictly at your own risk, and we will not be liable for any losses and damages in connection with the use of this article.
RISK WARNING: CFDs are complex instruments and come with a high risk of losing money rapidly due to leverage. A high percentage of retail client investors lose money when trading CFDs with this provider. You should consider whether you understand how CFDs work and whether you can afford to take the high risk of losing your money.

Related articles

EUR/USD Poised for 1.18 Breakout—MAs Signal Bullish Continuation
14 August 2025
EUR/USD holds above key moving averages as bulls test 1.1800 resistance. Technicals suggest potential breakout if macro data favors the euro.

Read more

XAUUSD Stalls at 3400 as Bearish Divergence Builds
7 August 2025
Gold (XAUUSD) is stalling below key 3400 resistance as bearish divergence emerges on RSI and Stochastics. Is a breakdown toward 3296 next? Traders watch for mean reversion.

Read more

XAUUSD Struggles to Reclaim 3296 in Bear-Controlled Setup
31 July 2025
XAUUSD shows corrective bounce below major EMAs in a bearish setup, with 3296 as near-term resistance and 3164 as critical support to watch.

Read more

Need Help? Visit our Help Section
Download NAGA Trader

Copyright © 2025 – All rights reserved.

NAGA is a trademark of The NAGA Group AG, a German based FinTech company publicly listed on the Frankfurt Stock Exchange | WKN: A161NR | ISIN: DE000A161NR7.

The website is operated by JME Financial Services (Pty) Ltd an authorised Financial Services Provider, regulated by the Financial Sector Conduct Authority in South Africa under license no. 37166. JME Financial Services (Pty) Ltd is located at Suite 10, 21 Lighthouse Rd 201 Beacon Rock, Umhlanga Rocks, Kwa-Zulu Natal, 4320, South Africa.

JME Financial Services (Pty) Ltd acts as an intermediary between the investor and NAGA Capital Ltd, the counterparty to the contract for difference purchased by the Investor via Naga.com/za. NAGA Capital Ltd is authorised and regulated by the Financial Services Authority Seychelles (FSA) under licence No. SD026. NAGA Capital Ltd is the principal to the CFD purchased by investors on this website. Other group entities: NAGA Markets Europe LTD which is authorised and regulated by the Cyprus Securities and Exchange Commission (CySEC) under licence No. 204/13.

RISK WARNING: Derivatives are complex instruments and come with a high risk of losing money rapidly due to leverage. You should consider whether you understand how derivatives work and whether you can afford to take the high risk of losing your money. The value of financial products can increase as well as decrease over time, depending on the value of the underlying securities and market conditions. Illustrations, forecasts or hypothetical data are not guaranteed and are provided for illustrative purposes only. JME Financial Services (Pty) Ltd does not render advice in respect of the CFD’s offered on this website. Before making an investment decision, you should rely on your own assessment. The Company’s disclaimer, conflict of interest policy are available on legal documents section.