1. Home
  2. Markets Updates
  3. Euro-Dollar Stuck in Sideways Channel, Eyes 1.1850 or 1.141

Euro-Dollar Stuck in Sideways Channel, Eyes 1.1850 or 1.141

The euro-dollar rally stalls as EUR/USD trades sideways near mid-range. Discover critical support, resistance, and market catalysts shaping the pair’s next breakout opportunity.

4 September 2025

Share the article:

EURUSD_ProDaily_04_sept.png


Past performance is not indicative of future results. All historical data, including but not limited to returns, volatility, and other performance metrics, should not be construed as a guarantee of future performance.

EURUSD on a daily timeframe 
 

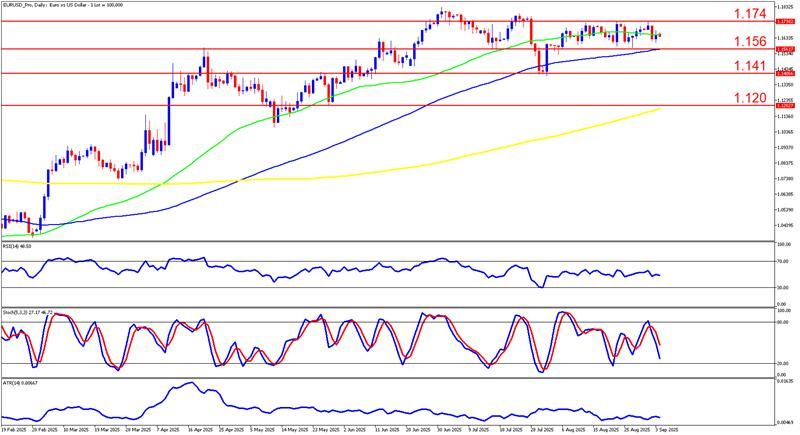
EURUSD on the daily timeframe shows that the pair has been in an extended uptrend since February 2025, with price climbing from the 1.08 region to highs above 1.18 in late June. The move was marked by strong bullish momentum, with higher highs and higher lows dominating until mid-July. However, since then the price has entered a consolidation phase, forming a sideways structure between the 1.156 and 1.174 levels. 
 

In the most recent sessions, EURUSD has traded tightly within this consolidation band, with candles showing smaller bodies compared to the impulsive moves of earlier months. Attempts to break above 1.174 have been repeatedly rejected, while the downside has been cushioned by support at 1.156, which has held multiple times. Price currently sits closer to the midpoint of the consolidation, lacking directional conviction. 
 

Indicators reflect this neutrality. The RSI is hovering around 48, showing equilibrium and the absence of momentum bias. Stochastics recently turned lower from overbought territory, suggesting short-term selling pressure. Moving averages remain supportive of the longer-term uptrend, with the 50-day above the 100-day and both well above the 200-day, but price is now pressing on the 100-day line. ATR continues to trend low, signaling suppressed volatility and a range-bound market. 
 

The main scenario favors continued consolidation between 1.156 and 1.174 in the near term, as the market awaits a catalyst. A sustained break above 1.174 would likely trigger a fresh bullish leg, targeting the 1.1850–1.19 region, supported by the broader uptrend structure and moving average alignment.
 

Alternatively, if sellers manage to force a close below 1.156, a deeper retracement toward 1.141 could unfold, with the 200-day moving average near 1.120 acting as the ultimate downside target. This bearish scenario would gain traction if indicators continue to weaken and if the RSI breaks below the 40 threshold.
 

Over the past week, the euro area has shown signs of improved activity, with its composite PMI rising to 51.1—the strongest pace since May 2024—driven by resurgent domestic demand and new orders. Inflation edged higher in August, with headline HICP at 2.1 % and core inflation steady at 2.3 %, reinforcing expectations that the ECB will hold its key rate at 2 % in the weeks ahead. ECB board member Isabel Schnabel echoed this view, indicating that the current policy stance remains appropriate absent any deterioration in inflation expectations. Meanwhile in the U.S., the July ISM Services PMI softened to 50.1, suggesting a cool in the services sector. Looking forward, the September 11 ECB rate decision and upcoming U.S. labor market and ISM services data—including jobless claims and ADP figures—represent key potential catalysts for the EUR/USD pair. 


SUMMARY:

  • Strong Uptrend Paused: EUR/USD rallies from 1.08 to 1.18, now stuck in 1.156–1.174 range. 
  • Neutral Technicals: RSI ~48, low ATR, moving averages still bullish — momentum on hold. 
  • Key Levels to Watch: Break 1.174 → 1.185–1.19; drop below 1.156 → 1.141, 200-day MA at 1.120. 
  • Catalysts Ahead: ECB stance steady, Euro PMI up; upcoming U.S. labor & ISM data could move the pair. 
IMPORTANT NOTICE: Any news, opinions, research, analyses, prices or other information contained in this article are provided as general market commentary and do not constitute investment advice. The market commentary has not been prepared in accordance with legal requirements designed to promote the independence of investment research, and therefore, it is not subject to any prohibition on dealing ahead of dissemination. Past performance is not an indication of possible future performance. Any action you take upon the information in this article is strictly at your own risk, and we will not be liable for any losses and damages in connection with the use of this article.
RISK WARNING: CFDs are complex instruments and come with a high risk of losing money rapidly due to leverage. A high percentage of retail client investors lose money when trading CFDs with this provider. You should consider whether you understand how CFDs work and whether you can afford to take the high risk of losing your money.

Related articles

USDJPY Pinned at 146.80 as Breakout Tension Builds
28 August 2025
USDJPY consolidates around 146.80 with traders eyeing 146.00 support and 150.90 resistance. Daily chart outlook and market drivers explained.

Read more

EURUSD Consolidates After Strong May-July Rally
21 August 2025
EURUSD trades in a narrow range following a bullish run, showing indecision between 1.1600 and 1.1800. Technical indicators point to potential momentum shifts in the coming sessions.

Read more

EUR/USD Poised for 1.18 Breakout—MAs Signal Bullish Continuation
14 August 2025
EUR/USD holds above key moving averages as bulls test 1.1800 resistance. Technicals suggest potential breakout if macro data favors the euro.

Read more

Need Help? Visit our Help Section
Download NAGA Trader

Copyright © 2025 – All rights reserved.

NAGA is a trademark of The NAGA Group AG, a German based FinTech company publicly listed on the Frankfurt Stock Exchange | WKN: A161NR | ISIN: DE000A161NR7.

The website is operated by JME Financial Services (Pty) Ltd an authorised Financial Services Provider, regulated by the Financial Sector Conduct Authority in South Africa under license no. 37166. JME Financial Services (Pty) Ltd is located at Suite 10, 21 Lighthouse Rd 201 Beacon Rock, Umhlanga Rocks, Kwa-Zulu Natal, 4320, South Africa.

JME Financial Services (Pty) Ltd acts as an intermediary between the investor and NAGA Capital Ltd, the counterparty to the contract for difference purchased by the Investor via Naga.com/za. NAGA Capital Ltd is authorised and regulated by the Financial Services Authority Seychelles (FSA) under licence No. SD026. NAGA Capital Ltd is the principal to the CFD purchased by investors on this website. Other group entities: NAGA Markets Europe LTD which is authorised and regulated by the Cyprus Securities and Exchange Commission (CySEC) under licence No. 204/13.

RISK WARNING: Derivatives are complex instruments and come with a high risk of losing money rapidly due to leverage. You should consider whether you understand how derivatives work and whether you can afford to take the high risk of losing your money. The value of financial products can increase as well as decrease over time, depending on the value of the underlying securities and market conditions. Illustrations, forecasts or hypothetical data are not guaranteed and are provided for illustrative purposes only. JME Financial Services (Pty) Ltd does not render advice in respect of the CFD’s offered on this website. Before making an investment decision, you should rely on your own assessment. The Company’s disclaimer, conflict of interest policy are available on legal documents section.