



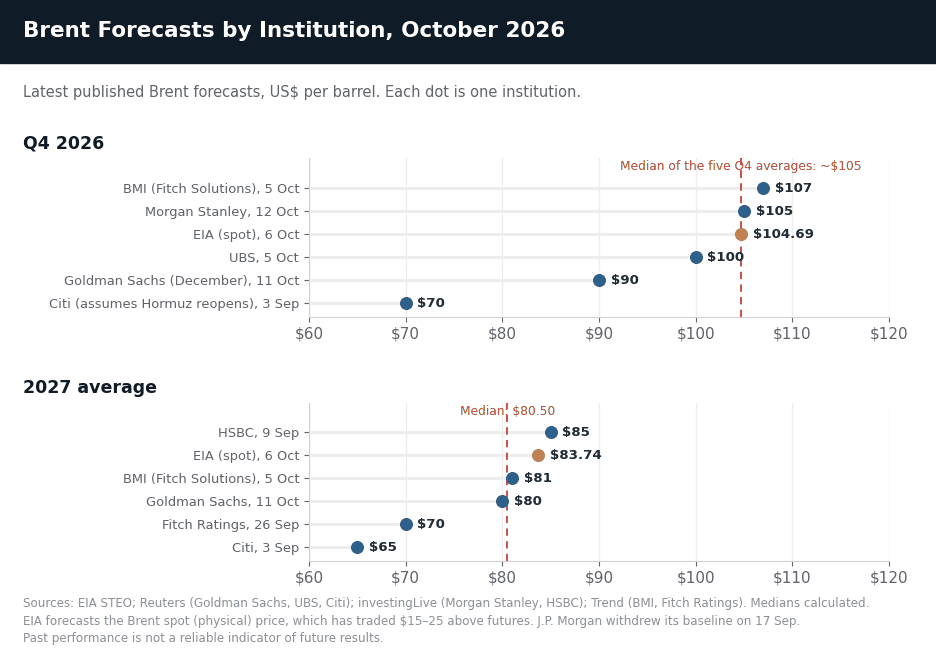
Updated October 19, 2026. Will oil prices go down? Not quickly, according to most forecasters. The EIA expects the Brent spot price to average about $105 a barrel in Q4 2026 and $83.74 in 2027, and the median of five Q4 forecasts from banks and agencies published since August, including the EIA’s, is about $105; for 2027 the median is $80.50. Most expect prices to ease next year as Gulf output recovers and the market swings into surplus, but only if attacks on tankers in the Strait of Hormuz fade.
Brent crude futures settled at $109.86 a barrel on October 16 — their highest close since May and about 80% above the end of 2025 — while West Texas Intermediate (WTI) settled at $101.41. Physical oil is tighter still: the EIA’s Brent spot price, which tracks cargoes rather than futures, was $126.55 on October 14. The Strait of Hormuz, which carried about a fifth of the world’s oil before the war, is open but under fire: tanker transits recovered to more than half of pre-war levels in September, then attacks on tankers surged in October.
Most forecasters still expect lower prices in 2027, when Gulf production should be back and the IEA sees the market in surplus. Getting there depends on the war. The EIA assumes Middle East flows stay constrained through the end of 2026, J.P. Morgan stopped publishing a baseline forecast in September, and escalation scenarios from banks and the IMF reach $120–150 a barrel.
“The market appears to be showing signs of fatigue following the strong moves associated with geopolitical tensions,” says Frank Walbaum, Market Analyst at NAGA and a former hedge fund manager, in his Q4 2026 Market Outlook. He also expects the winter heating season to add another source of volatility this quarter.
Oil Forecast & Price Predictions – Summary
- Oil price prediction for Q4 2026: Elevated and volatile. Forecasts published since early October cluster at $100–107 a barrel for Brent in Q4 — the EIA about $105 (spot price), Morgan Stanley $105, BMI $107 and UBS $100 — while Goldman Sachs sees $90 by December. Citi’s $70 is the outlier and assumes Hormuz reopens this quarter.
- FORECASTERS’ BASE CASE – gradual normalisation: Brent about $100–107 in Q4, $80–84 in 2027 – Gulf flows stay constrained through year-end and recover through the first half of 2027. This is the path behind the EIA, Morgan Stanley, UBS and BMI forecasts; the median 2027 forecast is $80.50.
- ESCALATION SCENARIOS: Brent $120–150 – Attacks shut the strait again or hit more infrastructure. Goldman Sachs estimates a 2027 average of about $125 if Gulf output stays 5 mb/d below pre-war levels; the IMF’s adverse case is $130 (an average of Brent, Dubai and WTI), HSBC’s stalemate case about $120, and Barclays said in July that Brent could test $150 if the Hormuz impasse lasted three more months.
- DEAL SCENARIOS: Brent $55–70 – A durable US–Iran agreement reopens Hormuz and the market swings into the surplus the IEA expects for 2027. Citi sees $70 in Q4 and $65 in 2027 on this assumption; Fitch Ratings sees $55 if a durable peace deal is reached in Q1 2027.
- Oil price prediction 2027: Lower, but not back to pre-war levels. The EIA expects Brent to average $83.74 (WTI $79.74), falling to $73.94 by Q4 2027 as Gulf output returns and inventories rebuild. Six bank and agency forecasts published since August range from $65 (Citi) to $85 (HSBC), with a median of $80.50, and the futures market priced December 2027 Brent at $85.08 on October 15.
- Oil price predictions for the next 5 years (2030): Most long-term views sit at $55–75 a barrel. Fitch Ratings uses $60 from 2028, HSBC $75 and Moody’s a medium-term range of $55–75. The EIA’s long-term outlook (April 2026) sees Brent below $70 in real terms through 2030, and the futures curve priced December 2030 Brent at $69.16 on October 15. OPEC, by contrast, expects demand to keep growing to 113.3 mb/d by 2030.
Key dates for oil in the next four weeks
Date
Event
Why it matters for oil
Every Wednesday
EIA Weekly Petroleum Status Report
US crude, gasoline and distillate stocks, the most-watched weekly data for WTI
October 28
US Federal Reserve decision
Another rate hike would support the dollar, a headwind for oil
Late October
Reuters monthly oil price poll
Updated analyst consensus for 2026 and 2027
November 3
US midterm elections
President Trump has said the US will not attack Iran before the vote
November 10
EIA Short-Term Energy Outlook
Next update of the EIA’s Brent and WTI forecasts
Mid-November
OPEC and IEA monthly oil market reports
New estimates for demand, supply and inventories
With NAGA.com, you can trade US Oil Spot and UK Oil Spot through cash CFDs if you want to speculate on price movements.
Crude Oil Forecast 2026 – Fundamental Analysis
Oil is the asset most directly exposed to the Strait of Hormuz conflict. Since the ceasefire collapsed in July, the market has swung between signs that supply is adapting — Gulf crude exports, including bypass routes, recovered to more than 75% of pre-war levels in September — and fresh attacks on tankers and pipelines that keep inventories falling. Here is where supply, demand and stocks stand in October 2026.
Strait of Hormuz: Flows Recover, Attacks Return
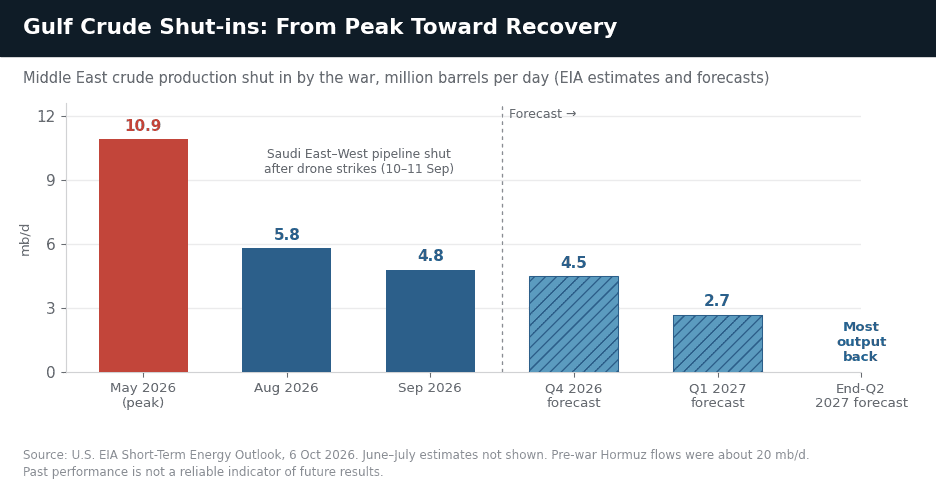
Before the war, about 20 million barrels per day (mb/d) of oil — roughly a fifth of world supply — passed through the Strait of Hormuz. Flows averaged just 2.7 mb/d from March to May (IEA), and Gulf producers shut in 10.9 mb/d of crude at the May peak (EIA). Since then supply has adapted: Saudi Arabia and the UAE have rerouted exports through bypass pipelines, US-escorted convoys have resumed, and total Hormuz flows recovered to 10.9 mb/d in September, with Gulf crude exports, including bypass routes, above 75% of pre-war levels (IEA). The EIA estimates Gulf shut-ins fell to 4.8 mb/d in September.
Past performance is not a reliable indicator of future results. All historical data, including but not limited to returns, volatility, and other performance metrics, should not be construed as a guarantee of future performance.
The recovery is fragile. Drone strikes shut Saudi Arabia’s East–West pipeline, which carries 4–5 mb/d, on September 10–11, and attacks on tankers surged in October: Kpler counted 11 tankers struck between September 28 and October 5, and UKMTO logged 15 attacks between October 6 and 14. Daily Hormuz flows fell from about 20.8 million barrels on October 8 to 2.9 million on October 11 (Kpler). The EIA assumes flows stay constrained through Q4 2026, with shut-ins of 4.5 mb/d, and that most Gulf production returns by the end of Q2 2027. “Renewed attacks in the Gulf leave the recovery fragile,” the IEA said on October 14.
Oil Inventories: Draws Slow, Rebuilding Starts in 2027
Global inventories have fallen throughout the war. The EIA estimates global stocks fell by 3.55 mb/d in Q2 2026 and 1.87 mb/d in Q3, and expects a smaller draw of 0.69 mb/d in Q4 before stocks rebuild at an average of 4.9 mb/d in 2027 as Gulf output returns. The IEA puts global observed stocks 509 million barrels below their pre-war level.
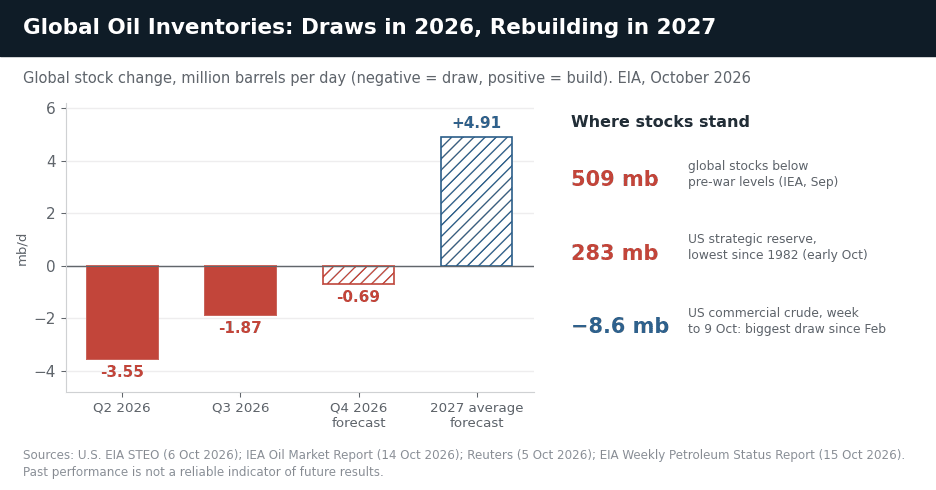
Past performance is not a reliable indicator of future results. All historical data, including but not limited to returns, volatility, and other performance metrics, should not be construed as a guarantee of future performance.
Emergency stocks are running low. IEA members agreed the largest coordinated release in the agency’s history — 400 million barrels — on March 11, and agreed on October 15 to speed up deliveries, including more than 20 million barrels of diesel. The US Strategic Petroleum Reserve has fallen to 283 million barrels, its lowest since 1982, and US commercial crude stocks fell 8.6 million barrels in the week to October 9, the biggest weekly draw since February. In a blog accompanying the October World Economic Outlook, IMF Chief Economist Silvana Tenreyro warned that “dwindling energy inventories could allow geopolitical shocks to transmit even more forcefully to energy prices.”
Global Oil Production Forecast
Outside the Middle East, supply has kept growing. The IEA expects world supply to fall by 5.8 mb/d to 100.7 mb/d in 2026 because of the Gulf losses, then rebound by 7.7 mb/d in 2027 — more than demand, which it sees recovering by 2 mb/d. That would turn this year’s deficit into a surplus of about 4 mb/d next year (calculated from IEA figures). Producers in the Americas — the US, Brazil, Canada, Guyana and Argentina — have led non-Gulf growth, shipping more crude to Asian buyers cut off from the Gulf.
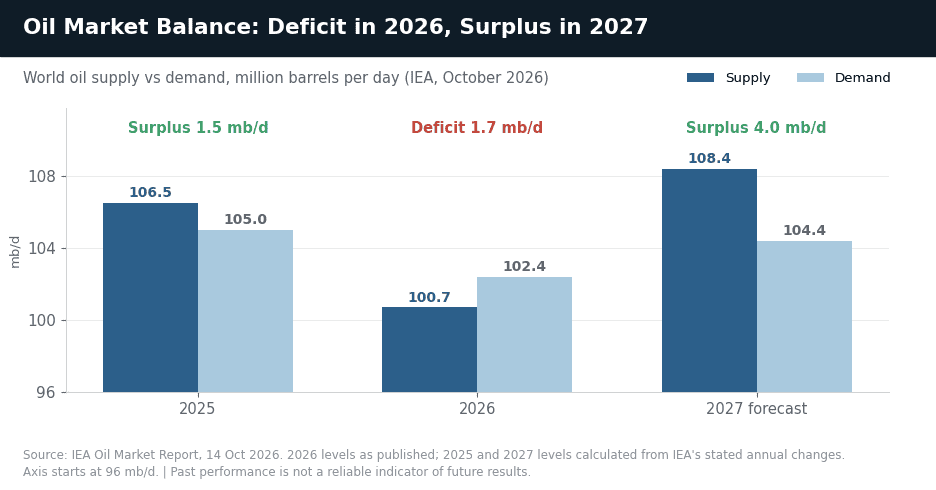
Past performance is not a reliable indicator of future results. All historical data, including but not limited to returns, volatility, and other performance metrics, should not be construed as a guarantee of future performance.
The EIA forecasts US crude oil production at a record 13.87 mb/d in 2026, rising to 14.30 mb/d in 2027, after 13.66 mb/d in 2025. OPEC+ completed the reversal of its 1.65 mb/d production cut in September and kept its November targets unchanged on October 4. The UAE left OPEC and OPEC+ on May 1, 2026; the EIA estimated in May that OPEC spare capacity would be just 2.5 mb/d in 2027, against 3.8 mb/d forecast before the exit, which limits the group’s ability to cushion another supply shock.
Global Oil Consumption Forecast
High prices and supply losses have cut demand. The IEA now expects world oil demand to fall by 2.6 mb/d in 2026, to 102.4 mb/d, and to recover by 2 mb/d in 2027, still about 0.6 mb/d below 2025. OPEC is more optimistic, forecasting growth of 0.2 mb/d this year and 2.6 mb/d in 2027, helped by restocking. Asia, the region most dependent on Gulf crude, has been hit hardest: China imported 9.03 mb/d of crude in September, 21.5% less than a year earlier, and drew heavily on its stocks.
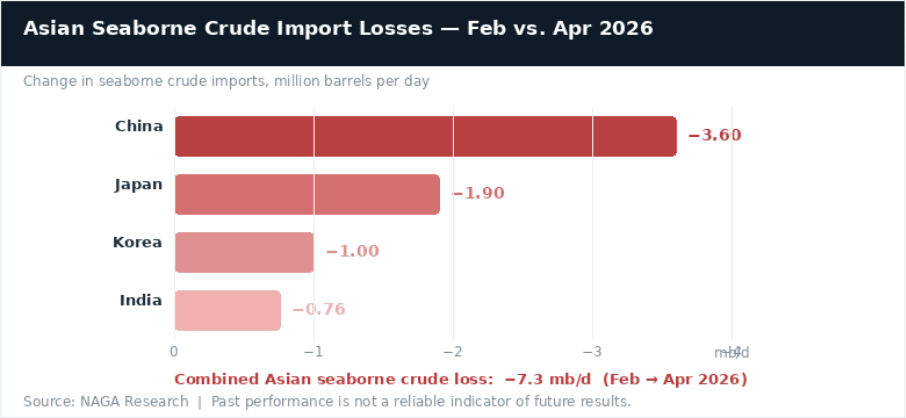
Past performance is not a reliable indicator of future results. All historical data, including but not limited to returns, volatility, and other performance metrics, should not be construed as a guarantee of future performance.
The EIA’s October outlook puts world consumption at 102.43 mb/d in 2026, rising to 104.64 mb/d in 2027. Diesel is the pinch point: diesel prices hit all-time highs of about $220 a barrel in Europe and the US in mid-September, and distillate stocks on the US East Coast, the main heating-oil market, were 32% below their five-year average in September. That leaves heating oil exposed if the winter is cold.
How to Trade and Invest in Oil
Oil Prices Forecast 2026 – Technical Analysis
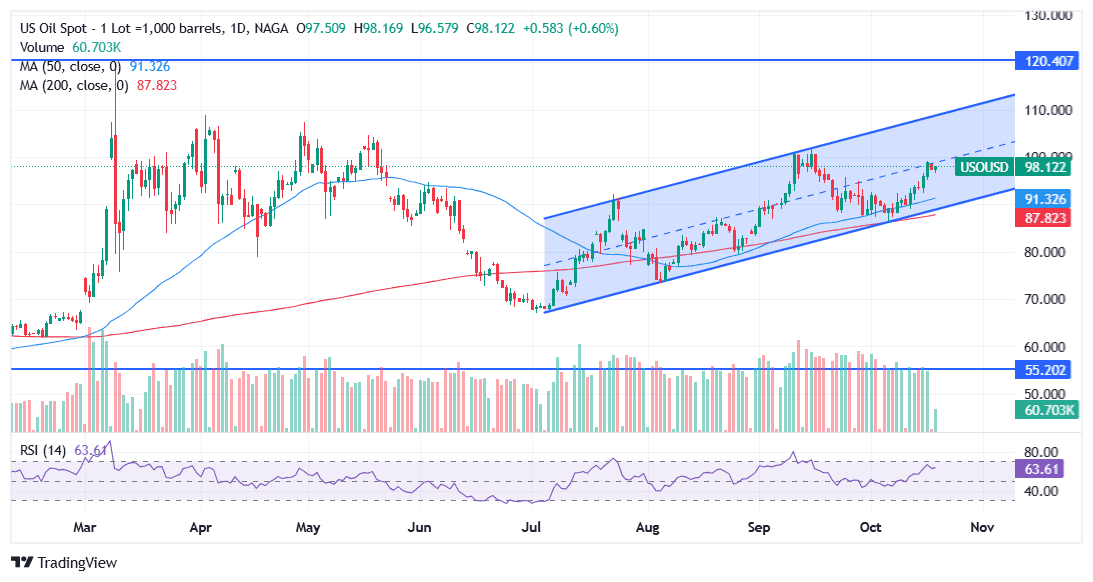
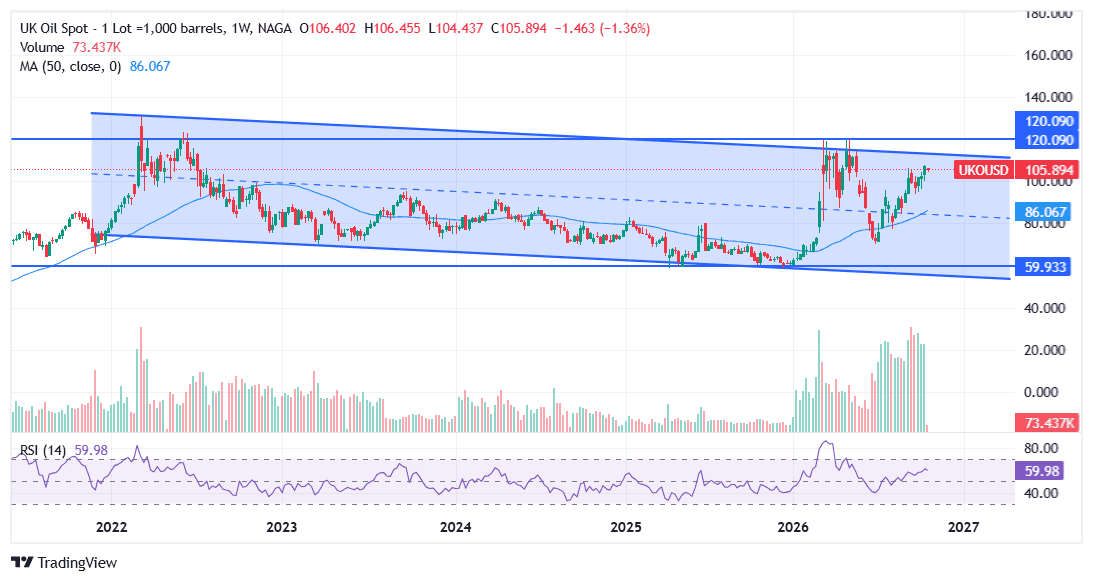
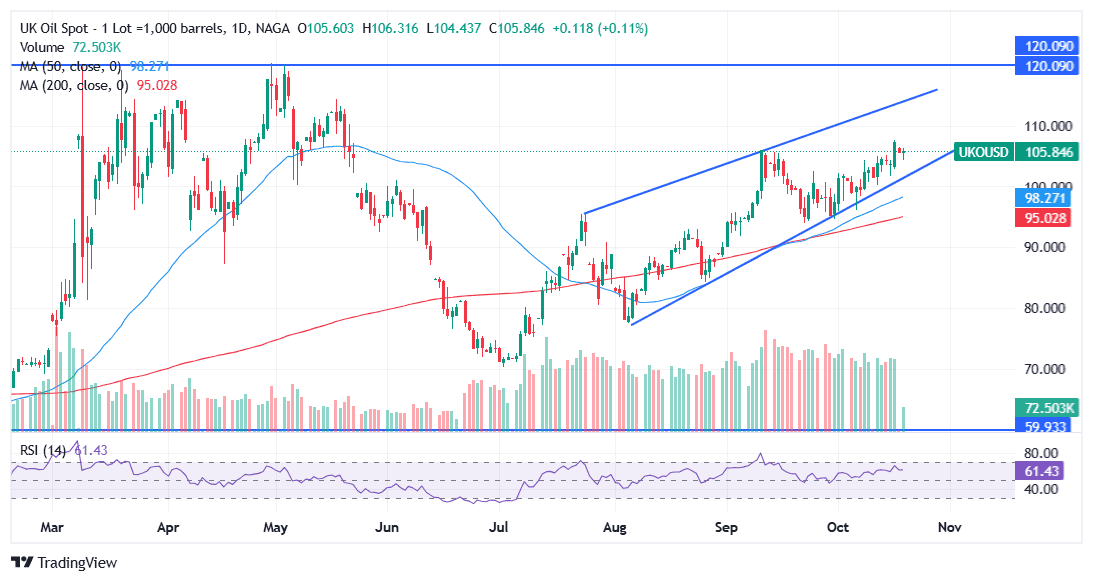
The charts below are NAGA’s UK Oil Spot and US Oil Spot charts, which track the cash prices of Brent and WTI. Cash prices run a few dollars below exchange futures: on October 16, UK Oil closed near $105.7 and US Oil near $97.5, while December Brent and November WTI futures settled at $109.86 and $101.41. On the weekly charts, both are still inside the descending channel that began at the 2022 peak. The spring spikes to about $120 broke above it only briefly, and the September and October rallies stalled below its upper line. On the daily charts, both have climbed in rising channels since their July and August lows and trade above their 50- and 200-day moving averages, with RSI readings between 59 and 64, short of overbought. The levels below are technical reference points, not price forecasts.
“The $100 level remains an important psychological and technical reference,” says Frank Walbaum in his Q4 2026 Market Outlook. On the cash charts, UK Oil is trading just above that level and US Oil just below it, so the question for the coming months is whether they can break the resistance zones that capped the September and October rallies.
WTI Crude Oil Outlook: Q4 2026 and 2027
On the weekly US Oil chart, WTI cash remains inside the descending channel that began at the 2022 peak. Its upper line is near $103.5 in mid-October and falls by about $3.5 a year, and together with the September high (about $102) it forms the key $102–104 resistance zone. Weekly closes above it would mark a break of that long-term channel and bring the $106–110 area and then the March high of $120.40 into view. The 50-week moving average ($79.77) has turned up beneath the price and, with the channel midline near $78, marks major long-term support; the 2025 low of $55.20 is the long-term floor.
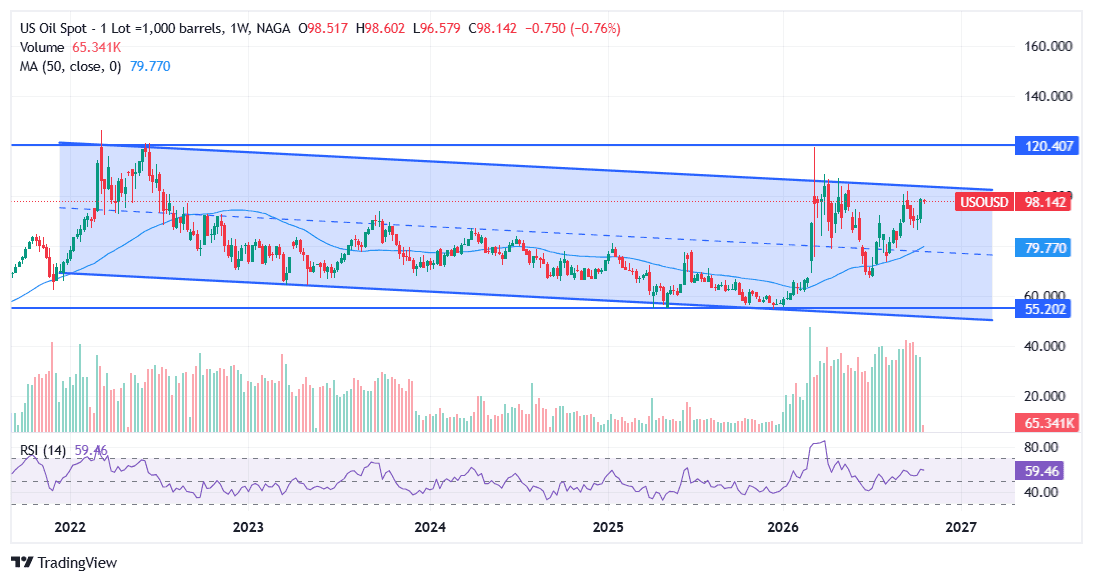
Past performance is not a reliable indicator of future results. All historical data, including but not limited to returns, volatility, and other performance metrics, should not be construed as a guarantee of future performance.
On the daily chart, US Oil has climbed in a rising channel since its early-July low near $67. The upper line is near $108, the midline near $99 — where the price paused at about $98 on October 19 — and the lower line near $88.7, rising by about $6 a month. Together with the 50-day ($91.33) and 200-day ($87.82) moving averages and the early-October low (about $86.5), that makes $87.8–91.3 the main medium-term support. Daily RSI is 64; a daily close below the channel floor would be the first sign that the rally since July is losing momentum.
Past performance is not a reliable indicator of future results. All historical data, including but not limited to returns, volatility, and other performance metrics, should not be construed as a guarantee of future performance.
Resistance levels
LEVEL (WTI) SIGNIFICANCE $120.40 March 9, 2026 high on the US Oil cash chart — the long-term ceiling $106 – $110 Upper line of the daily rising channel (about $108 in mid-October, rising about $6 a month) $102 – $104 Key pivot: the September high (about $102) and the upper line of the descending channel from 2022 (about $103.5, falling)
Support levels
LEVEL (WTI) SIGNIFICANCE $96 – $100 ⬤ Current zone: US Oil traded near $98 on October 19, just under the daily channel midline (~$99) and the $100 level $87.8 – $91.3 50-day ($91.33) and 200-day ($87.82) moving averages, the lower line of the daily channel (~$88.7) and the early-October low (~$86.5) $78 – $80 50-week moving average ($79.77) and the midline of the descending channel from 2022 (~$78) $52 – $55.20 2025 low ($55.20) and the lower line of the descending channel (~$52) — the long-term floor
Brent Crude Outlook: Q4 2026 and 2027
On the weekly UK Oil chart, Brent cash is also inside the descending channel from the 2022 peak, whose upper line is near $112.5 in mid-October and falls by about $4 a year. The spikes to $120.09 in March and late April failed at that level and fell back inside the channel. Since its early-August low near $77.5, UK Oil has climbed in a rising wedge — an upward channel whose lines are converging — with the upper line near $114 and the lower line near $102. The September and October highs (about $105.8 and $107.6) form the first resistance at $105.5–107.6; weekly closes above it would bring the $112–114 zone into view, where the tops of the long-term channel and the wedge meet.
Past performance is not a reliable indicator of future results. All historical data, including but not limited to returns, volatility, and other performance metrics, should not be construed as a guarantee of future performance.
The lower line of the wedge, near $102 on October 19, is rising by about $0.45 a day, faster than the upper line, so the range is narrowing quickly. A daily close below it, and then below $100, would put the 50-day ($98.27) and 200-day ($95.03) moving averages and the late-September lows near $94.5 in play. Daily RSI is 61. Long term, the 50-week moving average ($86.07) and the channel midline (about $84) are major support, and the 2025 low of $59.93 is the floor.
Past performance is not a reliable indicator of future results. All historical data, including but not limited to returns, volatility, and other performance metrics, should not be construed as a guarantee of future performance.
Resistance levels
LEVEL (BRENT) SIGNIFICANCE $120.09 March and late-April 2026 highs on the UK Oil cash chart — the long-term ceiling $112 – $114 Upper lines of the descending channel from 2022 (~$112.5, falling) and of the daily rising wedge (~$114, rising) $105.5 – $107.6 Key pivot: the September high (~$105.8) and the October 15–16 high (~$107.6)
Support levels
LEVEL (BRENT) SIGNIFICANCE $102 – $105 ⬤ Current zone: UK Oil traded near $105.8 on October 19, just above the lower line of the rising wedge (~$102) $94.5 – $100 $100 psychological level, the 50-day ($98.27) and 200-day ($95.03) moving averages and the late-September lows (~$94.5) $77.5 – $86 50-week moving average ($86.07), the channel midline (~$84) and the early-August low (~$77.5), where the wedge began $56 – $60 2025 low ($59.93) and the lower line of the descending channel (~$56) — the long-term floor
To learn more about technical analysis as a forecasting tool, visit NAGA Academy.
Oil Futures Curve: What the Market Prices for 2027–2030
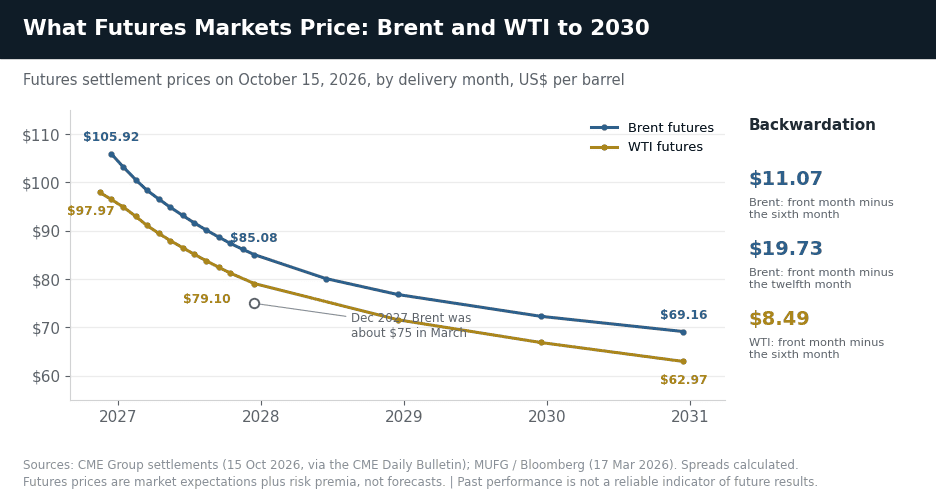
The futures curve is a useful medium-term guide. It is steeply backwardated — near-term contracts cost much more than later ones — which signals a tight market now and expected easing later. On October 15, December 2026 Brent settled at $105.92, December 2027 at $85.08 and December 2030 at $69.16, and the gap between the first and sixth Brent contracts was $11.07. WTI’s curve slopes the same way, from $97.97 for November 2026 to $62.97 for December 2030.
In 2026 the curve has also worked as an early warning. The six-month Brent spread hit a record above $37 on March 31, briefly flipped into contango (about 18 cents) on July 3, at the summer price low, and rebuilt to more than $20 by September 15, the day of the $109 peak. The back of the curve has moved up too: December 2027 Brent cost about $75 in mid-March and $85.08 on October 15. A renewed collapse of the six-month spread toward zero would be an early warning sign worth watching.
Past performance is not a reliable indicator of future results. All historical data, including but not limited to returns, volatility, and other performance metrics, should not be construed as a guarantee of future performance.
Brent vs WTI: The Two Main Oil Benchmarks
When talking about the commodity oil traded on financial markets, we can distinguish two types. The most popular and among the most traded is US Oil, also known as WTI (it settled at $101.41 on October 16, 2026). The other popular variant is UK Oil, also known as Brent (a North Sea benchmark; futures settled at $109.86 on October 16, 2026).
How to Trade and Invest in Oil
West Texas Intermediate (WTI)
Light sweet crude oil (WTI) is widely used in US refineries and is an important benchmark for oil prices, with futures back above $100 a barrel in mid-October 2026. WTI is a light oil with a high API gravity and low sulfur content. This expresses the density of the oil in relation to water. WTI oil is widely traded between oil companies and investors. Most trading is done through futures via CME Group (NYMEX). The Light Sweet Crude Oil (CL) future is one of the most traded futures worldwide and is physically delivered at Cushing, Oklahoma.
Much of the commercial storage and the delivery point for this grade is in Cushing, an important hub for Oklahoma's oil industry. Here is large storage tanks connected to pipelines that transport the oil to all regions of the United States. WTI is an important feedstock for refineries in the Midwestern United States and on the coast of the Gulf of Mexico.
Brent Crude Oil
Brent oil is an important benchmark for the petroleum rate, especially in Europe, Africa, and the Middle East. Its name is derived from the Brent oil field in the North Sea. This Royal Dutch Shell (now Shell plc) oil field was once one of Britain's most productive oil fields, and most of the platforms there have since been decommissioned.
The two benchmarks move closely together, but Brent usually trades at a premium to WTI, reflecting shipping and storage costs as well as regional supply and demand. The gap was about $2–5 a barrel through 2025, widened to more than $15 in March 2026 — the widest since 2012 — as the war hit seaborne crude hardest, and was $8.45 between the front-month contracts on October 16.
Dated Brent vs Brent Futures: Why Oil Has Two Prices
Brent futures, traded on ICE, are the price most traders and trading platforms quote. Dated Brent is the price of physical North Sea cargoes loading in the coming weeks, assessed daily by S&P Global Platts. Normally the two are within a dollar or two of each other. In 2026 they split apart: Dated Brent reached $144.42 on April 7 while futures traded near $109, and in mid-October the EIA’s Brent spot price was about $126–130, against futures of $105–110.
The gap shows how scarce prompt barrels have become while Hormuz flows are disrupted. It also matters when you compare forecasts: the EIA forecasts the Brent spot price, so its numbers are not directly comparable with futures-based bank forecasts or trading platforms. If Gulf supply normalises, the premium should shrink, as it did briefly in late June and July, when physical Brent traded slightly below futures.
Oil Price Prediction for 2026, 2027 and Beyond (2030)
Forecasts from the major agencies and banks have risen sharply since the ceasefire collapsed in July, but almost all still see lower prices in 2027. The median of five Q4 2026 Brent forecasts published since August is about $105 a barrel, and the median of six 2027 forecasts is $80.50 (calculated from the forecasts below).
The IMF’s October World Economic Outlook assumes an average oil price — Brent, Dubai and WTI combined — of $95.74 a barrel in 2026 and $87.39 in 2027, with shipping through Hormuz back to pre-war levels between March and October 2027; in its adverse scenario, prices could reach $130. Reuters’ monthly poll of 30 analysts (September 30) put the 2026 average at $89.05 for Brent and $83.90 for WTI, up from $85.08 and $80.20 a month earlier. The World Bank’s latest outlook (April) predates the ceasefire collapse; its October update is due.
Institution Key forecast Updated EIA Brent about $105 in Q4 2026 (spot), $96.32 for 2026, $83.74 for 2027; WTI $97, $88.21 and $79.74 October 6, 2026 J.P. Morgan Baseline withdrawn: “we don’t have a baseline view” (Natasha Kaneva) September 17, 2026 Morgan Stanley Brent $105 in Q4 2026, $100 in Q1 2027 October 12, 2026 UBS Brent $100 in Q4 2026; $91.57 average for 2026; upside risk $120+ October 5, 2026 Citigroup Brent $70 in Q4 2026, $65 for 2027 (assumes Hormuz reopens in Q4) September 3, 2026 HSBC Brent $90 for 2026, $85 for 2027, $75 from 2028 September 9, 2026 BMI (Fitch Solutions) Brent $107 in Q4 2026, $112 in Q1 2027; $93 for 2026, $81 for 2027 October 5, 2026 Fitch Ratings Brent $87 for 2026, $70 for 2027, $60 from 2028 September 23–26, 2026 Goldman Sachs Brent $90 in December 2026, $80 for 2027; WTI $81 and $73 October 11, 2026 IMF Average of Brent, Dubai and WTI: $95.74 for 2026, $87.39 for 2027 October 13, 2026 Reuters poll 30 analysts: Brent $89.05 and WTI $83.90 average for 2026 September 30, 2026 Median (calculated) Brent about $105 in Q4 2026 (five forecasts), $80.50 for 2027 (six forecasts) October 19, 2026 *Oil price forecasts are subject to change and reflect each institution's most recently published figures. Past performance is not a reliable indicator of future results.
Past performance is not a reliable indicator of future results. All historical data, including but not limited to returns, volatility, and other performance metrics, should not be construed as a guarantee of future performance.
EIA Oil Price Forecast: Higher for Longer (October 2026)
The US Energy Information Administration raised its forecasts again in its October Short-Term Energy Outlook (October 6). It now expects Brent to average about $105 a barrel in Q4 2026, $14 more than a month earlier, and $96.32 for 2026 as a whole, before easing to $94.90 in Q1 2027 and $73.94 by Q4 2027 — a 2027 average of $83.74. WTI is forecast at $97 in Q4 and $79.74 in 2027. In the EIA’s words, “we forecast that oil prices will remain elevated until constraints on oil flows from the Middle East resolve.” The EIA forecasts the Brent spot price, which traded $15–25 above futures in September and October. Its next outlook is due on November 10.
Goldman Sachs Oil Price Forecast (Updated October 2026)
Goldman Sachs raised its December 2026 Brent forecast to $90 a barrel from $85 on October 11, with WTI at $81, and kept its 2027 averages at $80 for Brent and $73 for WTI, Reuters reported.
Its base case assumes Gulf output ends up only about 0.3 million barrels per day below February 2026 levels as Middle East supply adapts. If Gulf output stayed 5 mb/d below February levels, Goldman estimates Brent could average about $125 in 2027; if it ended 1 mb/d above, prices would fall to the $60s.
“We maintain our base case that continued adaptation of Middle East supply will eventually reduce crude oil prices,” Daan Struyven and his team wrote in a note reported on October 19.
Fitch Ratings and BMI Oil Price Forecasts (September–October 2026)
In late September Fitch Ratings kept its 2026 Brent assumption at $87 a barrel and raised 2027 to $70 from $65, with $60 from 2028. Fitch sees the current transit of about 10 mb/d through Hormuz, using oil shuttling, as sustainable even without a deal, and expects prices to fall to $55 if a durable peace agreement is reached in Q1 2027.
BMI, the research arm of Fitch Solutions and a separate business from Fitch Ratings, is more bullish. On October 5 it raised its forecasts to $107 for Q4 2026, $112 for Q1 2027, $93 for 2026 and $81 for 2027, and no longer expects a preliminary US–Iran deal before Q1 2027. BMI expects prices to “move higher in a zigzag pattern, with recurring cycles of escalation and de-escalation.”
J.P. Morgan Oil Price Forecast: No Baseline Since September
J.P. Morgan has published no baseline oil forecast since September 17. “For the first time since the start of the Iran conflict, we don’t have a baseline view,” said Natasha Kaneva, head of global commodities strategy, adding: “We simply don’t know how to model the endgame.” The bank had cut its forecasts after the June US–Iran memorandum of understanding, to $80 for Q4 2026 and a “$60/bbl price regime” from the second half of 2027, but said the economic red lines it had assumed — $100 crude, gasoline near $5 a gallon and a 5% 10-year Treasury yield — had since been crossed.
Morgan Stanley Oil Price Forecast (Updated October 2026)
Morgan Stanley raised its Brent forecast for Q4 2026 to $105 a barrel from $100, and for Q1 2027 to $100 from $95, in a note dated October 12. The bank says Persian Gulf exports are back within 10% of pre-war levels, but costly freight favours short-haul crude such as Brent, and it points to steep falls in oil on the water and in onshore inventories, including in China. The main risk to its view is a durable normalisation in Hormuz, which would remove that Brent-specific support.
HSBC Oil Price Forecast 2026–2028 (Updated September 2026)
HSBC raised its forecasts on September 9 to $90 a barrel for 2026 and $85 for 2027, with $75 from 2028, arguing that the market will stay tight for longer. Kim Fustier’s team estimated that Hormuz transits had settled at about 30% of pre-war levels in early September and expects them to recover only to about half by mid-2027, with no rebalancing until then; in a prolonged stalemate, Brent could rise to about $120.
UBS and Citi Oil Price Forecasts (September–October 2026)
UBS raised its Q4 2026 Brent forecast to $100 from about $80 on October 5, and its 2026 average to $91.57, after the June US–Iran memorandum of understanding broke down. “We assume a gradual normalisation of regional oil flows through the first half of 2027,” the bank said, and it puts upside risk at $120 or more. At the other end, Citi still expected Brent to fall to $70 in Q4 2026 and $65 in 2027 in its latest published forecast (September 3), because it assumes Hormuz reopens this quarter.
Algorithm-based (AI) Oil Price Forecasts
Algorithm-based forecast sites such as LongForecast, CoinCodex and WalletInvestor extrapolate recent price trends mechanically, so their numbers swing with every move in the market and can change daily. Some “oil” pages on crypto-data sites also track tokens rather than crude oil. Treat them as a sentiment gauge, not a forecast; the futures curve, which shows where traders will actually buy and sell oil for future delivery, is a more useful market-based guide (see the technical analysis section).
OPEC remains the most bullish long-term forecaster. Its World Oil Outlook 2026 (June 18) sees global demand rising to 113.3 mb/d by 2030 and about 124 mb/d by 2050, and its October report expects demand growth of 2.6 mb/d in 2027, helped by restocking. The IEA, by contrast, sees 2027 demand still below 2025 levels and a large supply surplus.
Structural shifts emerge in price drivers:
- The US–Israel–Iran war that began on February 28, 2026 remains the dominant driver. Gulf crude shut-ins peaked at 10.9 mb/d in May and were 4.8 mb/d in September (EIA), but attacks on tankers surged again in October.
- The UAE left OPEC and OPEC+ on May 1, 2026. The EIA estimated in May that OPEC spare capacity would be just 2.5 mb/d in 2027, against 3.8 mb/d forecast before the exit, limiting the group’s ability to steady prices.
- On October 16, President Trump waived new US sanctions and tariffs on Russia under the Graham Act that were due to take effect on October 18. Sanctions on Russia’s shadow fleet remain: the EU had listed 671 vessels and the UK 621 by July.
- Long-term views converge lower: Fitch Ratings uses $60 a barrel from 2028, HSBC $75 and Moody’s a medium-term range of $55–75, while the futures curve priced December 2030 Brent at $69.16 on October 15.
- OPEC+ completed the reversal of its 1.65 mb/d production cut in September and kept its November targets unchanged on October 4. “OPEC+ currently has very limited power over the physical oil market,” said Jorge Leon of Rystad Energy in September.
When looking for oil-price predictions, it's important to remember that analysts' forecasts may be wrong. This is because their projections are based on a fundamental and technical study of WTI and Brent oil commodities’ historical price movements. But past performance and forecasts are not reliable indicators of future results.
AI and algorithm-based oil price forecasts, such as those mentioned above, are generated using algorithmic and AI-based models. These models rely on historical data and assumptions, which may not capture future market conditions accurately. Outcomes may differ significantly from forecasts.
It is essential to do your research and always remember that your decision to trade depends on your attitude to risk, your expertise in the market, the spread of your investment portfolio, and how comfortable you feel about losing money. You should never invest money that you cannot afford to lose.
Oil Price History: How Prices Moved From 2020 to 2026
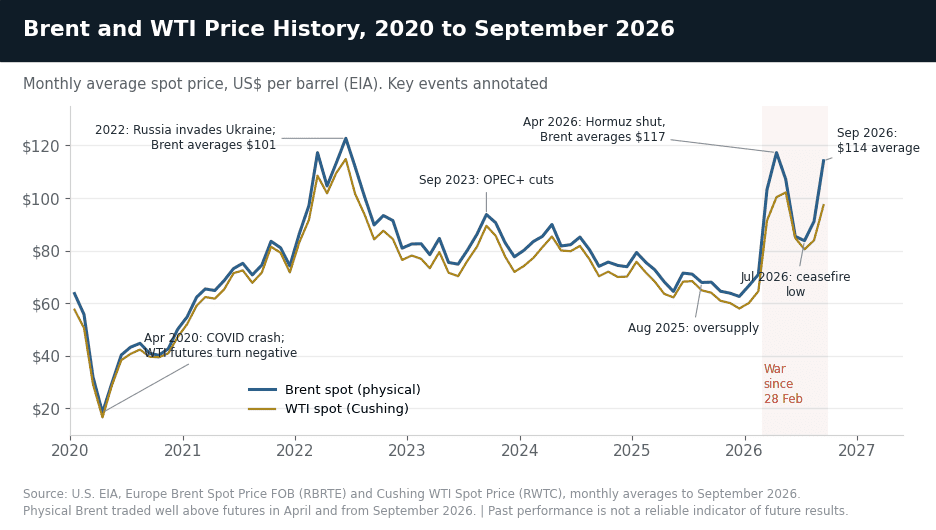
From a pandemic-era average of $42 a barrel in 2020 — including the day WTI futures turned negative — to a 2022 war-driven peak, a slide below $65 in late 2025 and the 2026 Hormuz shock, crude oil has traced one of the most dramatic price paths of any major asset this decade. In 2026, Brent futures hit $119.50 on March 9 and briefly topped $126 at the April 30 contract expiry, while physical Dated Brent reached $144.42 on April 7. Understanding that history is essential context for any forward-looking oil forecast.
Past performance is not a reliable indicator of future results. All historical data, including but not limited to returns, volatility, and other performance metrics, should not be construed as a guarantee of future performance.
2020: COVID Crash & Black Monday
Brent averaged just $42/bbl in 2020 — the lowest annual average since 2004. On March 9, the Saudi–Russia price war erupted simultaneously with COVID-19 demand collapse: Brent fell 24% to settle at $34.36, after trading as low as $31.02, in its biggest one-day fall since the 1991 Gulf War as Riyadh announced steep discounts and ramped production toward 12.3 mb/d. Prices bottomed near $16/bbl in April. On April 20, WTI futures for May delivery fell to –$37.63/bbl — the first negative oil price in history — as storage at Cushing, Oklahoma, neared capacity. OPEC+ agreed to historic cuts of 9.7 mb/d in April 2020, stabilising markets and setting up the recovery.
2021–2022: Recovery, Then Ukraine Shock
Brent recovered steadily through 2021, averaging $70/bbl as vaccines rolled out and demand rebounded sharply. Russia's invasion of Ukraine on February 24, 2022, drove Brent futures to $139/bbl intraday on March 7, 2022 — its highest level since 2008. Prices stayed above $100 through August before strategic reserve releases and demand destruction pulled them back to $80–95/bbl from September. Brent averaged $101/bbl for the full year 2022, the highest annual average since 2013.
2023–2024: OPEC+ Cuts vs. Non-OPEC Supply Growth
Brent averaged $82/bbl in 2023 and $80/bbl in 2024 as OPEC+ maintained deep, layered production cuts to support prices against rising non-OPEC+ supply from the US, Brazil, and Guyana. The market traded in a relatively narrow $70–$97 range across both years, with repeated OPEC+ cut extensions preventing the supply surplus from building into a full-blown bear market. US crude output reached a record 13.3 mb/d in 2024, a level beaten in 2025 (13.66 mb/d).
2025: Oversupply Returns, Brent Slides Below $70
OPEC+ began unwinding its production cuts in 2025, adding supply as non-OPEC+ output also continued to grow. Brent averaged about $72/bbl in H1 2025 before declining sharply: by August 2025, the monthly average had fallen to $67.87/bbl — down about $12/bbl from a year earlier. WTI averaged $64.86/bbl. Before the war, most forecasters expected a large supply surplus in 2026: J.P. Morgan saw Brent averaging $58, and Goldman Sachs expected $54 by Q4 2026.
January–June 2026: Hormuz Closure Shatters the Trend
Brent futures ended 2025 at $60.85, and the EIA’s Brent spot price averaged $70.89 in February as tensions with Iran built. Then, on February 28, the US–Israel–Iran war began and the Strait of Hormuz was effectively closed. Front-month Brent rose more than 60% in March, its biggest monthly gain since records began in 1988, and touched $119.50 on March 9. A ceasefire on April 7–8 knocked 13% off Brent in a day, but physical supplies stayed scarce: Dated Brent hit $144.42 on April 7, and the EIA’s Brent spot price averaged $117.29 in April. Futures settled at $118.03 on April 29, their highest close of the second quarter. After the US and Iran signed a memorandum of understanding on June 17, prices fell back to pre-war levels — about $70 for Brent futures in early July.
July–October 2026: The Truce Collapses, Brent Tops $100 Again
The relief did not last. On July 12–13 Iran declared the strait closed and the US reinstated its blockade of Iranian ports, and Brent was back above $100 by July 23. Drone strikes shut Saudi Arabia’s East–West pipeline on September 10–11, lifting Brent futures to about $109 on September 15 and the EIA’s Brent spot price to $131. Measured on NAGA platform prices from the July 1 open to the September 30 close, Brent gained 33.3% in Q3 and WTI 27.4%, according to Frank Walbaum’s Q4 2026 Market Outlook. In October, attacks on tankers in and around the strait surged, and Brent futures settled at $109.86 on October 16, their highest close since May.
Factors That May Affect the Price of Crude Oil
1. OPEC+ production decisions
Quota changes drive supply. OPEC+ finished reversing its 1.65 mb/d cut in September and froze November targets; the UAE’s exit (May 1, 2026) cuts OPEC spare capacity to 2.5 mb/d in 2027 (EIA, May estimate). OPEC meeting dates →2. US crude inventory data
Published weekly by the EIA, inventory builds signal oversupply and weigh on WTI prices; large draws signal tightness. US commercial crude stocks fell 8.6 million barrels in the week to October 9, and the Strategic Petroleum Reserve is at its lowest since 1982. Economic calendar →3. Geopolitics & Strait of Hormuz
Gulf shut-ins peaked at 10.9 mb/d in May and were 4.8 mb/d in September (EIA). The surge in tanker attacks in October showed how quickly flows, and prices, can swing. Market news →4. US Dollar value
As oil is denominated in USD, a weaker dollar stimulates demand from holders of other currencies, pushing oil prices higher. Dollar strength acts as a headwind; the Fed raised rates in September and may hike again by December. FX market outlook →
Final words
Make sure to create a free demo account on NAGA.com, which remains a useful multi-asset platform for both novice and expert traders. You will be up to date on data and market insights, and the user-friendly interface—with TradingView integration—will come in handy if you decide to trade crude oil or any other commodity.
If you look at the price changes of oil for a while now, you may see patterns, but they are driven by unpredictable forces—geopolitics, OPEC moves, and economic cycles—so as an investor, respond with care.
If you want to invest in oil, it can seem smart to get in when the price hits a bottom, but this timing approach is speculative and risky. There is no guarantee that oil prices will match past highs, and the energy transition and policy shifts still shape long‑term demand. Oil is finite and important, but it is not uniquely “the most precious”, and its role is changing as renewables and EVs expand. Investing in commodities can diversify your overall portfolio, though they are volatile and diversification does not guarantee profits or protect against losses.
Sources:
- EIA Short-Term Energy Outlook — October 6, 2026
- IEA Oil Market Report — October 14, 2026
- OPEC Monthly Oil Market Report — October 13, 2026 (Xinhua summary)
- IMF World Economic Outlook oil assumption — October 13, 2026 (TASS)
- Reuters poll: analysts raise 2026 oil forecasts — September 30, 2026
- Goldman Sachs lifts December 2026 Brent forecast to $90 — Reuters, October 11, 2026
- Morgan Stanley lifts Brent forecast to $105 — investingLive, October 13, 2026
- UBS raises 2026–27 Brent price view — Reuters, October 6, 2026
- J.P. Morgan withdraws its oil baseline — Yahoo Finance, September 22, 2026
- Fitch Ratings raises near-term oil price assumptions — September 26, 2026
- EIA Today in Energy: crude oil prices in the third quarter — October 5, 2026
- S&P Global: Dated Brent’s April high — April 16, 2026
- Al Jazeera: Hormuz attacks soar, oil flows crash again — October 14, 2026
- EIA Annual Energy Outlook — Long-Term Narrative
- Reuters Commodities Coverage
- Rigzone — Industry News & EIA Coverage
- OilPrice.com — Market Intelligence
Other resources:
- Gold forecast & price predictions 2026
- EURUSD forecast & price predictions 2026
- Dow Jones forecast & price predictions 2026
- Natural Gas forecast & price predictions 2026
- Turkish Lira forecast & price predictions 2026
- Silver forecast & price predictions 2026
- NASDAQ 100 forecast & price predictions 2026
- British Pound forecast & price predictions 2026
- USD to INR forecast & price predictions 2026
- Egyptian Pound forecast & price predictions 2026