Sterling entered 2026 with genuine momentum, trading at multi-year highs above 1.38 against the US dollar. Then came a sequence of shocks: the Strait of Hormuz conflict, US tariffs, a March selloff that took GBP/USD back toward 1.31.
The biggest wild card for sterling heading into H2 2026 is not monetary policy but politics: Prime Minister Keir Starmer's unexpected resignation in June has introduced a leadership vacuum at exactly the moment when the UK's fiscal credibility is most under scrutiny. Gilt markets and sterling both initially weakened on the news before partially stabilising, echoing — though on a smaller scale — the market reaction to Liz Truss's 2022 mini-budget episode.
How the ruling Labour Party manages the transition, and whether any successor signals a change in fiscal policy, will likely matter as much for sterling in H2 2026 as the Bank of England's July 30 rate decision.
British Pound Forecast 2026 — Key Takeaways
- Pound price prediction for the next 6 months (H2 2026): Keir Starmer's resignation creates UK political uncertainty at a sensitive moment for gilt markets and sterling. The pound weakened initially but has partially stabilised — the market's base case is a managed Labour transition rather than a snap election, but that remains to be confirmed.
- GBP/USD Forecast H2 2026 base case (1.32 – 1.41): Primarily a dollar story right now. A hawkish Fed holding above 3.75% caps the upside; a BoE that holds or hikes provides a floor. JPMorgan is the most cautious at 1.28 by December; Goldman sits at 1.36; Morgan Stanley's 1.47 bull case needs Fed cuts to materialise.
- EUR/GBP Forecast H2 2026 base case (0.8550–0.8850): The BoE–ECB gap has narrowed to 150bp after the ECB's June hike to 2.25%, reducing sterling's structural yield advantage. A further ECB hike in July or September — without a matching BoE move — would push GBP/EUR toward 1.13. UK political instability is an additional headwind specific to this pair.
- GBP/JPY Forecast H2 2026 base case (¥192 – ¥205): The Iran ceasefire fully collapses, oil re-spikes, and the Fed delivers one or two actual rate hikes before year-end that the ECB cannot match given the eurozone's fragile 0.8% GDP growth. EUR/USD breaks below the critical 1.1400 support (the 23.6% Fibonacci retracement of the 2022–2026 rally) and extends toward 1.10 or lower as the dollar re-establishes a yield advantage above 150bp.
Note: These are illustrative scenarios only, not price targets or investment recommendations. Actual outcomes may differ materially.
- Pound Forecast 2027: Most models expect GBP/USD to consolidate in the 1.28–1.38 range through 2027, with direction dependent on whether the Fed finds room to cut while the BoE holds or hikes. AI-based forecasts project GBP/USD near 1.26–1.28 by end-2026 before recovering to 1.33+ in 2027.
- Pound 5-Year Forecast (2027–2030+): Structural long-term forecasts are broadly constructive on sterling against the dollar, with the pound expected to remain above 1.30 through 2028–2030 in most institutional and algorithmic frameworks, though UK fiscal sustainability and the BOE's policy credibility remain key risks.
Trade GBP pairs with NAGA: GBP/USD, GBP/EUR, GBP/JPY and more — CFDs with tight spreads on the NAGA platform.
British Pound Fundamental Analysis 2026
Sterling's fundamentals in mid-2026 present a classic "good yield, uncertain growth" profile: the UK's 3.75% Bank Rate is the highest of the G7 central banks after the Fed, gilt yields sit 35–45bp above equivalent US Treasuries, and services exports (particularly financial services) remain robust. But against this structural support sits a slowing economy, sticky services inflation that prevents easing, a large current account deficit, and a political leadership vacuum.
Growth, Inflation, and Fiscal
The UK economy grew 0.7% in Q1 2026 (year-on-year basis), supported by resilient services output but constrained by weak manufacturing and consumer spending under the weight of elevated borrowing costs. The Office for Budget Responsibility's 2026 growth forecast sits at approximately 1.0–1.2%, modest but positive.
The more concerning domestic picture is the fiscal side: UK public sector net borrowing remains elevated (the OBR projects borrowing above £80bn in 2026–27), gilt yields are trading around 4.75% on 10-year bonds, and the Autumn 2025 budget's tax increases have yet to fully feed through into either growth or revenues. Prime Minister Starmer's resignation adds a new variable: the fiscal policy stance of a potential successor — and whether any Labour leadership contest produces a candidate associated with meaningfully different spending plans — is now a live market risk for sterling and gilts.
The Interest Dynamics
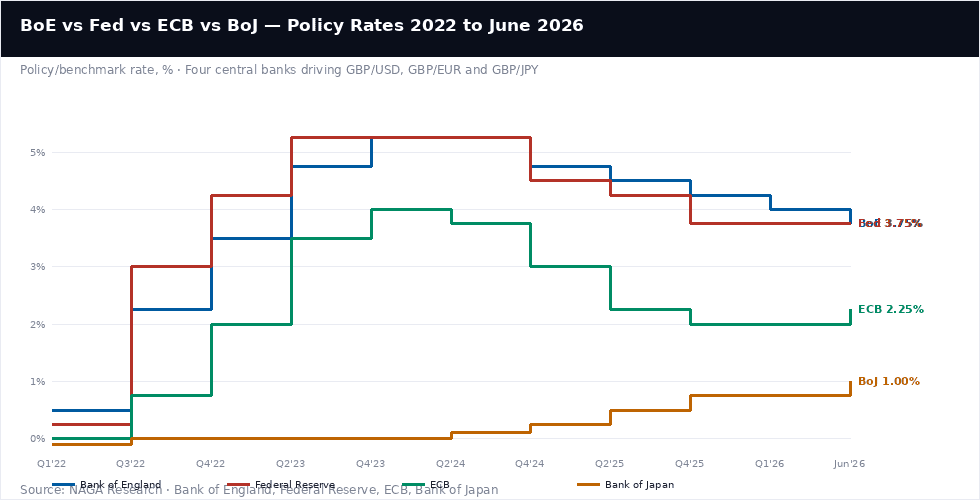
The Bank of England hiked aggressively in 2022–23 (reaching 5.25%), held there longer than the ECB or Fed, and has been cutting more cautiously than either — leaving Bank Rate at 3.75% versus the Fed's equivalent 3.50–3.75% and the ECB's 2.25%. This configuration gives sterling a yield advantage against the euro (150bp) and a massive advantage against the yen (275bp+), while essentially matching the dollar. The BoJ's slow but steady normalisation journey — from -0.10% in 2022 to 1.00% in June 2026 — is the most structurally significant long-term trend in the c, as it is gradually compressing the GBP/JPY carry trade that has driven the pair to historically elevated levels.
Yield Convergence with the US Dollar
UK 10-year gilt yields at 4.75% sit 35–45bp above equivalent US Treasuries, creating genuine structural demand for sterling-denominated assets from pension funds, insurance companies, and sovereign wealth funds that must buy pounds to access those yields. This background demand has been one reason GBP/USD has held up better than EUR/USD despite both facing the same hawkish Fed headwind.
The path for GBP/USD through H2 depends primarily on whether the Fed's hike projection actually materialises: if US inflation cools through summer and the projected hike is removed, GBP/USD should recover back toward 1.36–1.38; if a hike occurs, 1.28–1.30 becomes the relevant range.
A Shrinking Yield Advantage against the Euro
Pound entered 2026 with a structural yield advantage of approximately 225bp against the Euro (BoE at 4.25% vs ECB at 2.0%), which mechanically supported sterling. That gap has now narrowed to 150bp following both the BoE's cuts through 2025 and the ECB's surprise June hike to 2.25%. The pair at 0.86–0.87 broadly reflects this intermediate state. If the ECB delivers a further 25bp hike in July or September without a matching BoE move, the spread compresses further toward 100–125bp — historically consistent with the Pound-to-Euro rate in the 0.88–0.89 range.
Conversely, if the BoE surprises with a hike at its July 30 meeting (as the two dissenting MPC members would prefer), the spread widens, and the pair would likely push back toward 0.85. UK political instability is an additional currency-specific risk for EUR/GBP, as markets have historically priced political uncertainty into sterling more than into the euro.
The Carry Trade Under Pressure
GBP/JPY at around ¥215 remains well above its 10-year average, reflecting the extraordinary rate differential between the Bank of England (3.75%) and the Bank of Japan (1.00%+). This 275bp gap has attracted substantial carry trade positioning — borrowing cheaply in yen and investing in sterling — which mechanically keeps the pair elevated if the differential persists. The risk, as the August 2024 yen flash crash illustrated, is that carry trades unwind violently and quickly when sentiment shifts.
Each BoJ rate hike compresses the differential further, and with Japan's spring 2026 wage negotiations delivering 5% gains for the third consecutive year, the BoJ has the economic foundation to continue its normalisation journey. GBP/JPY is likely to remain volatile and range-bound at historically elevated levels in H2 2026, rather than trending decisively in either direction.
BANK OF ENGLAND
3.75%
Held Jun 18 — 7-2 vote, two members wanted a hike
UK CPI held at 2.8% in May, but services inflation rose to 3.7%, keeping the MPC cautious. Chief Economist Huw Pill voted to hike. A July 30 cut is possible but finely balanced. Six cuts delivered in 2024–25 from 5.25%; market now prices roughly one more cut for all of 2026.FEDERAL RESERVE
3.50–3.75%
Held Jun 17 — dot plot flipped from cut to hike
US CPI at 4.2% YoY in May (highest since Apr 2023). Nine of eighteen FOMC members project a 2026 hike; median dot-plot year-end target 3.8%. Next decision July 29. The Fed's hawkish pivot is the single biggest near-term headwind for GBP/USD.EUROPEAN CENTRAL BANK
2.25%
Hiked Jun 11 — first hike since 2023
Eurozone CPI 3.2% in May (core 2.5%). The ECB's surprise hike narrows the BoE–ECB gap to 150bp, the tightest since 2022 — directly reducing sterling's structural yield premium against the euro. Next ECB decision July 23.BANK OF JAPAN
~1.00%
Hiked again in Jun 2026 — slow normalisation
Japan's spring 2026 wage negotiations delivered ~5% average pay increases (third consecutive year). GDP recovering, unemployment near multi-decade lows. BoJ's ongoing normalisation is gradually unwinding the carry trade that has kept GBP/JPY above ¥200. Next BoJ meeting: late July.
British Pound Technical Analysis
Sterling's technical picture varies significantly across the three major pairs.
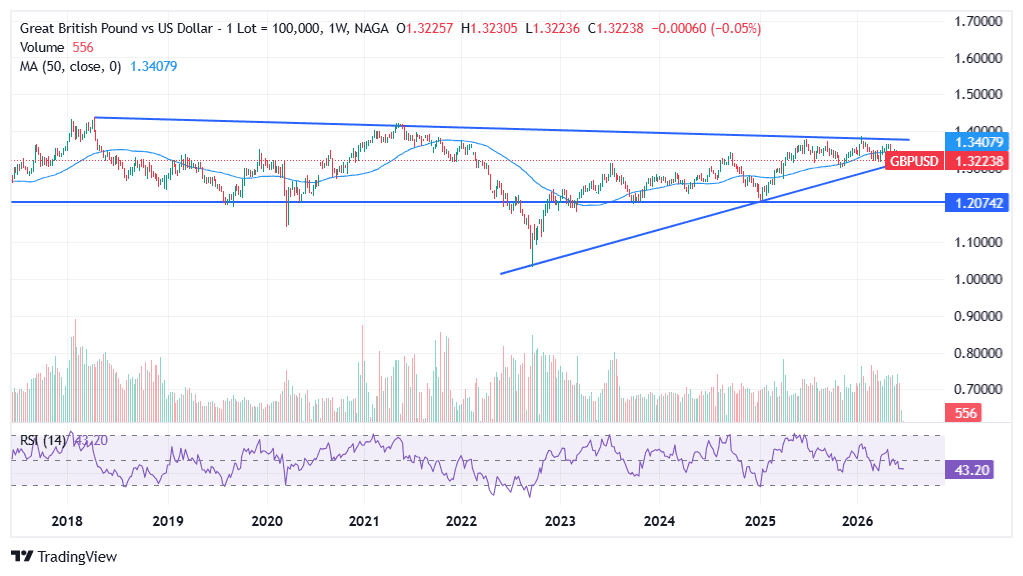
GBP/USD — Holding Above Key Support After a Double Test
GBP/USD formed its 2026 high near 1.3850 in late January, then sold off to approximately 1.31 in the March tariff shock before recovering to the mid-1.34s in May. The pair has since pulled back again to the 1.3235–1.34 zone following the Fed's hawkish June 17 signal and the Starmer political shock.
Technically, 1.3000–1.3170 has served as a double-tested major support zone across the previous lows. A confirmed weekly close below this zone would be the most bearish technical development for Cable since the 2022 mini-budget, indicating a reversal of the uptrend started in 2023.
On the upside, 1.36-1.37 is the first meaningful resistance (the Goldman Sachs target), with the year's high at 1.3850 the key level any sustained bull run would need to reclaim.
Past performance is not a reliable indicator of future results. All historical data, including but not limited to returns, volatility, and other performance metrics, should not be construed as a guarantee of future performance.
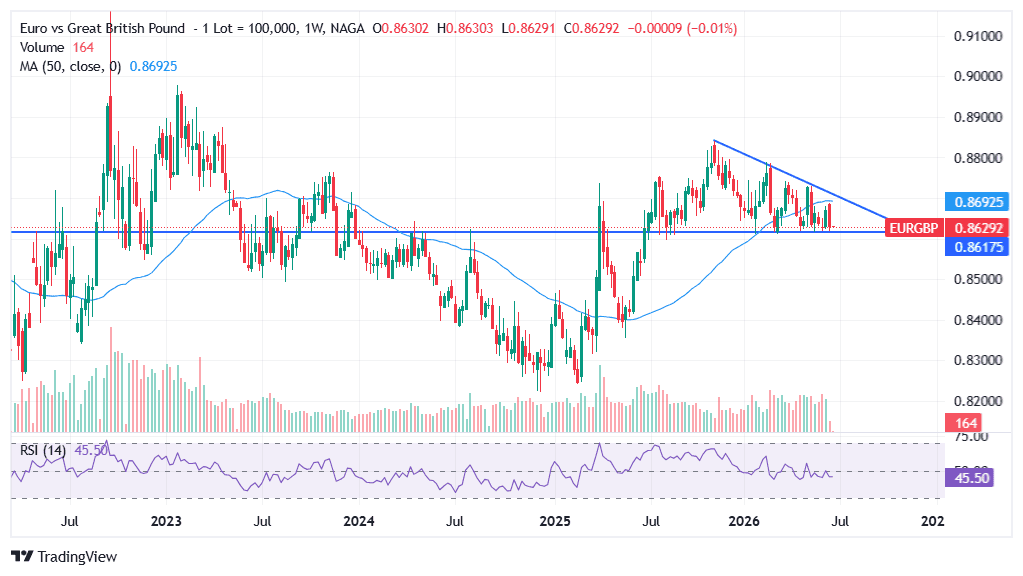
EUR/GBP — Trending Narrower, Within a Compressing Range
EUR/GBP has been trading in a progressively narrowing range through 2025–26, broadly between 0.86 and 0.88, with each successive high lower than the previous as the BoE–ECB yield gap compresses. The pair developed a descending triangle and ended H1 near the key support level; A break below 0.86 would require either a BoE hike or a reversal of ECB expectations, with 0.84 as a price target. The immediate resistance is at 0.87 (triangle and 50-week MA), with more significant resistance at 0.8750.
Past performance is not a reliable indicator of future results. All historical data, including but not limited to returns, volatility, and other performance metrics, should not be construed as a guarantee of future performance.
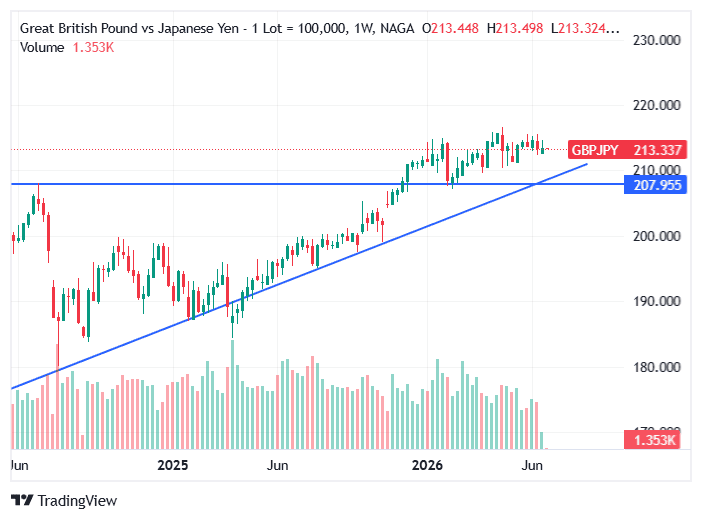
GBP/JPY — Historically Elevated, Carry-Trade Vulnerable
GBP/JPY at ¥215 is well above its 10-year average of roughly ¥170. The pair has been in an overall uptrend since 2020, driven by the BoE's aggressive hiking cycle and the BoJ's ultra-loose policy — but with the BoJ now in a genuine normalisation cycle, the structural support for the pair is gradually eroding.
Technical levels to watch: ¥210 is the first support (the level that held during several 2025 corrective episodes), followed by the key ¥208 level. A break below indicated further downside risk. ¥200 is the round-number psychological floor, and a sustained break below this area would signal a more serious unwinding of the carry trade. On the upside, the 2024 high near ¥230 is the key resistance, though reaching it from current levels would require the BoJ to pause its hiking cycle entirely.
Past performance is not a reliable indicator of future results. All historical data, including but not limited to returns, volatility, and other performance metrics, should not be construed as a guarantee of future performance.
Pound Forecast 2026 — Institution Price Predictions
Bank targets for GBP/USD range from 1.33 (ING) to 1.47 (Morgan Stanley), with the consensus clustering around 1.36–1.40. Here is the full Pound to US Dollar forecast for H2 2026 and beyond.
INSTITUTION GBP/USD TARGET BIAS KEY DRIVER / CAVEAT Morgan Stanley 1.47 (bull case) Most bullish Three Fed cuts in H1 are driving rate compression; BoE holds at 3.75%; dollar weakness is dominant. Now, the optimistic tail rather than the base case, given the Fed's June hawkish pivot. MUFG ~1.40 mid-year Bullish Gradual USD unwind; GBP/EUR sliding to ~1.11 by Q3–Q4 as ECB tightens; sterling's yield premium fades vs EUR but holds vs USD. JPMorgan 1.34→1.31→1.28 Most bearish major bank Modest GBP weakness in H2; EUR/GBP 0.88–0.89; dollar exceptionalism re-emerging. Path Jun→Sep→Dec shows progressive GBP weakness if the dollar stays firm. Goldman Sachs ~1.36 Conservative-neutral Sterling is tethered to EUR/USD trends without independent spark; UK fiscal tightening and slowing growth cap upside. Consistent with "GBP tracks dollar, not leads." ING 1.33 – 1.34 Most conservative Cautious on both UK growth and global risk appetite. Treats the 1.33–1.34 zone as a realistic year-end landing point absent a major catalyst in either direction. Scotiabank ~1.37 Moderately bullish Broadly constructive on GBP relative to peers; sees the UK's relative insulation from tariff risks and positive carry as ongoing structural supports. Cambridge Currencies 1.32 – 1.41 (range) Wide range, neutral base GBP/USD is "largely a dollar story"; sterling hasn't weakened so much as the dollar has firmed. Range captures the binary outcome of the Fed's next decision. ExchangeRates.org.uk ~1.3605 Neutral-bullish Quantitative model pointing to a modest year-end recovery from current levels; flags political instability as an idiosyncratic sterling risk.
An important caveat: virtually all published GBP targets were set before the Fed's hawkish June pivot and before Starmer's resignation. The forecasts that assumed Fed cuts are the ones with the most upside to sterling (Morgan Stanley, MUFG) and the most need for revision. JPMorgan's bearish path (1.28 by December) explicitly assumes ongoing dollar strength — which June's data supports — and is therefore the bank's forecast most consistent with current conditions.
AI-Based Pound to US Dollar Forecasts
Algorithmic and AI-driven models show a wider range of outcomes for GBP/USD than the bank consensus, reflecting the pair's sensitivity to two distinct macro regimes (dollar-driven vs. sterling-driven) that models struggle to assign probabilities to.
MODEL 2026 YEAR-END 2027 BIAS & NOTES LongForecast ~1.26–1.28 Recovery to 1.33+ Bearish 2026, constructive 2027. Projects further weakness through Q3–Q4 2026 before a 2027 recovery — the most bearish algorithmic year-end projection. Panda Forecast AI ~1.38–1.39 N/A Bullish — close to Morgan Stanley's published target; assumes UK economic resilience and sustained USD softening drive cable higher through H2. WalletInvestor Up to 1.25 (bearish model) Gradual recovery One of the most bearish AI models — projects GBP/USD declining toward 1.25 on dollar strength and BoE cuts, with only a slow 2027–28 recovery. ExchangeRates.org.uk (model) ~1.3509–1.3605 Broadly stable Statistical model landing close to bank consensus at 1.35–1.36; range 1.3072–1.3606 at the December 2026 horizon. RoboForex / statistical composite Range 1.20–1.28 (bear scenario) N/A One scenario has GBP/USD declining to 1.20 by the end of 2026 on a stronger US economy and UK weakness — which represents the far tail of algorithmic projections.
The divergence across AI models — from WalletInvestor's ~1.25 to Panda Forecast's ~1.38–1.39 — illustrates the same fundamental uncertainty visible in the bank consensus: GBP/USD has two very different 2026 end-states depending on whether the dollar firms or softens in H2. The middle ground (ExchangeRates.org.uk's 1.35–1.36) broadly aligns with the bank consensus and represents the path where neither the bull nor the bear macro scenario fully materialises. LongForecast's bearish 2026/recovery 2027 path is the most internally consistent algorithmic model relative to the current macro setup, given the Fed's hawkish June signal and the BoE's cautious stance.
Forecasts are based on algorithmic and AI models using historical data and assumptions. They are uncertain and may not reflect future market conditions. This content is for informational purposes only and is not investment advice. Past performance is not indicative of future results.
GBP/USD Price History — Key Moments
The pound has experienced more dramatic swings than almost any other G10 currency over the past four years, from the depths of the 2022 mini-budget crisis to multi-year highs in early 2026.
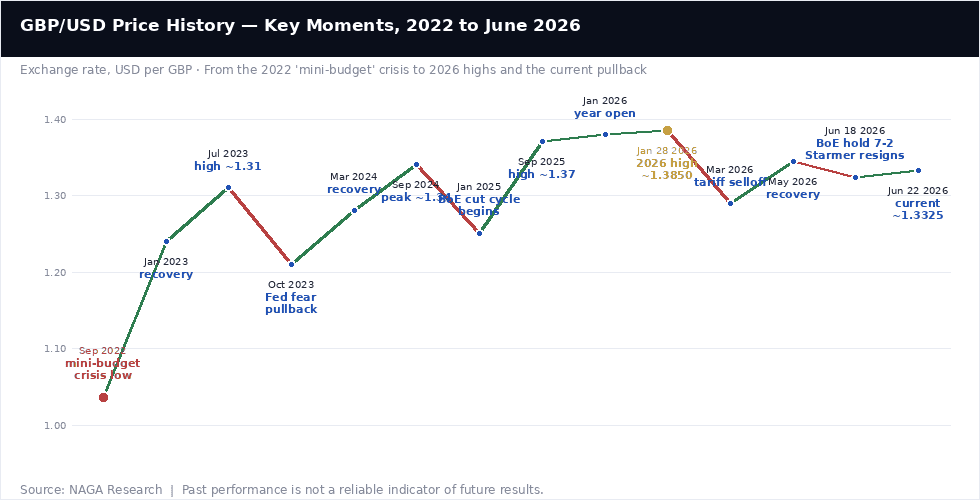
September 2022: The Mini-Budget Crisis Low (1.0373)
GBP/USD fell to 1.0373 — an all-time record low — in the early hours of September 26, 2022, in the immediate aftermath of Chancellor Kwasi Kwarteng's "mini-budget," which proposed £45 billion in unfunded tax cuts. The market reaction was the most severe for sterling since the Black Wednesday ERM crisis of 1992: gilt yields spiked to levels not seen since the 2008 financial crisis, forcing the Bank of England into emergency intervention to prevent a UK pension fund liquidity crisis. Liz Truss resigned as Prime Minister shortly afterwards. The episode remains the defining moment for Sterling's volatility in the current cycle and serves as the relevant precedent for market participants assessing Starmer's resignation in June 2026.
2023: Recovery Alongside the BoE Hiking Cycle
GBP/USD recovered steadily through 2023 as the Bank of England continued hiking to 5.25% — making Bank Rate the highest since 2008 — while UK inflation, though sticky, began to ease. The pair reached 1.31 intraday in July 2023 before pulling back sharply in autumn as the US dollar strengthened on "higher for longer" Fed messaging that took GBP/USD back toward 1.21.
2024–2025: The BoE Cutting Cycle Begins
The Bank of England began cutting rates in August 2024, delivering six quarter-point cuts through to early 2025 that brought the Bank Rate from 5.25% to 4.25% by Q1 2025. Despite this easing, GBP/USD held up well — making sterling the best-performing G10 currency against the dollar in 2024 — largely because the Fed was also cutting and because UK yields remained attractive in relative terms. The pair reached approximately 1.37 in September 2025 before a year-end pullback as dollar strength reasserted.
January 2026: The 2026 High (~1.3850)
GBP/USD reached its 2026 high near 1.3850 in late January 2026, driven by the same dollar-weakness narrative that took EUR/USD above 1.20 simultaneously — expectations that the Fed would continue cutting while the BoE held at a relatively high rate. Two dissenting BoE members had already voted to hike, providing additional sterling support via carry demand.
March 2026: Tariff Shock Low (~1.29)
The Strait of Hormuz conflict and US tariff threats drove a broad risk-off episode in March 2026, taking GBP/USD back to approximately 1.29 — erasing most of the year's gains in a matter of weeks. The pound recovered through April and May as ceasefire hopes improved market sentiment, climbing back to the mid-1.34s.
June 2026: Political and Monetary Shock
The week of June 16–22 delivered a cluster of events that reshaped the sterling outlook: the Bank of England held at 3.75% in a 7–2 vote on June 18 (two members wanting to hike), the Fed turned hawkish on June 17, and Prime Minister Keir Starmer resigned — triggering a political uncertainty shock that, while smaller in scale than the 2022 mini-budget, reminded markets of sterling's vulnerability to UK-specific political risk. GBP/USD eased from the mid-1.34s to around 1.3235, before partially recovering to the 1.33 zone as the Labour transition appeared managed rather than chaotic.
GBP forecasts are inherently uncertain, and the 2026 experience — with political shocks, a Middle East conflict, and central bank pivots all arriving within weeks of each other — illustrates how quickly conditions can change. Forecasts are based on fundamental and technical analysis of historical price movements; past performance and analyst projections are not reliable indicators of future results. Never invest more than you can afford to lose.
Sources
- Bank of England — MPC Minutes, June 18, 2026
- Federal Reserve — FOMC Press Release, June 17, 2026
- Cambridge Currencies — Currency Forecast 2026 (updated June 19)
- JPMorgan Global Research — Currency Volatility: Dollar Strength
- ExchangeRates.org.uk — Pound to Dollar Forecast 2026
- Cambridge Currencies — GBP/JPY Forecast 2026
- BitMEX — GBP/USD Forecast 2026: The £3.8B Cable Squeeze Setup
Other Resources
- EUR/USD forecast & price predictions 2026
- NASDAQ 100 forecast & price predictions 2026
- DAX 40 forecast & price predictions 2026
- Gold forecast & price predictions 2026
- Silver forecast & price predictions 2026
- Oil forecast & price predictions 2026
- How to trade forex
- Fundamental analysis — what moves FX
- Technical analysis tools guide