



Most price charts add a new bar every minute, hour or day, whether the market moved or not. A Renko chart does the opposite: it ignores time completely and only draws a new "brick" when price travels a fixed distance. The result is a clean, staircase-like view of the trend that filters out much of the noise you see on candlestick charts.
In this guide, you'll learn what a Renko chart is, how Renko bricks form, how to choose the right box size, how Renko compares with candlesticks and Heikin Ashi, and which Renko trading strategies traders use most often, including how to set Renko charts up on MetaTrader 5.
How to Start Trading with Renko Charts
- Choose a market and open a Renko chart. Liquid markets like major forex pairs, index CFDs and large-cap stocks trend most cleanly. On MetaTrader 5, add Renko through an indicator or a custom symbol.
- Set your box size. Start with an ATR (14)-based box or roughly 0.25%–1% of the price: bigger boxes for swing trading, smaller ones for intraday.
- Read the trend and define your entry. Green runs mark an uptrend, red runs a downtrend. For example, enter after a breakout brick plus one confirmation brick.
- Confirm and manage risk. Filter signals with a moving average, RSI or MACD; place stops and exit orders.
Alternatively, use our advanced technical insights tools such as Trading Central for pattern recognition or copy the moves of top-performing traders in real time with NAGA Autocopy.
What Is a Renko Chart?
A Renko chart is a price-based chart that plots fixed-size bricks only when price moves by a set amount (the box size), ignoring time and small fluctuations. Each brick is drawn at a 45-degree angle to the previous one: up and green (or white) when price rises, down and red (or black) when it falls.
The name comes from the Japanese word renga, meaning "brick". Renko charts were developed in Japan, alongside candlesticks and Kagi charts, and were popularised in the West by Steve Nison in Beyond Candlesticks (1994).
Because a brick only prints after a meaningful move, one brick can take five minutes or five days to form. That's the core idea behind the Renko chart definition: price, not time, decides when the chart updates.
Renko Bricks, Bars and Candles: Same Thing?
Yes. "Renko bricks", "Renko bars", "Renko boxes" and "Renko candles" all describe the same building block. Strictly speaking, Renko candles have no wicks and no open-high-low-close data like Japanese candlesticks, but many trading platforms and indicators use "Renko candles" as a friendly label. Some modern versions add wicks to show how far price travelled before a brick closed.
How Do Renko Charts Work?
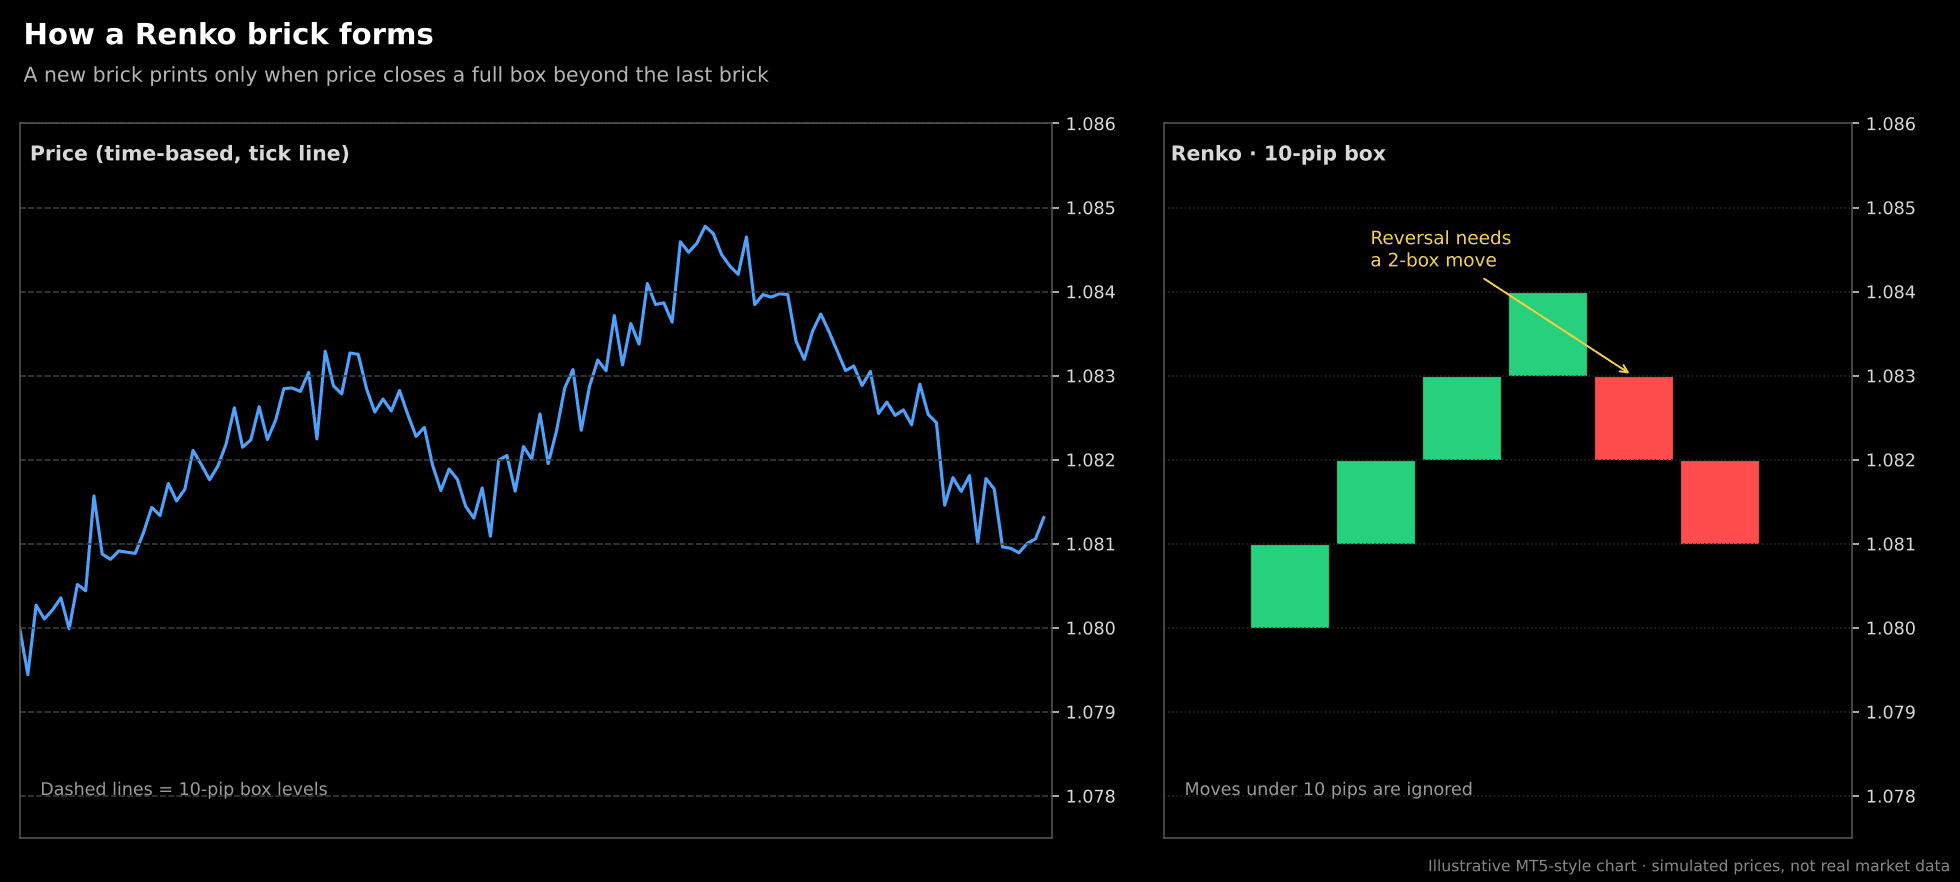
A Renko chart works with three simple rules, usually applied to closing prices:
- Continuation: if price closes at least one box size above the top of the last up brick, a new green brick is added. The same applies downwards for red bricks.
- Reversal: to change direction, price must move two box sizes against the last brick. The first opposite brick starts one box away from the previous brick's close, which is why reversals look "offset" on the chart.
- Everything else is ignored: if price moves less than one box, nothing is drawn, no matter how much time passes.
For example, with a 10-pip box on EUR/USD and the last green brick closing at 1.0840, a new green brick prints at 1.0850. A red brick only prints if price falls to 1.0820. Any move between 1.0821 and 1.0849 leaves the chart unchanged.
Why Traders Use This Approach
Renko charts are built to answer one question quickly: which way is the trend going? By removing time and minor price swings, they make trends, support and resistance and chart patterns easier to see. The trade-off is lag: a brick only confirms a move after it has happened, so Renko shows the current trend clearly but doesn't predict the next one.
How to Choose a Renko Box Size
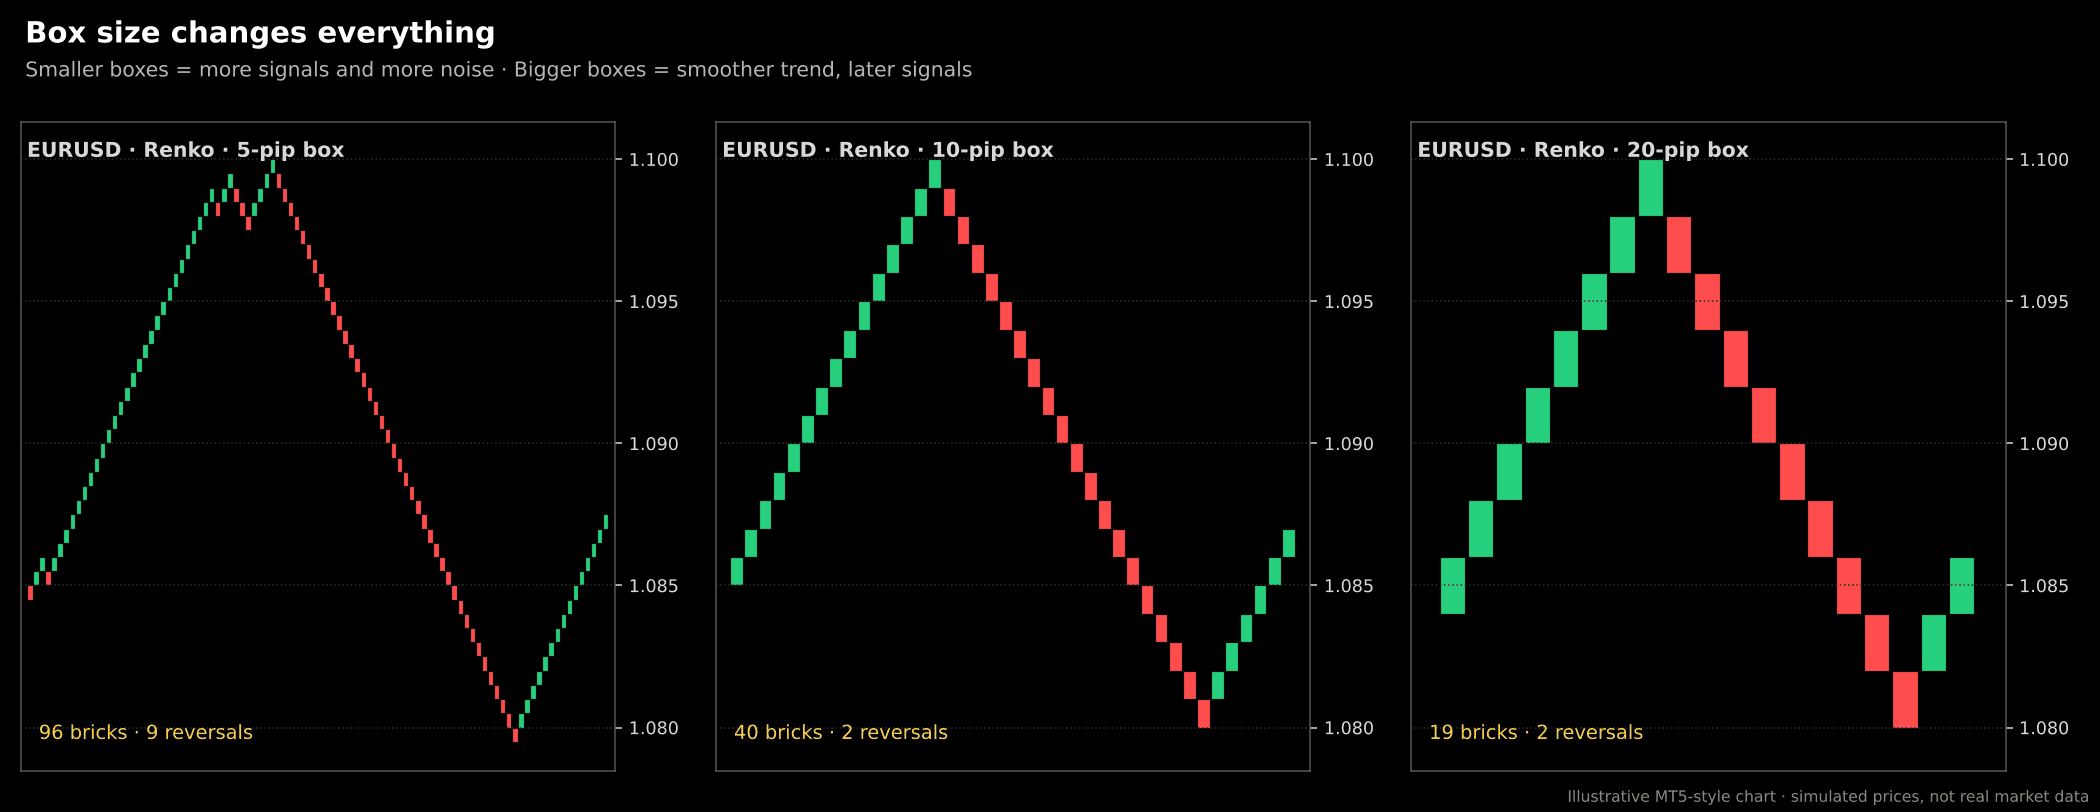
The box size is the single most important Renko setting: it decides how many bricks you see, how much noise is filtered and how fast signals arrive. The same EUR/USD data looks completely different with a 5, 10, or 20-pip box.
Renko Box Size Calculator: Three Methods
There's no single correct way to set a Renko box size. Most traders use one of three methods, and each one balances simplicity against how well the box adapts to market volatility.
Three Ways to Calculate a Renko Box Size
Method How it works Example Best for Fixed (static) You set a constant size in points, pips or currency 10 pips on EUR/USD; $5 on a $250 stock Beginners, markets with stable volatility Percentage of price Box = price × chosen %, typically 0.25%–1% 0.5% × $250 = $1.25 box Stocks and indices across different price levels ATR-based Box = Average True Range over N periods (often 14) Daily ATR(14) of 68 pips → 68-pip box Adapting to current volatility Three ways to calculate a Renko box size: fixed, percentage of price and ATR-based, with examples and best uses.
The ATR (Average True Range) measures average volatility. For each bar, the true range is the largest of three values:
TR = max(High − Low, |High − Closeprev|, |Low − Closeprev|)
The ATR is then the moving average of TR over N periods (14 by default), and that value becomes the brick size. Many platforms calculate it once when the chart is built, so the box stays fixed until you rebuild the chart.
Quick Rules of Thumb
- Swing and position trading: use a daily ATR (14) box, or 0.75%–1% of price.
- Intraday trading: use an H1 ATR (14) box, or 0.25%–0.5% of price.
- Count your bricks: if the chart reverses every two or three bricks, the box is too small; if a week's move fits in two bricks, it's too big.
- Test before trading: the best Renko box size for past data won't always be the best one going forward, so you may want to backtest across several market conditions.
How to Read a Renko Chart
Read a Renko chart by colour and sequence: a series of green bricks means an uptrend, a series of red bricks means a downtrend, and a colour change marks a possible reversal. Since every brick is the same size, you can measure any move by counting bricks.
- Trend: consecutive bricks of one colour show a trend; the longer the run, the stronger the move.
- Pullback: a single opposite brick inside a long run is often just a pause, not a reversal.
- Reversal: two or more opposite bricks in a row suggest the trend may be changing.
- Consolidation: bricks alternating colour around the same level show a range with no clear direction.
- Time: the horizontal axis isn't time. Ten bricks can cover an hour or a month, so always check the dates.
Renko vs Candlestick vs Heikin Ashi charts
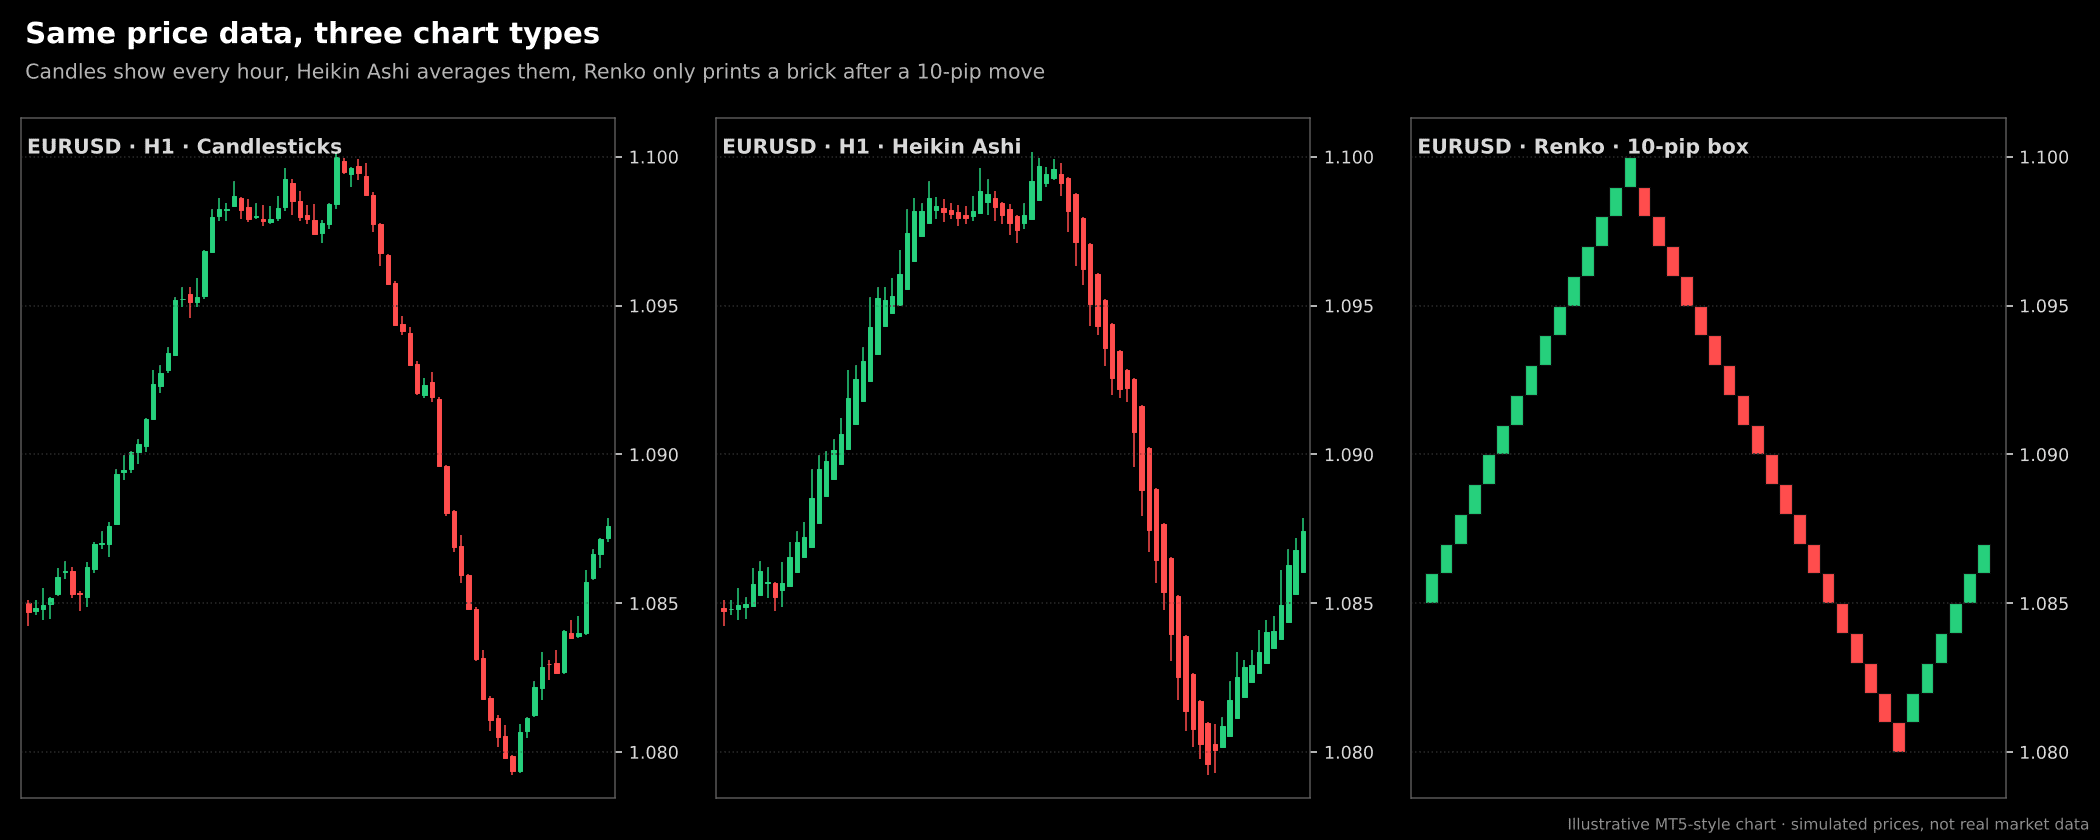
Candlesticks show every move in every period, Heikin Ashi averages candles to smooth the trend, and Renko drops time altogether. Here is the same price data plotted three ways:
Renko vs Candlestick vs Heikin Ashi Charts
Candlestick chart Heikin Ashi chart Renko chart Based on Time + price (OHLC) Time + averaged OHLC Price movement only New bar when Each period closes Each period closes Price moves one box (two to reverse) Noise High Medium Low Shows exact open, high, low, close Yes No (averaged) No Shows gaps and wicks Yes Partly No (unless wicks are added) Signal speed Fastest Medium Slower (needs a full box) Best for Precise entries, price action, scalping Riding trends with candles Trend identification, S/R, breakouts Renko vs candlestick vs Heikin Ashi charts: how each is built, how much noise it shows and what it's best for.
Many traders combine them: they use Renko to define the trend and key levels, then switch to a candlestick chart for the precise entry.
Renko Trading Strategies
Most Renko trading strategies follow one logic: trade in the direction of the brick trend, enter on a breakout or pullback, and exit after a set number of opposite bricks. Here are the strategies traders use most often across forex, indices, commodities and stocks.
1. Brick Trend-Following
- Entry: go long after two consecutive green bricks following a red run (or short after two red bricks following a green run).
- Pullback entry: in a strong trend, a single opposite brick can offer a better entry price in the trend's direction.
- Exit: close when two opposite-colour bricks appear.
- Filter: only take trades in the direction of a moving average (for example, a 20-period EMA applied to the Renko chart).
2. Support and Resistance Breakout
Support and resistance levels are easier to draw on Renko because brick tops and bottoms line up at the same prices. A level is stronger when price has been rejected from it two or three times.
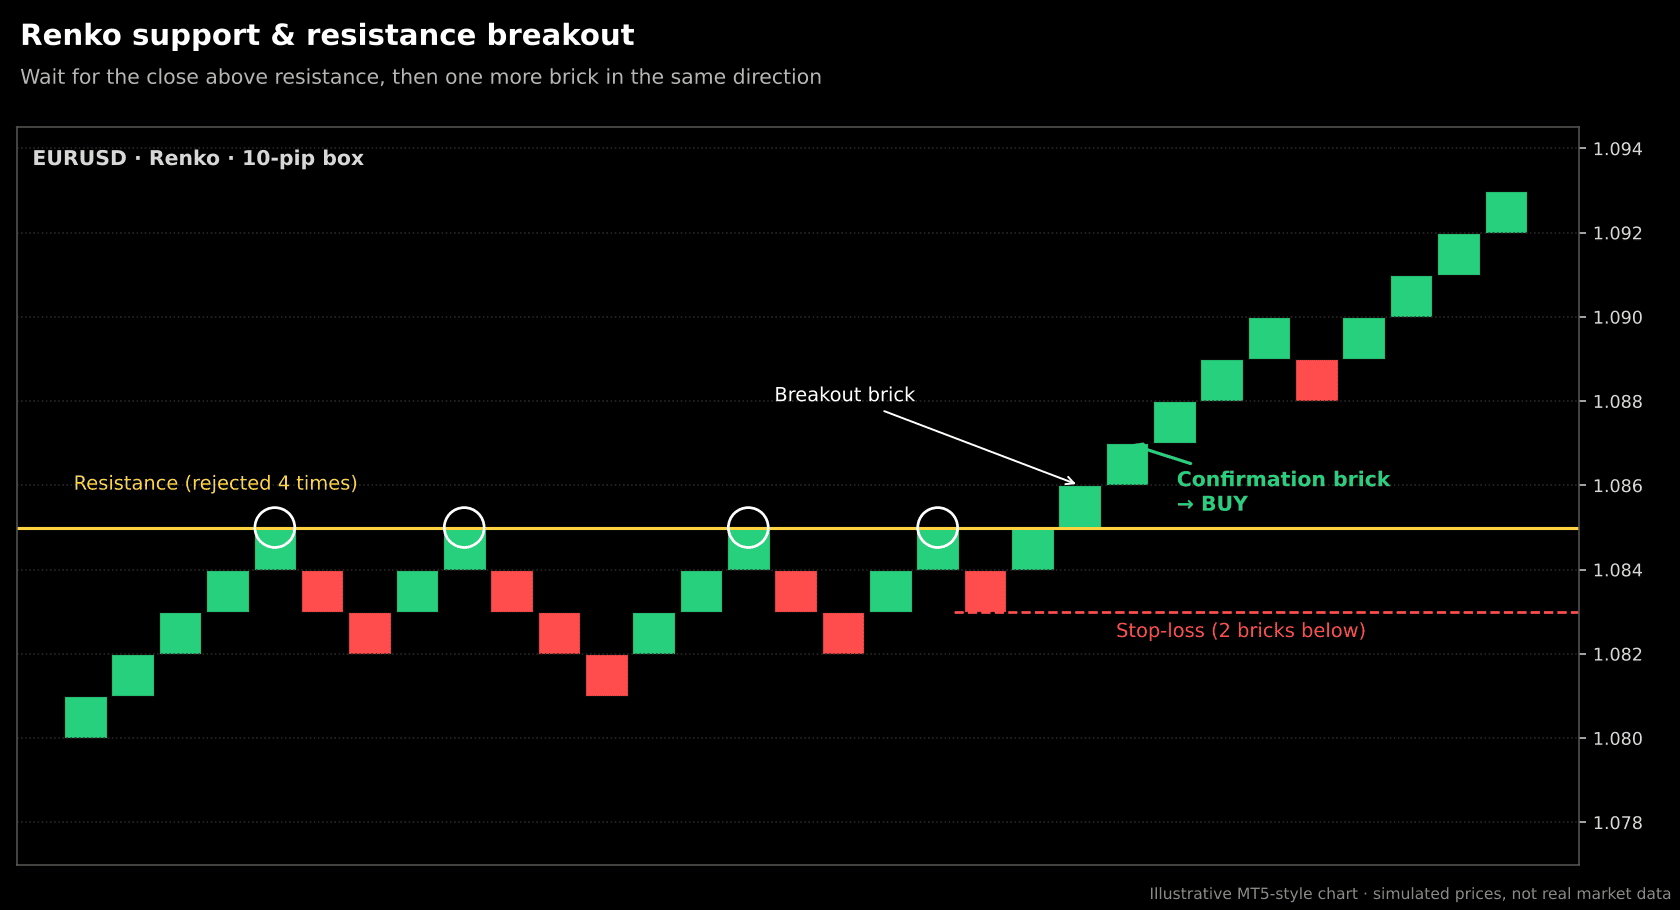
Here is how you can trade a support/resistance breakout on Renko charts:
- Mark a horizontal level where price has stalled at least twice.
- Wait for a brick to close beyond the level (the breakout brick).
- Enter on the next brick in the same direction (the confirmation brick).
- Place the stop-loss two or three bricks back inside the range.
- Take profit at the next level, or trail the stop under each new brick.
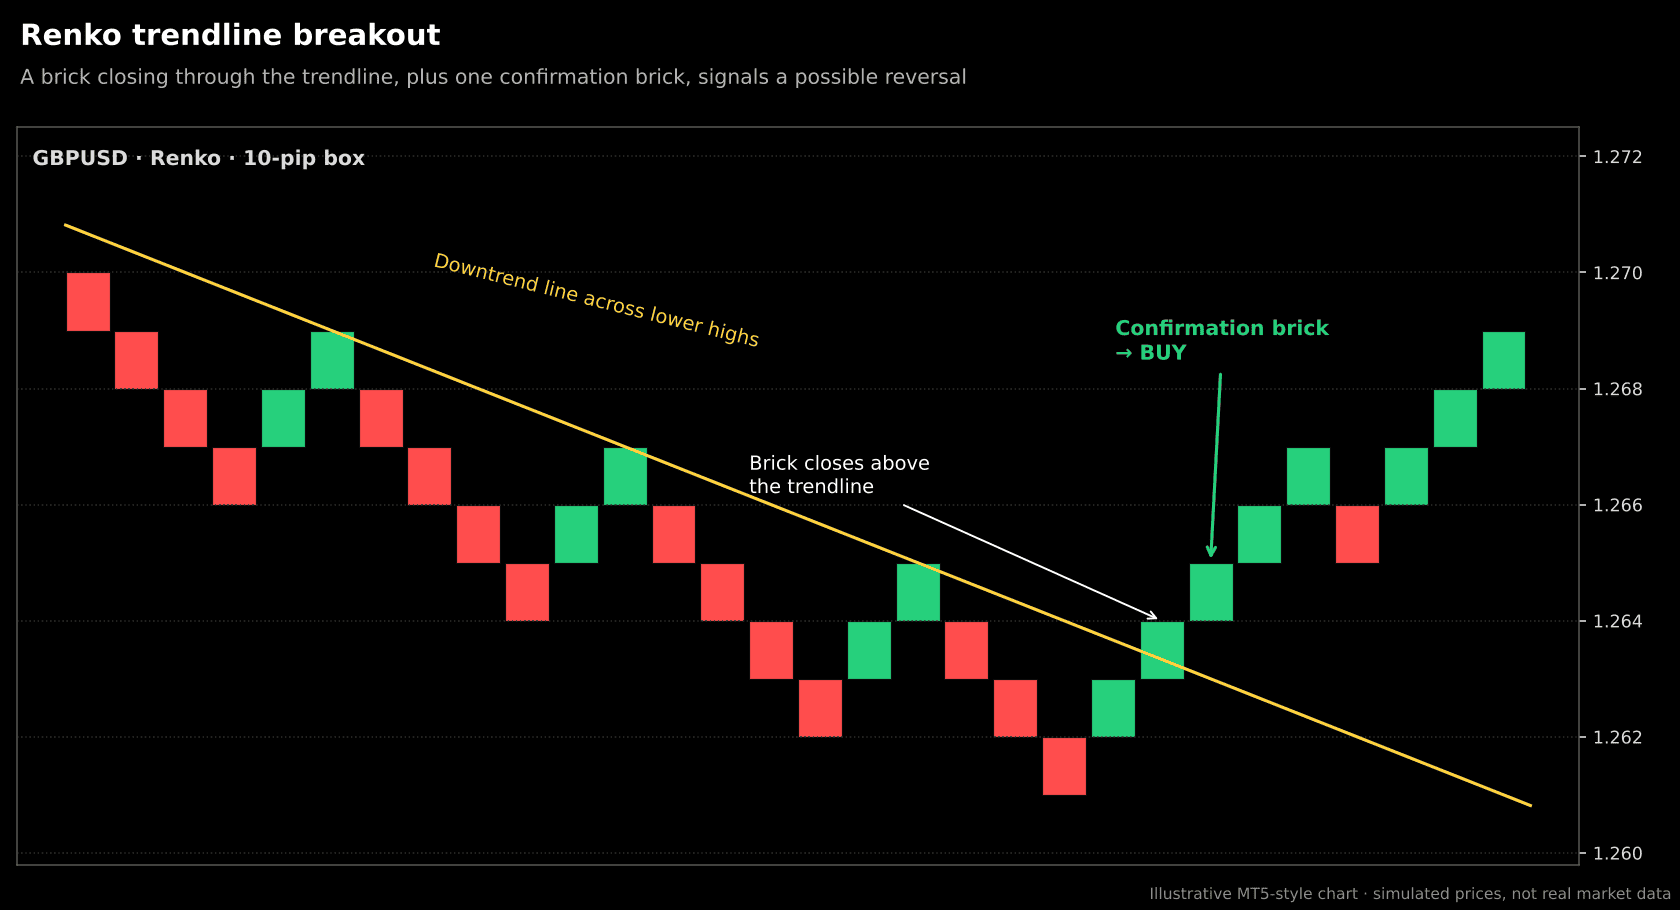
3. Trendline Breakout
In a downtrend, draw a trendline across the lower highs; in an uptrend, across the higher lows. A brick that closes through the line, followed by a confirmation brick, signals a possible trend reversal.
4. Chart Patterns: Double Tops, Double Bottoms, Head and Shoulders
Without wicks and noise, reversal patterns form with equal-height peaks and troughs that are easier to recognise.
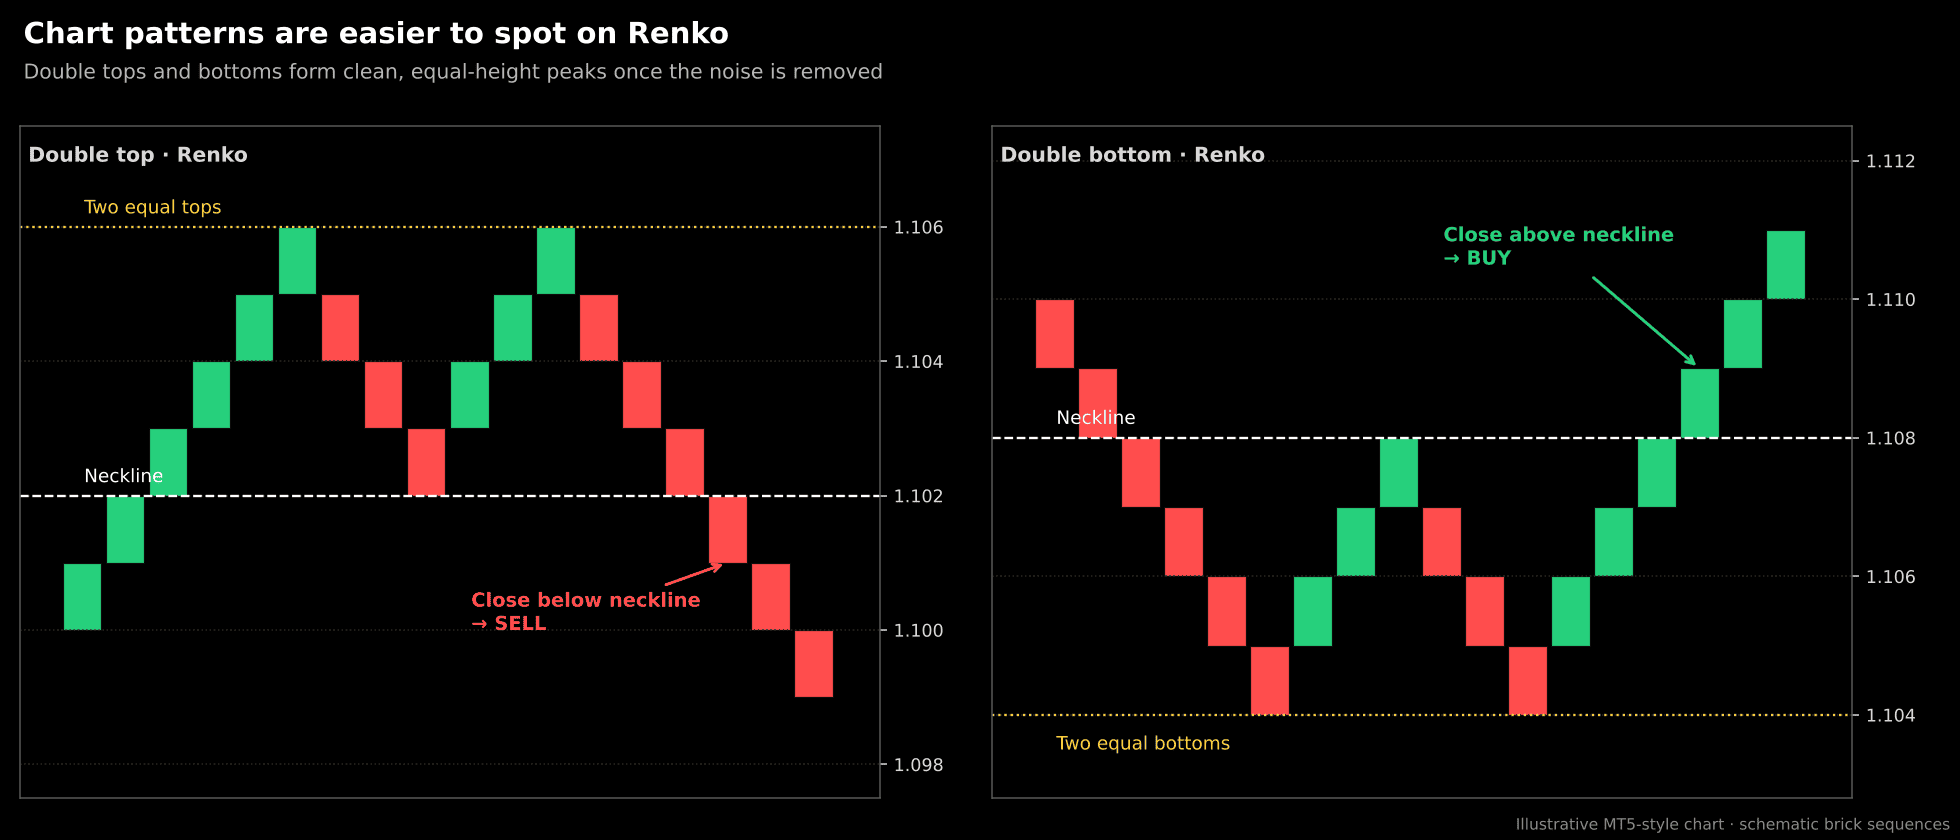
- Double top: two peaks at the same level after an uptrend; sell when a brick closes below the neckline.
- Double bottom: two troughs at the same level after a downtrend; buy when a brick closes above the neckline.
- Head and shoulders: a higher peak between two lower ones; the signal is a close through the neckline that connects the lows.
Learn more about chart patterns
5. Renko + Indicators
Renko works well with indicators applied to the brick series:
- Moving averages: price above a rising 20 EMA confirms longs; crossovers of a 10 and 20 EMA signal trend changes.
- RSI, Stochastic, MACD: spot overbought and oversold conditions and divergence, which Renko alone doesn't show well.
- Fibonacci retracements: bricks often stall cleanly at the 38.2%, 50% and 61.8% levels, offering pullback entries.
- Bollinger Bands or Donchian channels: identify breakouts from tight brick ranges.
Learn more about trading indicators
6. Swing Trading vs Scalping with Renko
Renko suits swing trading: you hold while bricks keep printing in your direction and exit after a predefined reversal. It's less suited to scalping because bricks only form after a full box move, so signals can arrive too late for very small targets. If you scalp, use small boxes with care and confirm on a tick or M1 chart.
Quantitative Analysis with Renko Charts
Because every Renko brick is the same size, a Renko chart turns price into a clean sequence of +1 and −1 moves, which makes it a useful base for statistical analysis. Two common questions are how likely a streak is to continue and how Renko combines with volume profile.
Renko Streak Probability: Will the Next Brick Be the Same Colour?
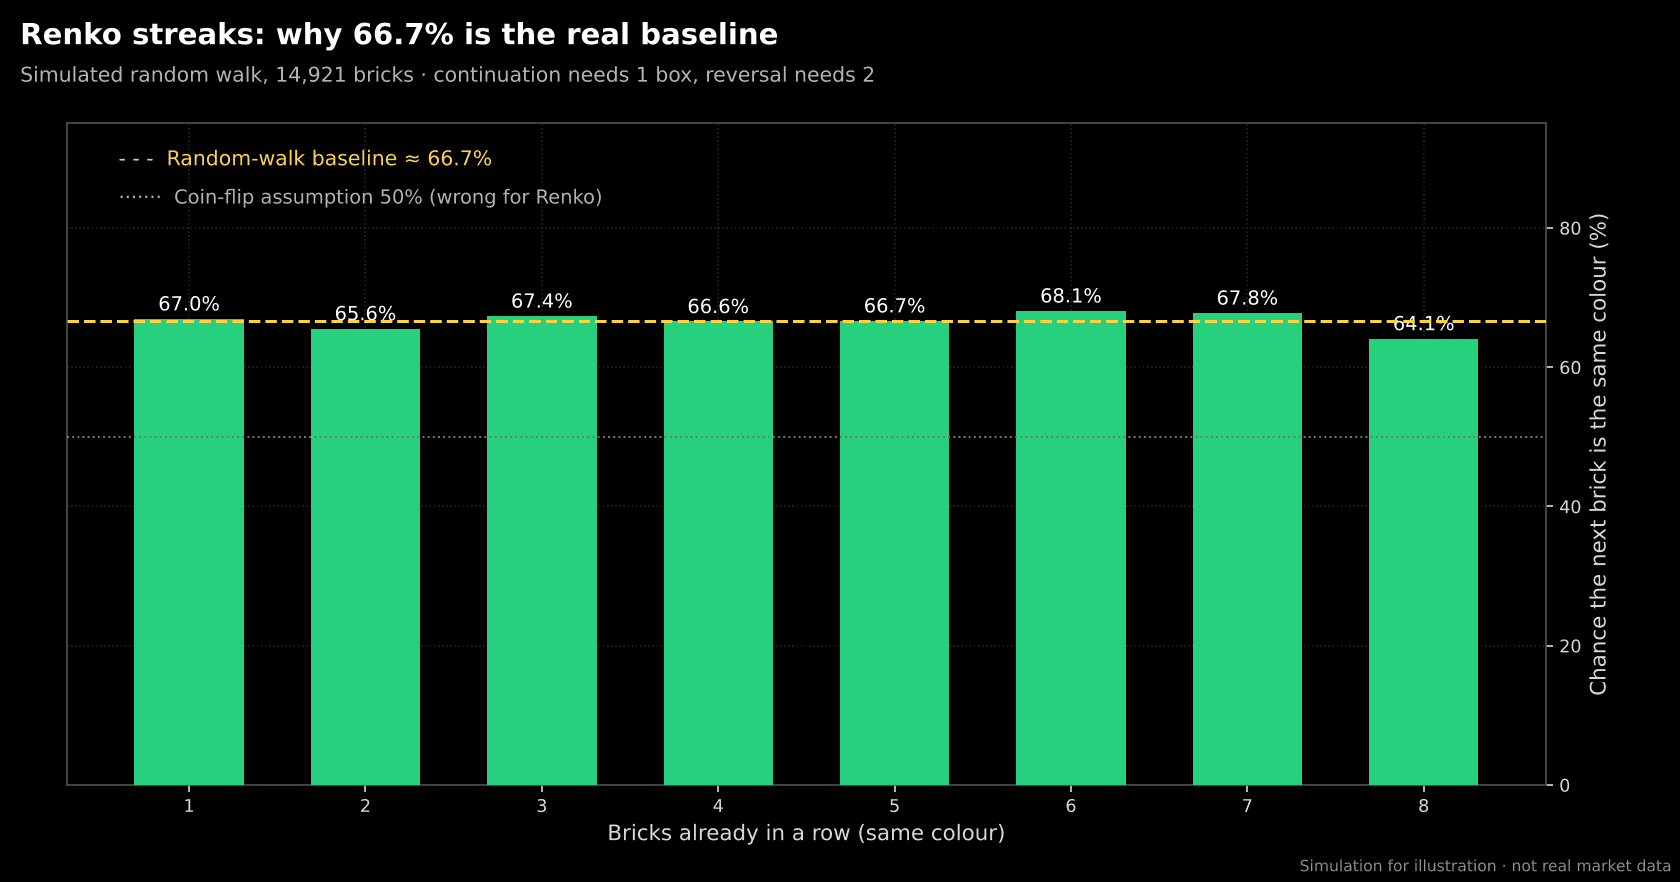
Many traders assume the odds of the next brick matching the last one are 50/50. On a standard Renko chart, they aren't. From the close of any brick, price only needs to move one box to print a continuation brick but two boxes to print a reversal brick.
In a purely random market, the probability of moving +1 box before −2 boxes is:
P(same direction) = 2 ÷ (2 + 1) = 2/3 ≈ 66.7%
That's why roughly two out of three bricks continue the previous direction even when the market has no trend at all, and that rate doesn't change with streak length.
What this means for traders:
- A system that wins about 66% of the time by "following the last brick" may have no real edge; compare results with the 66.7% baseline, not 50%.
- Real markets can deviate from this baseline: trending phases push continuation above it, and mean-reverting ranges push it below. Measuring that gap on your own market and box size is a valid way to test whether a trend filter adds value.
- The reward-to-risk is uneven: continuation adds one box, while a reversal costs two boxes from the brick close, which balances out the higher hit rate.
Renko and Volume Profile
Volume profile shows how much volume traded at each price level rather than in each period, so, like Renko, it's price-based rather than time-based. Used together:
- High-volume nodes (HVN) and the point of control (POC) act as support and resistance where bricks often stall or reverse.
- Low-volume nodes (LVN) are areas price moves through quickly; a Renko breakout into an LVN often runs several bricks.
- Value area high and low give objective breakout levels for the S/R breakout strategy.
Note that standard Renko bricks carry no volume of their own. Some platforms and indicators sum the tick volume that traded while each brick formed, which helps confirm whether a breakout brick had real participation.
How to Use Renko Charts on MetaTrader 5
MetaTrader 5 has no built-in Renko chart type, so Renko is added with a Renko indicator or Expert Advisor that builds bricks as a custom symbol.
The usual setup takes a few minutes:
- Open a chart of the instrument you want to trade (for example, EUR/USD) on the M1 timeframe, which gives the tool the most detailed price data.
- Install a Renko builder from the MQL5 Market or another trusted source, then attach it to the chart from the Navigator.
- Set the box size (fixed points or ATR-based) and choose whether to show wicks.
- The tool opens a new chart with a custom symbol (for example, EURUSD_Renko) where each bar is a brick.
- Add trading indicators to that Renko chart as usual: moving averages, RSI, MACD, Fibonacci and so on.
- Place trades on the original symbol, not the custom Renko symbol, since your broker only executes orders on its own instruments.
💡 Tip: Keep the Renko chart and a normal candlestick chart side by side. Use Renko for direction and levels, and the candlestick chart to fine-tune entries and check spreads and news gaps.
Advantages and Limitations of Renko Charts
Like any chart type, Renko charts have clear strengths and real trade-offs. Removing time and minor price moves makes trends easier to read, but it also hides details that some traders rely on, such as wicks, gaps and exact timing. The table below sets out the main pros and cons side by side, so you can decide whether Renko fits your trading strategy.
Advantages and Limitations of Renko Charts at a Glance
Advantages Limitations Filters out small price moves and noise Lags price: a brick confirms only after a full box move Trends are clear at a glance from brick colour Hides exact open, high, low, close and wicks Support, resistance and patterns are easier to draw Ignores time, so you can't see how fast a move happened Simple, rule-based entries and trailing stops Results depend heavily on box size Works across forex, indices, commodities and stocks Choppy, range-bound markets create frequent false reversals Pairs well with indicators like EMA, RSI and MACD Not native on MT5; needs an indicator or custom symbol
Tips for Trading with Renko Charts
- Match the box size to your timeframe and re-check it when volatility changes.
- Wait for confirmation: one opposite brick is often noise; many traders wait for two.
- Combine Renko with at least one indicator or a higher-timeframe trend filter.
- Avoid major news releases if you trade small boxes; one spike can print and erase several bricks.
- Use brick-based risk management: set stops a fixed number of bricks away and size positions so a stop-out costs only a small part of your account.
- Backtest and demo-trade first before applying a Renko strategy to a live account.
Conclusion
Renko charts strip price action down to what matters most to trend traders: direction and distance. By plotting bricks only when price moves a set amount, they filter out noise and make trends, support and resistance, breakouts and chart patterns easier to spot. Choose your box size carefully, confirm signals with indicators or a second chart, keep the 66.7% streak baseline in mind, and practise on a demo account before trading Renko strategies with real money.