The trend-following method empowers traders to seize opportunities in markets exhibiting clear direction—whether bullish or bearish—by aligning their trades with prevailing momentum. This approach prioritizes maximizing profit potential by staying engaged with the trend for as long as it maintains strength, helping traders avoid premature exits and capitalize on sustained market moves.
Markets frequently move in discernible trends lasting days, weeks, or even months. Recognizing that an upward or downward trajectory typically persists, traders using trend-following strategies can harness these extended moves rather than reacting to short-term fluctuations. This strategy taps into market psychology and momentum, offering a structured path to consistent trading performance.
To help you start applying these principles effectively, Naga.com offers a step-by-step approach:
- Master the trend trading methodology through guided tutorials.
- Practice risk-free with a demo account designed for experimenting with trend strategies.
- Confidently transition to a live trading account when ready, leveraging Naga's powerful tools and community insights.
What is trend trading?
Trend trading is a trading strategy based on analyzing the market momentum to identify a consistent directional movement—whether upward, downward, or sideways—and trading in alignment with that trend. This approach is based on the principle that markets can show somewhat predictable behavior, with trends that traders can leverage for potential profits by studying past price movements and technical indicators. Although trend trading is typically a medium- to long-term strategy, it can be adapted to shorter timeframes depending on how long the market moves in a certain direction.
The two main types of trend traders are swing traders and position traders. Swing traders enter and exit trade more frequently, in an effort to capitalize on smaller price fluctuations within the broader trend. In contrast, position traders ignore short-term swings while holding their positions for the whole period that the trend lasts. Traders take a long position in a rising market or a short position in a falling market by "following the path of least resistance." Some traders focus on major long-term trends, while others capitalize on smaller secondary trends by moving in and out of the market as momentum shifts. In general, a trend trading strategy is based on the idea that once a trend is established, it will attract more participants and create sustained momentum in the same direction.
How Can a Trend Be Recognized?
The purpose of trend trading strategies is to help traders identify trends early and exit the market before a reversal occurs. By analyzing the opening price, closing price, and trading range of each candle on a chart, traders can gather valuable information to assess the trend’s direction and strength.
In general, trends are classified into three categories: uptrends, downtrends, and sideways trends.
Uptrends
To identify an uptrend, connect two low points on a price chart. If the line slopes upward with higher highs and higher lows, this indicates an uptrend. In such cases, traders might consider opening a long position to capitalize on the upward momentum.

For illustrative purposes only
Downtrends
To identify a downtrend, connect two higher low points on a price chart. A downward-sloping line with lower highs and lows signifies a downtrend. In this case, traders may want to consider short selling to profit from the declining prices.
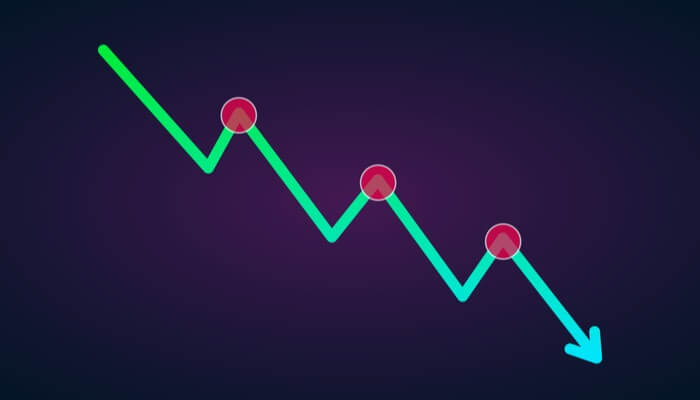
For illustrative purposes only
Sideways Trends
If the highs and lows align horizontally, the market is considered to be in a "sideways trend" or range-bound. In this scenario, traders may take long or short positions within the range, speculating on small fluctuations between the horizontal lines.

For illustrative purposes only
Trend Trading Strategies
Trend trading strategies help traders identify emerging trends, confirm them, and exit the market before a reversal occurs. These strategies typically rely on either technical analysis—using price action and indicators—or fundamental analysis. Some traders also combine both approaches to improve accuracy and adaptability.
Although trend trading is a strategy in itself, it is often blended with elements of other methods depending on the type of trend and analysis being conducted. Typically, markets and asset classes like stocks and mutual funds apply more long-term trend trading strategies. However, short-term traders often focus on quick market patterns in asset classes like commodities, currencies, and indices.
Short-Term Trend Trading
Short-term trend traders, including day traders, aim to profit from brief price fluctuations that occur within a single day. These traders often use intraday strategies, such as scalping, which involves making rapid trades on small price movements.
Day Trading
Intraday trend traders keep their positions open only during the trading day, taking advantage of trends lasting a few minutes or hours. This approach relies on analyzing price changes within shorter time frames. For instance, if there is an uptrend within the day, a trader might set a trailing stop below each successive higher low. This allows them to lock in profits while guarding against an abrupt reversal. Following intraday trends can also benefit traders during downward trends, as short selling is commonly used to capitalize on brief market drops.
Long-Term Trend Trading
Long-term trend trading involves holding positions over extended periods—weeks, months, or even years—usually in an upward trend. Long-term traders rely heavily on fundamental analysis, examining market forces and economic factors that could influence prices over time. Unlike short-term traders, they are less concerned with daily price fluctuations and focus on the larger trend trajectory and its underlying drivers.
Position Trading
Position trading is a popular technique among long-term traders. This strategy allows traders to buy and hold positions for an extended duration, prioritizing long-term objectives over short-term market shifts. Although position traders focus on the overall trend, they still monitor short-term changes to understand how these may impact the long-term outlook of their trades. This approach often leans on fundamental analysis to predict potential price patterns and optimize long-term returns.
Trend Reversal Trading
Trend reversal trading involves identifying and capitalizing on shifts in market direction, where a trend changes from upward to downward or vice versa. By recognizing an impending reversal, traders can strategically exit positions before a full reversal unfolds or quickly react if the shift has already started. This approach, often called "countertrend trading," relies on trading against the prevailing trend in anticipation of a new trend forming.
Trend Reversal Trading Strategy
In a trend reversal strategy, traders speculate on a change in trend direction, typically positioning themselves against the existing trend. This method aligns closely with swing trading, as it focuses on medium-term trades based on anticipated “swings” in market momentum. Traders analyze trend patterns and may buy or sell an asset that has shown consistent upward or downward movement, aiming to take advantage of the price change once the trend reverses.
To succeed in countertrend trading, traders rely on a blend of technical and fundamental analysis. They carefully select entry and exit points by using technical indicators, like candlestick patterns, trend line breaks, and support or resistance levels. External factors, such as market sentiment, economic news, and global events, are also considered, as these can impact the likelihood of a trend reversal. Effective risk management is crucial in this strategy: setting stop-loss orders, controlling position sizes, and diversifying investments help traders manage volatility. By spreading trades across multiple markets, traders can reduce the impact of unexpected reversals and create a more balanced portfolio, particularly in volatile conditions.
Four of the Best Trend Indicators
To identify and capitalize on market trends, traders often rely on technical indicators that reveal momentum, direction, and potential trend reversals. While price action offers important clues, technical indicators provide precise data, making them essential tools in trend trading. Among the most popular and effective trend indicators are Bollinger Bands, Moving Averages, the Relative Strength Index (RSI), and the Average Directional Index (ADX). Each of these tools helps traders assess market dynamics, from identifying overbought or oversold conditions to confirming the strength and direction of a trend. Let’s explore how each of these indicators can enhance a trend trading strategy.
Bollinger Bands
Bollinger Bands are popular for identifying overbought and oversold levels in the market. This indicator comprises three lines: the middle band, which is a 20-day simple moving average (SMA), the upper band, which is the SMA plus twice the daily standard deviation, and the lower band, which is the SMA minus twice the daily standard deviation. When the asset’s price dips below the lower band in a downtrend, it suggests that prices may have dropped too low, signaling a potential reversal into an uptrend. Conversely, a price above the upper band signals that the market may be overbought and could reverse lower.
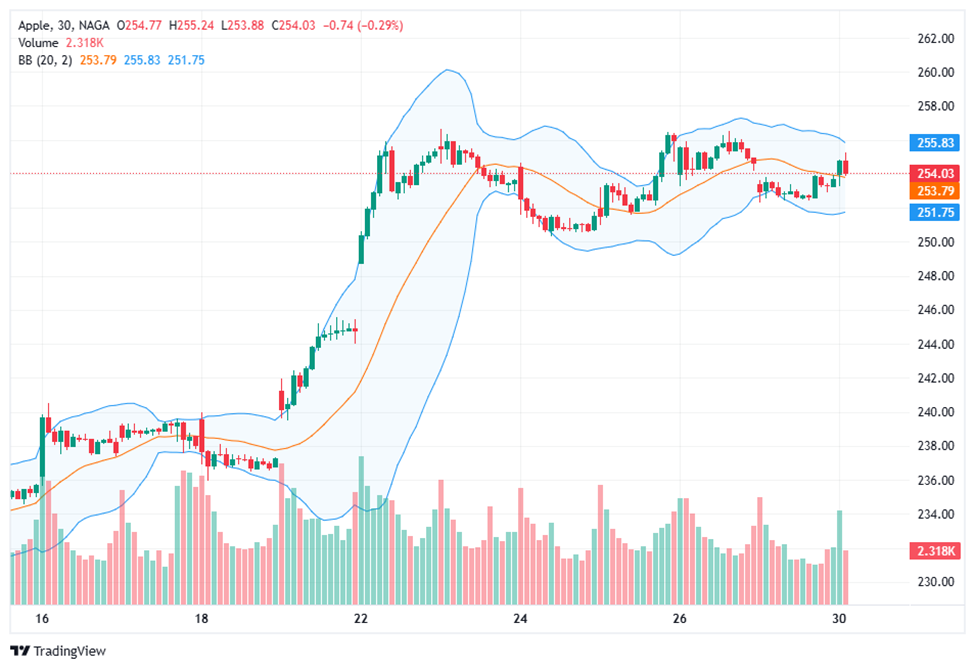
Past performance is not a reliable indicator of future results. All historical data, including but not limited to returns, volatility, and other performance metrics, should not be construed as a guarantee of future performance.
Trend traders often use Bollinger Bands as guides for entry and exit rather than as standalone trend direction indicators. For instance, in a downtrend, a trader might enter a short position when the price reaches the upper band, anticipating a return to the downward trend. In an uptrend, traders can use the lower band as a trailing stop for their positions, allowing them to capture gains while guarding against a sharp reversal. Bollinger Bands are especially effective in range-bound markets where prices fluctuate between the upper and lower bands.
What are Bollinger Bands and how to use them in trading
Moving Averages
Moving averages (MAs) smooth out price data over a specific period, creating a single line that helps traders identify the direction of a trend. This lagging indicator is particularly helpful for assessing whether the market is in an uptrend or downtrend. When the price remains above the MA, an uptrend is indicated; when it’s below, a downtrend is likely. While many traders prefer the 50-day or 200-day MA, the choice of time period can vary based on individual strategy.
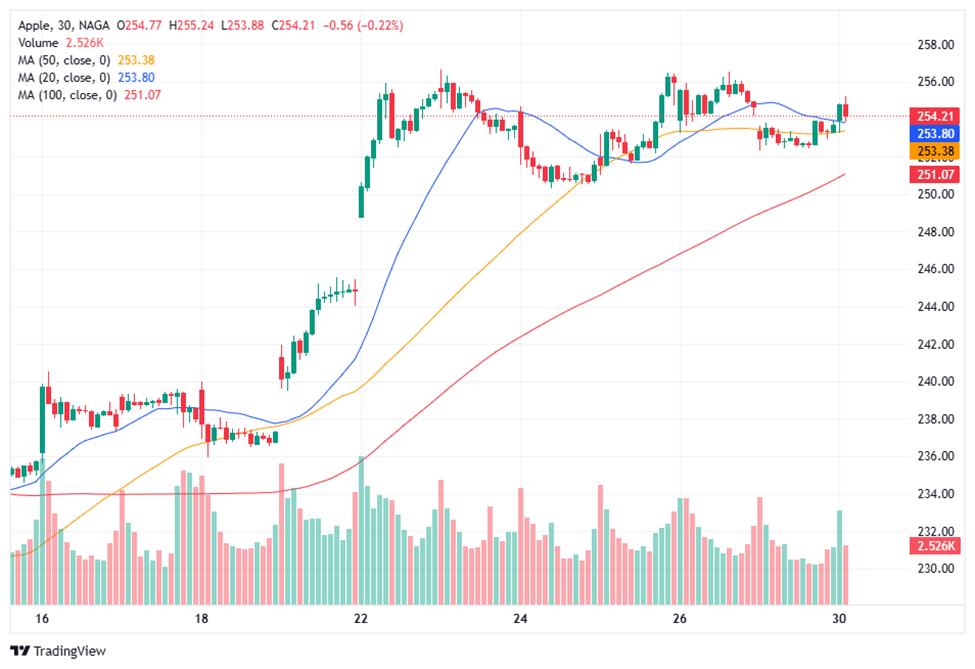
Past performance is not a reliable indicator of future results. All historical data, including but not limited to returns, volatility, and other performance metrics, should not be construed as a guarantee of future performance.
A common strategy involves the crossover of two moving averages: a shorter-term moving average (e.g., 9-day EMA) and a longer-term moving average (e.g., 14-day EMA). When the shorter-term MA crosses above the longer-term MA, it signals a potential upward trend, prompting traders to consider long positions. Conversely, when the short-term MA crosses below the long-term MA, it signals a possible downtrend, ideal for short positions. This crossover method helps trend traders confirm changes in market direction and enhances timing accuracy for trend entries and exits.
What are Moving Averages and how to use them in trading
Relative Strength Index (RSI)
The Relative Strength Index (RSI) helps identify overbought and oversold conditions as well as the momentum of price movements. It calculates the average gains and losses over a certain period, typically 14 periods, and displays results on a scale from 0 to 100. When the RSI surpasses 70, it indicates an overbought market, suggesting the trend may soon reverse downward. Conversely, an RSI below 30 suggests the market is oversold, indicating a potential upward reversal.
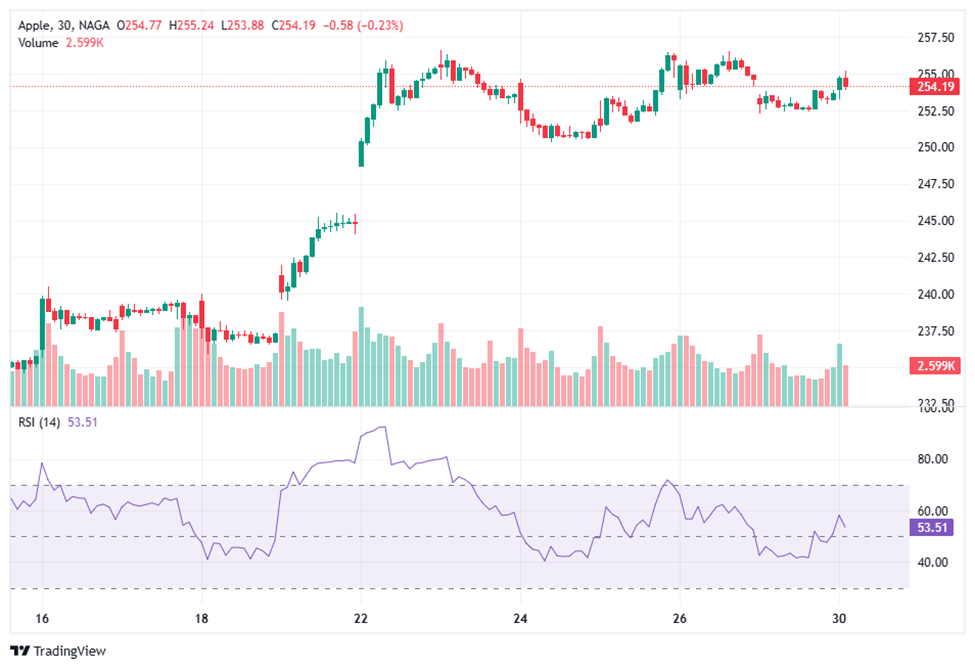
Past performance is not a reliable indicator of future results. All historical data, including but not limited to returns, volatility, and other performance metrics, should not be construed as a guarantee of future performance.
In practice, trend traders use RSI levels to confirm exit points for long positions or entry points for short ones when the market reaches overbought levels. Conversely, oversold RSI levels are often viewed as signals to enter long positions or exit short ones. While RSI offers valuable insights, it’s important to note that trends can remain overbought or oversold for extended periods, making it essential for traders to combine RSI with other indicators for more reliable trend signals.
What is Relative Strength Index (RSI) Indicator and how to use it in trading
Average Directional Index (ADX)
The Average Directional Index (ADX) assesses the strength of a trend, regardless of its direction, on a scale from 0 to 100. Values above 25 typically indicate a strong trend, with strength increasing as the value approaches 100. In addition to the ADX line, two other lines—the positive directional indicator (+DI) and negative directional indicator (-DI)—are often plotted alongside it to identify the trend's direction.
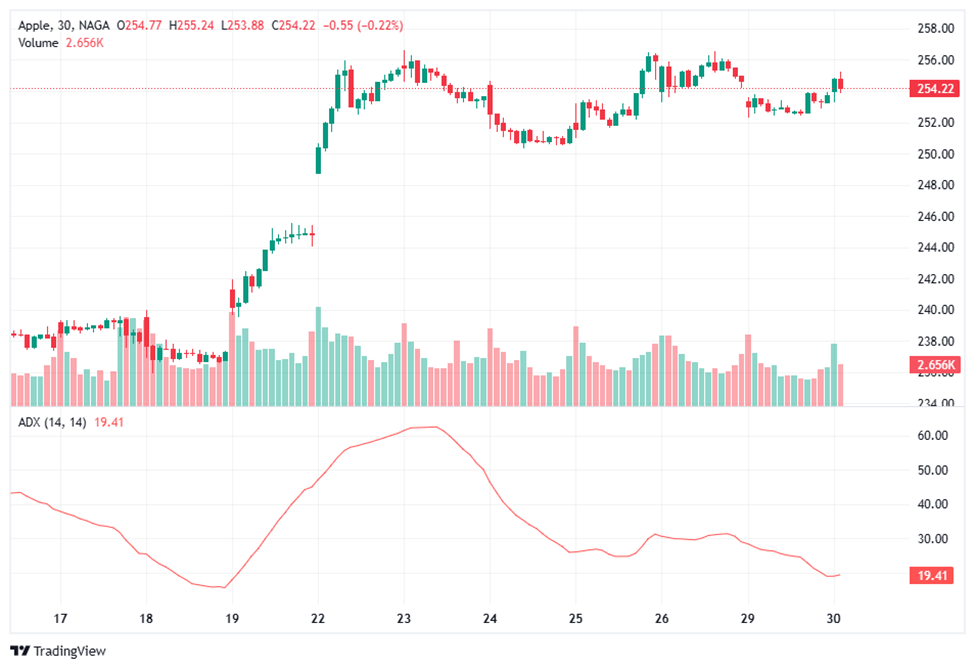
Past performance is not a reliable indicator of future results. All historical data, including but not limited to returns, volatility, and other performance metrics, should not be construed as a guarantee of future performance.
When the ADX is above 25 and +DI crosses above -DI, it signals a strengthening uptrend, which trend traders may interpret as a signal to go long. Conversely, if -DI crosses above +DI while the ADX remains above 25, it suggests a strong downtrend, ideal for short positions. By differentiating between trend strength and direction, the ADX allows traders to better assess trend durability and make more informed trading decisions.
What is Average Directional Index (ADX) Indicator and how to use it in trading
A table comparing Key Trend Trading Indicators and their use for Effective Market Analysis
Indicator Main Purpose How It Is Used Key Strengths Notes Bollinger Bands Identify overbought and oversold levels Three lines: 20-day SMA plus/minus 2 standard deviations Great for entry/exit points, especially in range-bound markets Used as entry/exit guides rather than standalone trend signals Moving Averages (MA) Determine overall trend direction Compare short- and long-term moving averages (e.g., 9-day and 14-day EMA) Confirms trend changes and improves timing of trades Time periods can be adjusted to fit strategy Relative Strength Index (RSI) Measure momentum and overbought/oversold conditions Scale from 0 to 100; above 70 is overbought, below 30 oversold Helps confirm entry/exit points Best combined with other indicators to avoid false signals Average Directional Index (ADX) Assess trend strength regardless of direction Values from 0-100; above 25 indicates strong trend, with +DI and -DI to determine direction Differentiates trend strength and direction for better trade decisions Helps evaluate trend durability and trade timing
What Risks Might Trend Trading Pose?
Before entering a trade, it’s essential to understand the potential risks associated with trend trading:
- Risk of Reversal. Trend trading assumes that a price movement will continue in its current direction. However, there is always the risk that a trend could reverse unexpectedly. If traders are on the wrong side of the reversal, they may experience significant losses.
- Oversold/Overbought Risk. Long-lasting trends can lead to an asset becoming overbought or oversold, meaning its price may become disconnected from its underlying value. Without effective risk management, trend traders may be vulnerable to a sharp price correction, potentially resulting in losses.
- Incorrect Signals. As with any indicator-based approach, trend trading can be impacted by false signals. These misleading indicators might not accurately reflect broader market sentiment, causing traders to take positions that don’t align with the actual trend and potentially leading to losses.
- Risk of Volatility. While trend trading generally focuses on long-term patterns rather than minor fluctuations, market volatility can still create sudden price swings that are difficult to predict. This can increase the risk of unexpected losses, especially if sharp reversals occur.
How to Start Trend Trading with Naga.com
- Open an Account. Create an account with Naga quickly and easily to get started with trend trading.
- Select a Trading Market. Choose a specific market to trade in; some trend traders focus on a single market, while others diversify across multiple markets to capture broader trends.
- Implement a Risk Management Plan. Use stops and limits to protect your trades. Limit orders help lock in profits, while stop-loss orders close out positions if the market moves against you. A solid risk management strategy is essential to handle potential trend reversals effectively.
Final words
Trend trading is a powerful strategy for traders aiming to capitalize on sustained market movements by identifying and following the direction of the trend. With the right indicators, such as Bollinger Bands, Moving Averages, the Relative Strength Index (RSI), and the Average Directional Index (ADX), traders can gain insights into market momentum and make informed decisions. Whether applied to short-term or long-term trades, these tools help traders recognize entry and exit points, as well as potential reversals, allowing for more calculated trading actions. However, successful trend trading requires a solid understanding of market dynamics and a keen eye on technical analysis.
Despite its potential for profit, trend trading also carries risks, including trend reversals, volatility, and the potential for misleading signals. To mitigate these risks, it’s essential to implement a robust risk management strategy that includes stop-losses, position sizing, and, where possible, diversification across different markets or assets. Platforms like Naga.com provide traders with the tools to explore trend trading strategies efficiently and effectively. By applying careful analysis and maintaining disciplined risk management, traders can approach trend trading with a balance of strategy and adaptability.
Trading tools
Before you start trend trading, you should consider using the educational resources we offer like NAGA Academy or a demo trading account. NAGA Academy has lots of free trading and investing courses for you to choose from, and they all tackle a different financial concept or process – like the basics of analyses – to help you to become a better trader or make more-informed investment decisions.
Our demo account is a suitable place for you to learn more about leveraged trading, and you’ll be able to get an intimate understanding of how CFDs work – as well as what it’s like to trade with leverage – before risking real capital. For this reason, a demo account with us is a great tool for investors who are looking to make a transition to leveraged trading.
Sources:
- https://www.cmegroup.com/education/courses/technical-analysis/trend-and-continuation-patterns.html
- https://www.cfainstitute.org/insights/professional-learning/refresher-readings/2024/trade-strategy-execution
- https://research.stlouisfed.org/wp/more/2011-001