


Precision and strategy are crucial for success in trading, and the neckline trading strategy offers a reliable approach for identifying key market reversals. This method enables traders—whether beginners or seasoned professionals—to pinpoint opportunities with confidence and execute trades effectively.
By highlighting high-probability setups, the neckline strategy provides traders with a structured framework for making informed decisions. When applied correctly, it enhances trading performance and fosters consistent results. Read on to discover how this strategy can become a valuable part of your trading toolkit.
Key Takeaways: Neckline Trading Strategy
- Necklines help technical analysts, traders, and investors identify potential uptrends and downtrends in asset prices.
- The neckline acts as a resistance level in an inverse head-and-shoulders pattern or as a support level in a standard head-and-shoulders pattern.
- Combining the neckline with other technical indicators and chart patterns provides confirmation of price trends and helps set target levels.
What is a Neckline?
A neckline is a trendline drawn beneath a head-and-shoulders pattern in technical analysis, helping traders identify potential buying or selling opportunities. It tracks the support and resistance levels formed during consolidation and reversal patterns, connecting the low points between the first two peaks of the head-and-shoulders design.
Traders use the neckline to pinpoint critical locations for placing orders. If the asset's price drops below the neckline, it may signal a reversal in the asset's price trend, offering key insights for decision-making.
Understanding Neckline Patterns Recognizing and Validating the Neckline The Role of Volume and Momentum To effectively use the neckline strategy, understanding the underlying price patterns is essential. The head-and-shoulders formation consists of a central peak (the "head") flanked by two smaller peaks (the "shoulders"), creating a distinctive shape. When the neckline—serving as a support or resistance level—is broken, it often signals a potential trend reversal, making it a crucial component of technical analysis. Accurate identification and confirmation of the neckline are critical for successful trading. The key moment occurs when prices approach the neckline: do they break through, signaling a reversal, or bounce back, continuing the trend? Confirmation relies on two main factors: a price close outside the neckline and significant changes in trading volume. Waiting for price consolidation further enhances the reliability of these signals. Volume and momentum are vital in the formation and validation of the neckline. Reduced volume during the pattern's peak formation, followed by increasing volume as the right shoulder develops, strengthens the reliability of the signal. Traders analyze these changes alongside price action to gauge market sentiment and momentum, guiding their trading decisions effectively. Some of the Best Trading Strategies for Beginners
Using Necklines with Head and Shoulders and Double Tops
The neckline is a vital element in technical analysis, enabling traders to anticipate trend reversals and identify potential price targets. By analyzing patterns such as the head and shoulders, inverse head and shoulders, and double top formations, traders can make strategic decisions based on clear market signals. Below, we delve into how these neckline patterns work and outline actionable steps for calculating price targets.
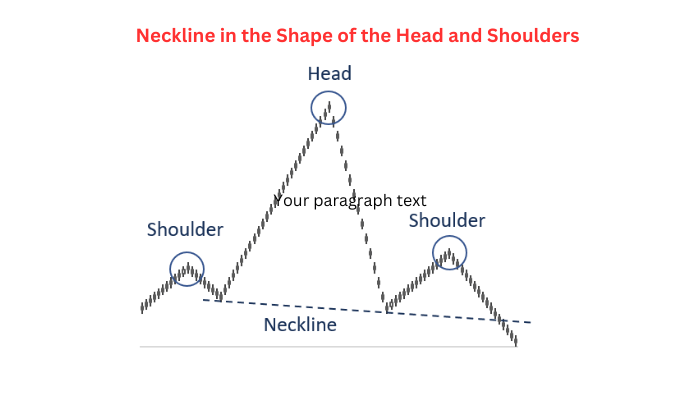
Neckline in the Shape of the Head and Shoulders
In a head and shoulders pattern, the price forms three peaks: a central higher peak (the head) flanked by two smaller peaks (the shoulders). The neckline connects the lowest points between these peaks during the trading session.
A price drop below the neckline following the third peak may signal a reversal of the uptrend, indicating that the asset price could decline further.
Volume trends are key to this pattern’s reliability. Warning signs include low volume during the head's rise and increased volume during the left shoulder’s formation. Similarly, reduced volume during the head’s fall and rising volume during the right shoulder’s decline further validate the pattern.
For illustrative purposes only
To estimate the price target:
- Measure the vertical distance between the neckline and the second peak (head).
- Locate the breakout point where the price crosses the neckline from the right shoulder.
- Subtract this distance from the breakout point to determine the potential downside target price.
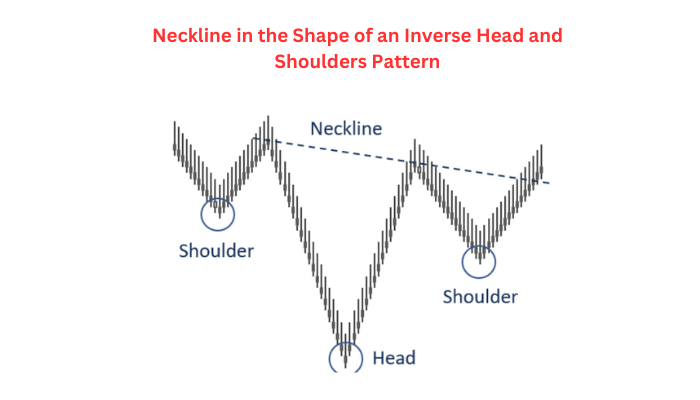
Neckline in the Shape of an Inverse Head and Shoulders Pattern
An inverse head and shoulders pattern is a mirror image of the head and shoulders. Here, the price forms three troughs: a deeper central trough (the head) and two shallower ones (the shoulders). The neckline connects the highest points between these troughs during the trading session.
A breakout above the neckline after the third trough suggests a reversal of the downtrend, indicating the potential for further price increases.
As with the head and shoulders, volume plays an essential role. Low volume during the head’s decline and rising volume during the right shoulder’s rise reinforce the validity of the inverse pattern.
For illustrative purposes only
To calculate the price target:
- Measure the vertical distance between the neckline and the second trough (head).
- Identify the breakout point where the price crosses above the neckline from the right shoulder.
- Add this distance to the breakout point to predict the potential upward target price.
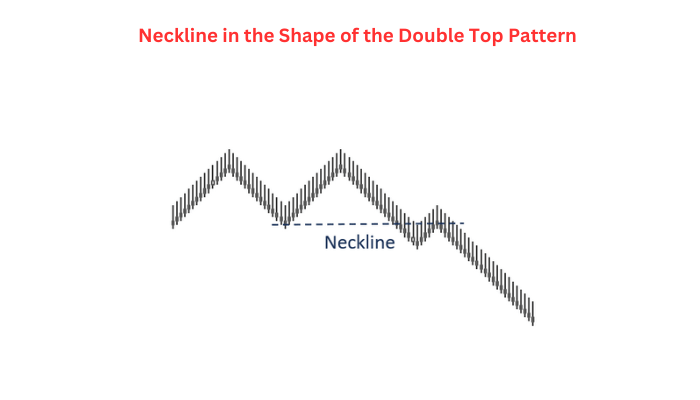
Neckline in the Shape of the Double Top Pattern
A double top pattern forms when the price tests a resistance level twice but fails to break through, creating two peaks separated by a dip. The neckline connects the first dip and the third peak in this pattern.
A break below the neckline after the second peak suggests a potential reversal of the uptrend, signaling that the price may continue to drop.
In contrast, a double bottom pattern forms when the price tests a support level twice and bounces back, indicating a potential uptrend reversal.
For illustrative purposes only
To estimate the price target for a double top pattern:
- Measure the vertical distance between the neckline and the peaks.
- Determine the breakout point where the price crosses below the neckline.
- Subtract the measured distance from the breakout point to predict the potential downside price target.
Comparison of Neckline Patterns in Head and Shoulders, Inverse Head and Shoulders, and Double Top Formations
Pattern Neckline Description Signal Type Volume Role Price Target Calculation Head and Shoulders Connects lowest points between three peaks Bearish reversal Volume should increase on left shoulder drop and right shoulder decline to confirm Measure distance from neckline to head peak, subtract from breakout point below neckline Inverse Head and Shoulders Connects highest points between three troughs Bullish reversal Volume increases during right shoulder rise, confirming breakout Measure distance from neckline to head trough, add to breakout point above neckline Double Top Connects dip between two peaks Bearish reversal Confirmed by volume change during breakout Measure distance from neckline to peaks, subtract from breakout point below neckline How to trade the Head and Shoulders How to trade Double Top & Double Bottoms
By integrating these strategies, traders can effectively use neckline patterns to interpret market trends and optimize their trading performance.
Refining Trading Techniques with Advanced Neckline Analysis
Expanding upon the foundation of neckline strategies, traders can further enhance their approach by integrating additional layers of analysis and refining their techniques for more consistent outcomes. Below, we delve into methods that complement the neckline strategy and address key elements for improved decision-making.
Leveraging Dynamic Support and Resistance Zones
Beyond the static levels identified by necklines, analyzing dynamic support and resistance zones can provide deeper insights into price movements. These zones account for:
- Shifting Market Conditions: Adapting to gradual changes in price trends.
- Volatility Levels: Identifying key areas where price interactions are likely to occur.
- Price Consolidation Patterns: Understanding how accumulation and distribution influence breakout or breakdown opportunities.
By mapping these zones in conjunction with neckline formations, traders can refine their entry and exit strategies while minimizing risks.
How To Trade Based on Support and Resistance Levels
Combining Neckline Patterns with Trend-Based Strategies
Traders who integrate neckline formations into broader trend-following or trend-reversal strategies can optimize their performance. This involves:
- Identifying the prevailing market trend to align trades with momentum.
- Using neckline breaks as confirmation of trend continuation or reversal.
- Tracking momentum indicators, such as MACD or ADX, to validate trend strength.
This synthesis enables traders to operate within a structured framework that leverages both pattern recognition and trend dynamics.
Learn More About Trend Trading Strategies
Adapting Strategies for Different Market Scenarios
Successful trading requires flexibility, particularly when dealing with varying market conditions such as:
- Ranging Markets: Where neckline patterns may indicate boundaries for range trading.
- Breakout Markets: Where significant price movements often follow neckline confirmations.
- High-Volatility Events: Requiring quick adaptation of stop-loss and profit targets based on market reactions.
By tailoring neckline strategies to these scenarios, traders can maintain agility and improve performance across diverse trading environments.
Learn More About Range Trading Strategies
Refining trading strategies with advanced neckline analysis equips traders with a robust toolkit to navigate complex market conditions. By leveraging dynamic support and resistance, integrating trend-based strategies, and adapting to varying scenarios, traders can maximize opportunities while minimizing risks.
An Example of Neckline Trading Strategies
Let's say the current EUR/USD price is 1.1710. On the price chart, a head and shoulders pattern begins to form. The middle peak (the head) is higher than the first and third peaks (the shoulders). Connecting the lows of the first and second shoulders forms the neckline, which serves as a key level of support. Below are the steps to execute a trade using this neckline strategy:
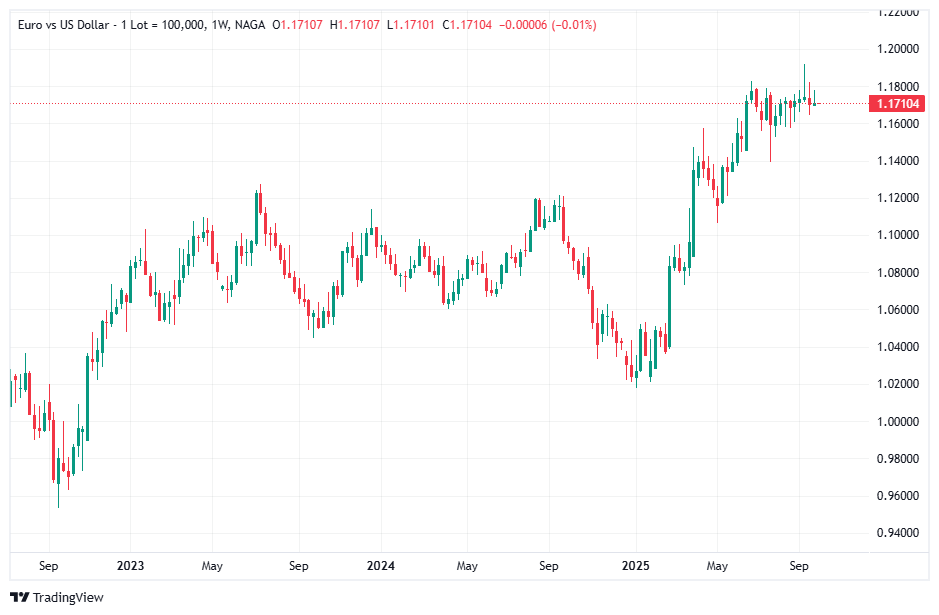
Past performance is not a reliable indicator of future results. All historical data, including but not limited to returns, volatility, and other performance metrics, should not be construed as a guarantee of future performance.
1). Identify the Pattern and Neckline
- Look for the head and shoulders pattern on the chart, with the head (second peak) higher than the shoulders (first and third peaks).
- Draw the neckline by connecting the lowest points between the shoulders. This line helps identify a potential trend reversal.
2). Monitor for a Breakout
- Wait for the price to break below the neckline, signaling a potential downward trend. For example, a price drop below 1.1690 could indicate the start of a reversal.
3). Confirm the Breakout
- Use increased trading volume to confirm the breakout. Higher trading volume during the price drop provides stronger evidence of a genuine breakout, reducing the risk of false signals.
4). Set Entry and Exit Points
- If the breakout is confirmed, consider taking a short position (betting the price will fall).
- To calculate the target price, measure the height of the pattern (distance from the neckline to the head).
For example, if the neckline is at 1.1690 and the head peaks at 1.1790, the pattern height is 100 pips.
Subtract this height from the neckline level (1.1690 - 0.0100 = 1.1590), making 1.1590 a potential target price.
5). Apply Risk Management
Always set a stop-loss order to limit potential losses. For instance:
- Place the stop-loss slightly above the neckline, such as 1.1700, to protect against a false breakout where the price rebounds above the neckline.
By following these steps, traders can use the neckline as a guide to identify, confirm, and execute trades effectively, ensuring both precision and risk management.
How to Trade Neckline with Naga.com
- Open an Account: Start by creating an account with Naga, a straightforward and quick process. Once registered, you’ll gain access to a comprehensive trading platform equipped with tools to identify and trade neckline patterns effectively.
- Select a Trading Market: Choose a market where neckline patterns are likely to appear, such as forex, stocks, or commodities. Traders can focus on a specific asset or diversify across markets to find the best opportunities for trading neckline patterns.
- Implement a Risk Management Plan: Use stop-loss and take-profit orders to manage risk and secure gains while trading neckline patterns.
Conclusion
The neckline trading strategy is built on the key technical analysis concept of the neckline—a trendline drawn beneath a head-and-shoulders pattern that helps traders identify potential buying or selling opportunities. By analyzing patterns like head and shoulders or double tops, traders can spot trend reversals, set price targets, and make informed decisions. When combined with other technical indicators, this approach provides a solid framework for navigating complex financial markets.
Mastering the neckline trading strategy requires consistent practice, sharp analytical skills, and sound risk management. Whether trading currencies, stocks, or cryptocurrencies, traders can protect their positions with tools like stop-loss and take-profit orders. By incorporating neckline analysis into a comprehensive trading plan, traders could better capitalize on market opportunities and could achieve sustainable success.
Free resources
Before you start a neckline trading strategy, you should consider using the educational resources we offer like NAGA Academy or a demo trading account. NAGA Academy has lots of free trading courses for you to choose from, and they all tackle a different financial concept or process – like the basics of analyses – to help you to become a better trader or make more-informed investment decisions.
Our demo account is a suitable place for you to learn more about leveraged trading, and you’ll be able to get an intimate understanding of how CFDs work – as well as what it’s like to trade with leverage – before risking real capital. For this reason, a demo account with us is a great tool for investors who are looking to make a transition to leveraged trading.
Sources:
- https://www.cmegroup.com
- https://corporatefinanceinstitute.com
- https://research.stlouisfed.org/wp/more/2011-001


