1. Home
  2. Markets Updates
  3. XAUUSD Technical Outlook: Fibonacci Levels Signal Potential Gold Rebound

XAUUSD Technical Outlook: Fibonacci Levels Signal Potential Gold Rebound

24 April 2025

Share the article:

XAUUSD_ProH4_24_April.png

Past performance is not indicative of future results. All historical data, including but not limited to returns, volatility, and other performance metrics, should not be construed as a guarantee of future performance.
XAUUSD on a 4-hour timeframe.  

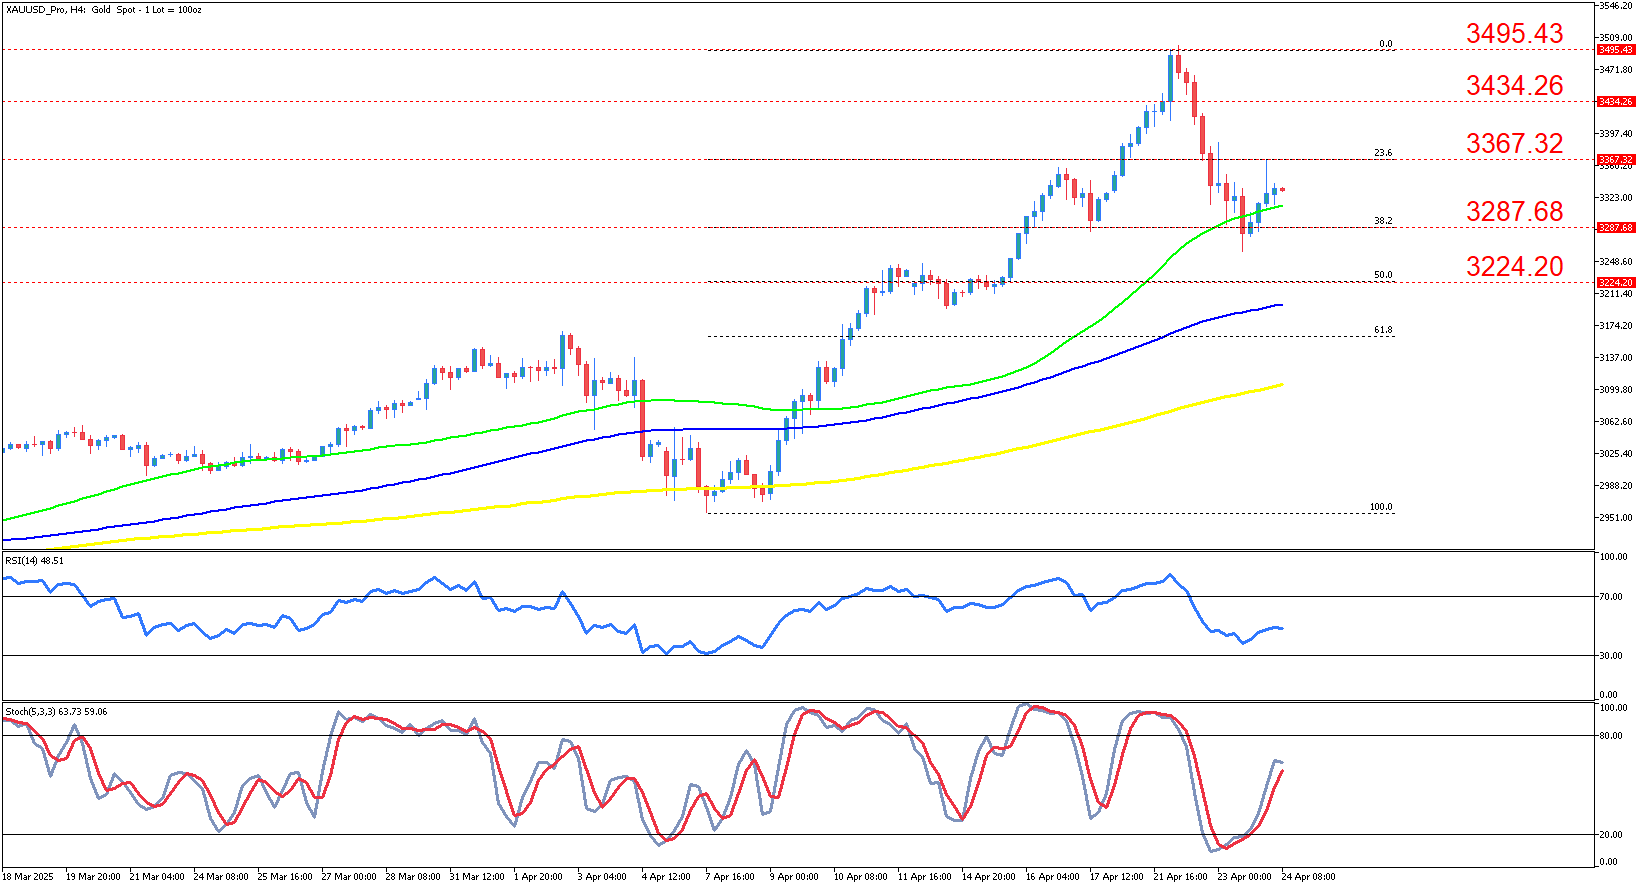
XAUUSD on a 4-hour timeframe. The gold spot price has experienced a strong upward movement from early April 2025, following a period of consolidation that began in late March. The price action broke through multiple resistance levels as it rallied, forming higher highs and higher lows, until encountering strong resistance near the 3495.43 level. This bullish momentum was supported by broader market risk aversion and geopolitical tensions, which traditionally favor gold as a safe-haven asset. 

In the most recent sessions, gold prices have retraced from the peak of 3495.43 and are currently hovering around the 3367.32 level, just above the 23.6% Fibonacci retracement level. The price recently rebounded from the 3287.68 level, which aligns with the 38.2% Fibonacci retracement, suggesting this zone may act as a near-term support. The 50-period moving average (green) has provided dynamic support, while the 100-period (blue) and 200-period (yellow) moving averages remain below, confirming the medium-term bullish trend. 

The Relative Strength Index (RSI) is currently at 48.51, indicating a neutral momentum after previously declining from overbought levels. This suggests that the market is in a state of consolidation following the recent sell-off. Meanwhile, the Stochastic Oscillator has recently crossed upward from oversold territory, which could be an early signal of renewed buying interest, though further confirmation is needed. 

The main scenario envisions a continuation of the upward trend if gold manages to hold above the 3287.68 support zone and break above the 3367.32 resistance. In this case, the price could attempt to retest the 3434.26 and possibly the 3495.43 high. This scenario would be supported by ongoing geopolitical risks or weaker-than-expected macroeconomic data, particularly from the United States. 

An alternative scenario would see XAUUSD breaking below the 3287.68 level, which could open the path to further downside towards the 3224.20 support and the 50% Fibonacci level. Such a move could be triggered by stronger U.S. economic data or a shift in investor sentiment away from safe-haven assets, possibly due to a reduction in Middle East tensions or a hawkish shift in Federal Reserve communication. 

Gold remains fundamentally supported by persistent global economic uncertainty, robust central bank demand, and ongoing geopolitical risks. Inflationary pressures and expectations for US monetary policy shifts continue to shape gold’s outlook. The market is also sensitive to signals from the Federal Reserve regarding interest rates, as lower rates typically boost gold’s appeal by reducing the opportunity cost of holding non-yielding assets. Additionally, major political developments—especially those related to US economic and foreign policy—can rapidly influence gold prices by affecting risk sentiment and the US dollar.  

SUMMARY:  

  • Bullish Rally: XAUUSD surged from early April 2025, breaking through key resistance levels until reaching 3495.43, driven by geopolitical tensions and market risk aversion. 
  • Current Retracement: Gold has pulled back to 3367.32, testing the 23.6% Fibonacci retracement level, with support seen around 3287.68 (38.2% Fibonacci). 
  • Technical Indicators: The RSI sits at 48.51, signaling neutral momentum, while the Stochastic Oscillator suggests potential for renewed buying interest. 
  • Outlook: A break above 3367.32 could push gold higher, while a fall below 3287.68 may lead to a deeper retracement towards 3224.20. 
IMPORTANT NOTICE: Any news, opinions, research, analyses, prices or other information contained in this article are provided as general market commentary and do not constitute investment advice. The market commentary has not been prepared in accordance with legal requirements designed to promote the independence of investment research, and therefore, it is not subject to any prohibition on dealing ahead of dissemination. Past performance is not an indication of possible future performance. Any action you take upon the information in this article is strictly at your own risk, and we will not be liable for any losses and damages in connection with the use of this article.
RISK WARNING: CFDs are complex instruments and come with a high risk of losing money rapidly due to leverage. A high percentage of retail client investors lose money when trading CFDs with this provider. You should consider whether you understand how CFDs work and whether you can afford to take the high risk of losing your money.

Related articles

SPX500 Gears for 6000 Breakout: Hidden Bullish Divergence & EMA Support Intact
5 June 2025
SPX500 consolidates below 6000 with bullish structure intact. Hidden divergence and EMA support suggest breakout potential.

Read more

XAUUSD Coils Between 3170 and 3300: Is a Breakout Brewing?
29 May 2025
XAUUSD faces a critical test as gold trades between key levels of 3170 and 3300. Explore the latest price action, technical signals, and what traders should watch ahead of the upcoming U.S. inflation data.

Read more

Gold’s Tug of War: Bulls Fight for $3,300 Breakout
22 May 2025
Gold hovers near $3,300 resistance as momentum wavers. Key support levels and geopolitical risks shape XAUUSD’s short-term outlook in 2025.

Read more

Need Help? Visit our Help Section
Download NAGA Trader

Copyright © 2024 – All rights reserved.

NAGA is a trademark of The NAGA Group AG, a German based FinTech company publicly listed on the Frankfurt Stock Exchange | WKN: A161NR | ISIN: DE000A161NR7.

The website is operated by JME Financial Services (Pty) Ltd an authorised Financial Services Provider, regulated by the Financial Sector Conduct Authority in South Africa under license no. 37166. JME Financial Services (Pty) Ltd is located at Suite 10, 21 Lighthouse Rd 201 Beacon Rock, Umhlanga Rocks, Kwa-Zulu Natal, 4320, South Africa.

JME Financial Services (Pty) Ltd acts as an intermediary between the investor and NAGA Capital Ltd, the counterparty to the contract for difference purchased by the Investor via Naga.com/za. NAGA Capital Ltd is authorised and regulated by the Financial Services Authority Seychelles (FSA) under licence No. SD026. NAGA Capital Ltd is the principal to the CFD purchased by investors on this website. Other group entities: NAGA Markets Europe LTD which is authorised and regulated by the Cyprus Securities and Exchange Commission (CySEC) under licence No. 204/13.

RISK WARNING: Derivatives are complex instruments and come with a high risk of losing money rapidly due to leverage. You should consider whether you understand how derivatives work and whether you can afford to take the high risk of losing your money. The value of financial products can increase as well as decrease over time, depending on the value of the underlying securities and market conditions. Illustrations, forecasts or hypothetical data are not guaranteed and are provided for illustrative purposes only. JME Financial Services (Pty) Ltd does not render advice in respect of the CFD’s offered on this website. Before making an investment decision, you should rely on your own assessment. The Company’s disclaimer, conflict of interest policy are available on legal documents section.

Trading with NAGA Trader by following and/or copying or replicating the trades of other traders involves high levels of risks, even when following and/or copying or replicating the top-performing traders. Such risks include the risk that you may be following/copying the trading decisions of possibly inexperienced/unprofessional traders, or traders whose ultimate purpose or intention, or financial status may differ from yours. Before making an investment decision, you should rely on your own assessment of the person making the trading decisions and the terms of all the legal documentation.