1. Home
  2. Markets Updates
  3. XAUUSD Coils Between 3170 and 3300: Is a Breakout Brewing?

XAUUSD Coils Between 3170 and 3300: Is a Breakout Brewing?

29 May 2025

Share the article:

XAUUSD_ProDaily_22_May (1).png


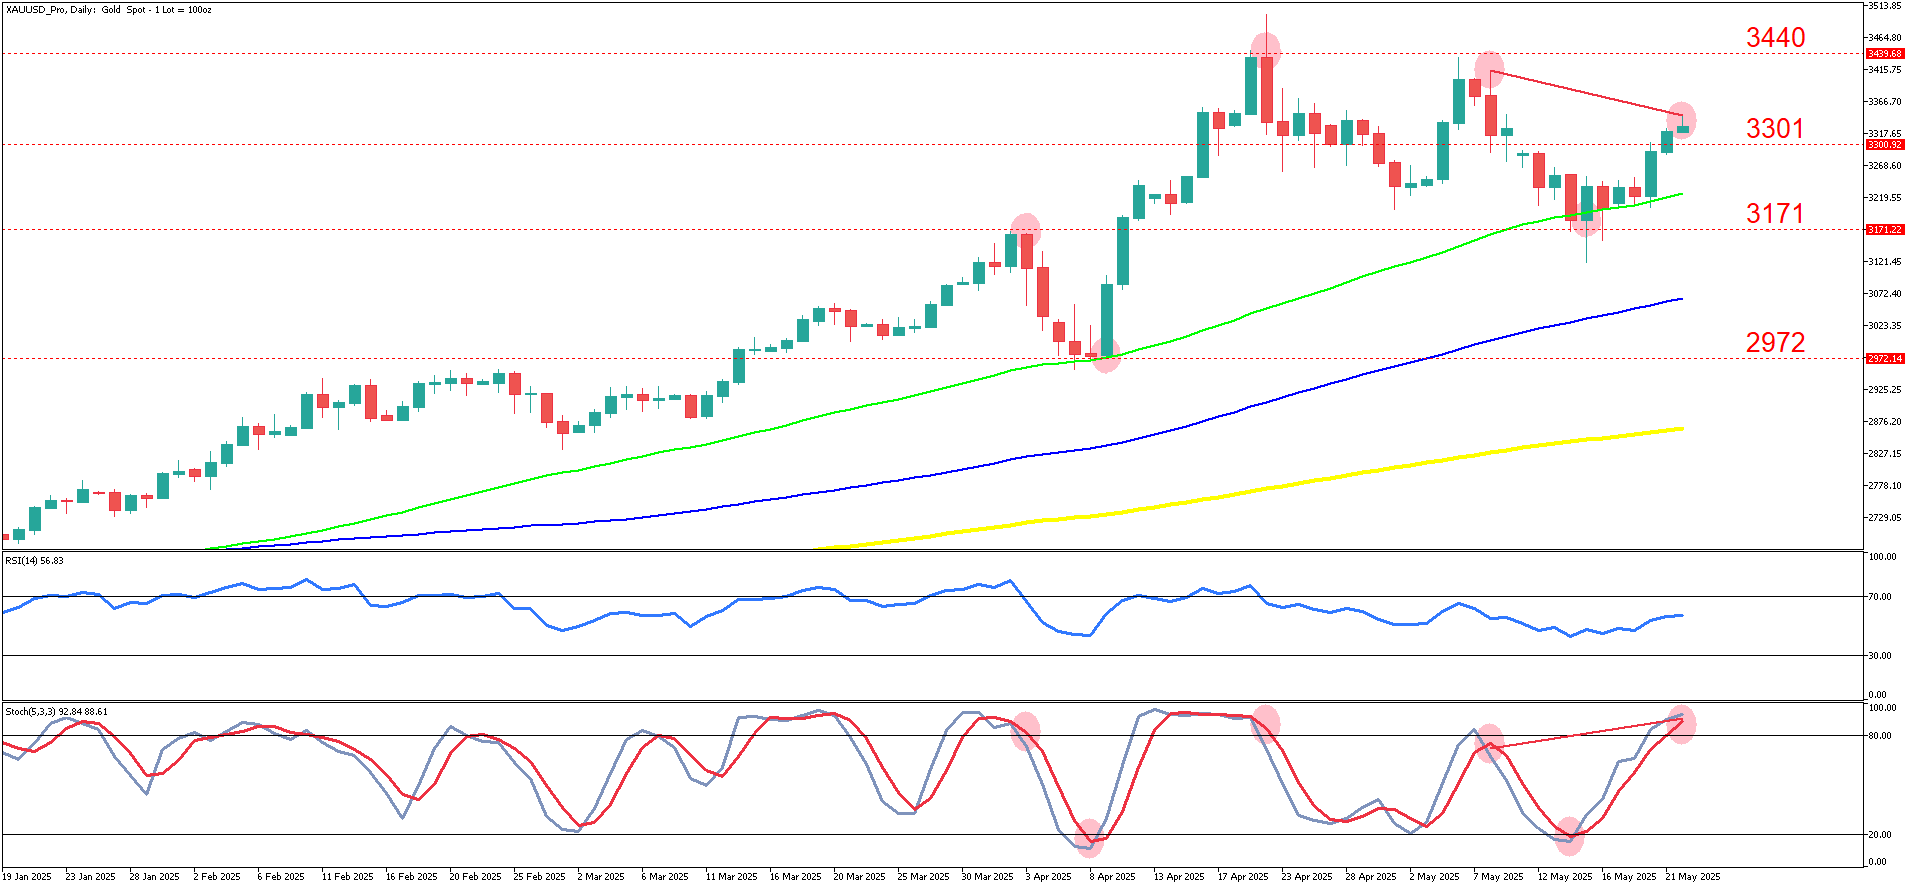
XAUUSD on a daily timeframe. 
 

Gold has experienced a strong bullish trend from early February to mid-April 2025, with a notable acceleration in late March that peaked near the 3440 level. This rally was followed by a sharp correction, with resistance established around 3440 and 3300. Since then, price action has shown signs of consolidation between the 3300 and 3170 zones, with a significant bounce occurring off the 50-day moving average.
 

Recent candles reveal indecision, with multiple small-bodied candles clustered just above the 50-day moving average (green line), highlighting a battle between buyers and sellers near the 38.2% Fibonacci retracement level. This suggests a stalling of bullish momentum after the strong upward leg. Sellers have managed to cap upside moves near 3300 while buyers are defending the 3170 support.
 

Indicators provide mixed signals. The RSI stands near the neutral 50 mark, showing neither overbought nor oversold conditions, indicating a lack of clear momentum. The stochastic oscillator, however, is exiting overbought territory and turning lower, hinting at near-term bearish pressure. Price has bounced off the 50-day moving average multiple times, reinforcing it as a key dynamic support. The 3170 and 3300 levels are now well-defined horizontal support and resistance zones, while 3440 marks a key barrier above.
 

The primary scenario suggests that if bulls hold the 3170 support zone and reclaim 3300, a retest of the 3440 resistance is likely. Sustained buying above 3440 could re-energize the rally and open the path toward the 3634 Fibonacci extension target. Continuation will likely need a catalyst such as dovish economic data or further dollar weakness.
 

Alternatively, if 3170 fails as support, bearish momentum may accelerate, targeting the 61.8% Fibonacci retracement at 3170 and potentially the 100% retracement level near 2956. A close below the green 100-day moving average could confirm a bearish reversal and shift sentiment decisively toward the downside.
 

Based on current news (as of May 29, 2025), gold has been reacting to recent U.S. macroeconomic indicators including mixed GDP growth data and softening inflation metrics. This has supported expectations that the Federal Reserve may hold rates steady or cut later in the year, which generally benefits gold. However, the market remains cautious ahead of the PCE inflation data release due on May 31, which could significantly affect rate expectations and gold sentiment. Additionally, developments in geopolitical tensions in Eastern Europe and continued central bank gold purchases have lent underlying support to gold prices this week.
 

Summary: 


  • Gold (XAUUSD) is consolidating between 3170 support and 3300 resistance after a strong Feb–April rally peaked near 3440. 
  • Price action is hovering above the 50-day moving average, with small-bodied candles and signs of indecision at the 38.2% Fibonacci retracement. 
  • Momentum indicators are mixed: RSI is neutral near 50, while the Stochastic is turning down from overbought—hinting at short-term bearish pressure. 
  • Outlook depends on key catalysts like PCE inflation data and Fed policy; a break above 3300 could target 3440/3634, while a drop below 3170 opens risk toward 2956. 


IMPORTANT NOTICE: Any news, opinions, research, analyses, prices or other information contained in this article are provided as general market commentary and do not constitute investment advice. The market commentary has not been prepared in accordance with legal requirements designed to promote the independence of investment research, and therefore, it is not subject to any prohibition on dealing ahead of dissemination. Past performance is not an indication of possible future performance. Any action you take upon the information in this article is strictly at your own risk, and we will not be liable for any losses and damages in connection with the use of this article.
RISK WARNING: CFDs are complex instruments and come with a high risk of losing money rapidly due to leverage. A high percentage of retail client investors lose money when trading CFDs with this provider. You should consider whether you understand how CFDs work and whether you can afford to take the high risk of losing your money.

Related articles

Gold’s Tug of War: Bulls Fight for $3,300 Breakout
22 May 2025
Gold hovers near $3,300 resistance as momentum wavers. Key support levels and geopolitical risks shape XAUUSD’s short-term outlook in 2025.

Read more

EURUSD: Bulls Battle Back, But Can They Break 1.1570?
15 May 2025
EURUSD shows signs of bullish recovery, but can it sustain momentum above 1.1570? Discover key support, resistance levels, and market drivers in this in-depth analysis.

Read more

GBP/USD Faces Key Resistance at 1.3428: Will Bulls Break Through or Stall?
8 May 2025
GBPUSD daily: Strong recovery from 1.2200, consolidating between 1.3254-1.3428. Key breakout or pullback ahead with BOE decision and trade updates.

Read more

Need Help? Visit our Help Section
Download NAGA Trader

Copyright © 2024 – All rights reserved.

NAGA is a trademark of The NAGA Group AG, a German based FinTech company publicly listed on the Frankfurt Stock Exchange | WKN: A161NR | ISIN: DE000A161NR7.

The website is operated by JME Financial Services (Pty) Ltd an authorised Financial Services Provider, regulated by the Financial Sector Conduct Authority in South Africa under license no. 37166. JME Financial Services (Pty) Ltd is located at Suite 10, 21 Lighthouse Rd 201 Beacon Rock, Umhlanga Rocks, Kwa-Zulu Natal, 4320, South Africa.

JME Financial Services (Pty) Ltd acts as an intermediary between the investor and NAGA Capital Ltd, the counterparty to the contract for difference purchased by the Investor via Naga.com/za. NAGA Capital Ltd is authorised and regulated by the Financial Services Authority Seychelles (FSA) under licence No. SD026. NAGA Capital Ltd is the principal to the CFD purchased by investors on this website. Other group entities: NAGA Markets Europe LTD which is authorised and regulated by the Cyprus Securities and Exchange Commission (CySEC) under licence No. 204/13.

RISK WARNING: Derivatives are complex instruments and come with a high risk of losing money rapidly due to leverage. You should consider whether you understand how derivatives work and whether you can afford to take the high risk of losing your money. The value of financial products can increase as well as decrease over time, depending on the value of the underlying securities and market conditions. Illustrations, forecasts or hypothetical data are not guaranteed and are provided for illustrative purposes only. JME Financial Services (Pty) Ltd does not render advice in respect of the CFD’s offered on this website. Before making an investment decision, you should rely on your own assessment. The Company’s disclaimer, conflict of interest policy are available on legal documents section.

Trading with NAGA Trader by following and/or copying or replicating the trades of other traders involves high levels of risks, even when following and/or copying or replicating the top-performing traders. Such risks include the risk that you may be following/copying the trading decisions of possibly inexperienced/unprofessional traders, or traders whose ultimate purpose or intention, or financial status may differ from yours. Before making an investment decision, you should rely on your own assessment of the person making the trading decisions and the terms of all the legal documentation.