1. Home
  2. Markets Updates
  3. USD/JPY Plunges Toward 150.000 – Breakdown or Big Rebound?

USD/JPY Plunges Toward 150.000 – Breakdown or Big Rebound?

20 February 2025

Share the article:

USDJPY'H4_20_Feb.png
USD/JPY on a 4-hour timeframe 

USD/JPY approaching 150.000, will it break or bounce? 

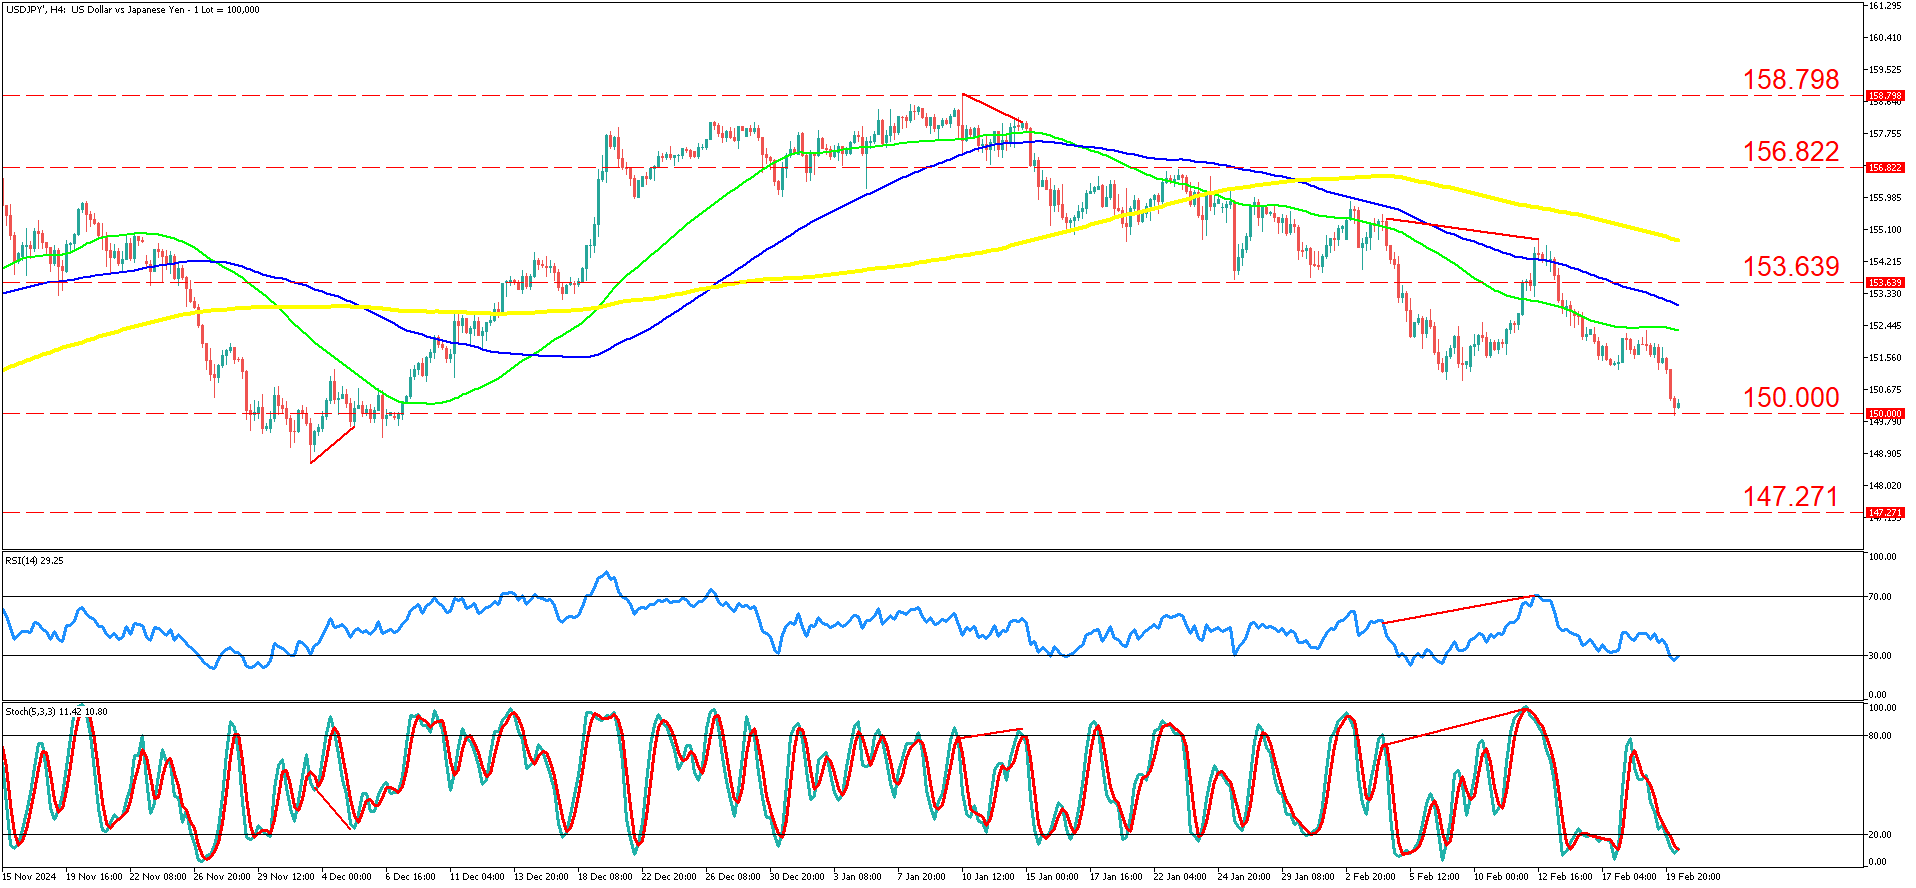
USD/JPY on a 4-hour timeframe has exhibited a significant downtrend following a prolonged consolidation phase near the 153.639 resistance level. The pair previously attempted to break above this level but faced rejection, leading to a downward move. Prior to the decline, the price traded in a tight range, supported by the 50-period moving average (green) before breaking below it, triggering further bearish momentum. The price is now approaching the psychological support level at 150.000, which has historically acted as a key area of interest. 

In recent price action, USD/JPY has continued its downward trajectory, with successive lower highs and lower lows confirming the bearish structure. The pair is currently testing the 150.000 support level, and a break below this region could accelerate selling pressure. The moving averages confirm the bearish outlook, as the 50-period (green), 100-period (blue), and 200-period (yellow) moving averages are positioned in descending order, signaling a strong downtrend. 

Momentum indicators suggest oversold conditions, with the 14-period RSI hovering around 29, indicating that the asset may be reaching exhaustion in the short term. The Stochastic oscillator also signals extreme oversold conditions, with both %K and %D lines trending near the lower bound, reinforcing the possibility of a short-term corrective bounce. However, bearish divergence observed earlier indicates underlying weakness in buying pressure. 

The primary scenario favors a continuation of the bearish trend if USD/JPY breaks and closes below the 150.000 support level. In this case, further downside toward 147.271 could be expected, a key level of historical support. Given the strong bearish momentum, sellers are likely to remain in control unless a strong bullish catalyst emerges. 

The alternative scenario considers a corrective bounce if buyers defend the 150.000 support level. A rebound from this area could push the price back toward the 153.639 resistance zone, aligning with the 50-period moving average. However, sustained buying pressure would be needed to challenge the higher resistance levels at 156.822 and 158.798. 

Traders should remain cautious as USD/JPY faces heightened volatility driven by diverging monetary policy expectations and key economic data. Japan’s stronger-than-expected Q4 GDP growth (0.7% vs. 0.3% forecast) and rising core inflation (2.5% YoY in Tokyo) have reinforced expectations of BoJ tightening, with markets eyeing a potential rate hike as early as March. Meanwhile, the Fed’s dovish stance contrasts with the BoJ’s hawkish tilt, adding downward pressure on USD/JPY. Key events ahead include Japan’s national inflation data on Friday, Shuntō wage negotiations, and potential BoJ policy signals, all of which could accelerate yen strength. Additionally, Fed minutes and statements emphasizing a prolonged pause may cap USD upside. Market sentiment leans bearish, with risks skewed toward further yen appreciation if upcoming data and policy signals align with tightening expectations. 

Summary:

  • Key Resistance and Support: The USD/JPY pair is trading near the 150.000 psychological support level after failing to break above the 153.639 resistance. 
  • Bearish Technicals: A downtrend is confirmed by successive lower highs/lows, descending moving averages, and oversold momentum indicators like RSI and Stochastic. 
  • Potential Scenarios: A break below 150.000 may drive prices to 147.271, while a bounce could push the pair back toward 153.639 and higher resistance levels. 
  • Economic Catalysts: Upcoming economic events, including Japan's inflation data and BoJ policy signals, alongside contrasting Fed stances, are key to the pair’s future direction
IMPORTANT NOTICE: Any news, opinions, research, analyses, prices or other information contained in this article are provided as general market commentary and do not constitute investment advice. The market commentary has not been prepared in accordance with legal requirements designed to promote the independence of investment research, and therefore, it is not subject to any prohibition on dealing ahead of dissemination. Past performance is not an indication of possible future performance. Any action you take upon the information in this article is strictly at your own risk, and we will not be liable for any losses and damages in connection with the use of this article.
RISK WARNING: CFDs are complex instruments and come with a high risk of losing money rapidly due to leverage. A high percentage of retail client investors lose money when trading CFDs with this provider. You should consider whether you understand how CFDs work and whether you can afford to take the high risk of losing your money.

Related articles

SPX500 Gears for 6000 Breakout: Hidden Bullish Divergence & EMA Support Intact
5 June 2025
SPX500 consolidates below 6000 with bullish structure intact. Hidden divergence and EMA support suggest breakout potential.

Read more

XAUUSD Coils Between 3170 and 3300: Is a Breakout Brewing?
29 May 2025
XAUUSD faces a critical test as gold trades between key levels of 3170 and 3300. Explore the latest price action, technical signals, and what traders should watch ahead of the upcoming U.S. inflation data.

Read more

Gold’s Tug of War: Bulls Fight for $3,300 Breakout
22 May 2025
Gold hovers near $3,300 resistance as momentum wavers. Key support levels and geopolitical risks shape XAUUSD’s short-term outlook in 2025.

Read more

Need Help? Visit our Help Section
Download NAGA Trader

Copyright © 2024 – All rights reserved.

NAGA is a trademark of The NAGA Group AG, a German based FinTech company publicly listed on the Frankfurt Stock Exchange | WKN: A161NR | ISIN: DE000A161NR7.

The website is operated by JME Financial Services (Pty) Ltd an authorised Financial Services Provider, regulated by the Financial Sector Conduct Authority in South Africa under license no. 37166. JME Financial Services (Pty) Ltd is located at Suite 10, 21 Lighthouse Rd 201 Beacon Rock, Umhlanga Rocks, Kwa-Zulu Natal, 4320, South Africa.

JME Financial Services (Pty) Ltd acts as an intermediary between the investor and NAGA Capital Ltd, the counterparty to the contract for difference purchased by the Investor via Naga.com/za. NAGA Capital Ltd is authorised and regulated by the Financial Services Authority Seychelles (FSA) under licence No. SD026. NAGA Capital Ltd is the principal to the CFD purchased by investors on this website. Other group entities: NAGA Markets Europe LTD which is authorised and regulated by the Cyprus Securities and Exchange Commission (CySEC) under licence No. 204/13.

RISK WARNING: Derivatives are complex instruments and come with a high risk of losing money rapidly due to leverage. You should consider whether you understand how derivatives work and whether you can afford to take the high risk of losing your money. The value of financial products can increase as well as decrease over time, depending on the value of the underlying securities and market conditions. Illustrations, forecasts or hypothetical data are not guaranteed and are provided for illustrative purposes only. JME Financial Services (Pty) Ltd does not render advice in respect of the CFD’s offered on this website. Before making an investment decision, you should rely on your own assessment. The Company’s disclaimer, conflict of interest policy are available on legal documents section.

Trading with NAGA Trader by following and/or copying or replicating the trades of other traders involves high levels of risks, even when following and/or copying or replicating the top-performing traders. Such risks include the risk that you may be following/copying the trading decisions of possibly inexperienced/unprofessional traders, or traders whose ultimate purpose or intention, or financial status may differ from yours. Before making an investment decision, you should rely on your own assessment of the person making the trading decisions and the terms of all the legal documentation.