1. Home
  2. Markets Updates
  3. US30 Soars to New Heights: Navigating Volatility Ahead

US30 Soars to New Heights: Navigating Volatility Ahead

Dive into the analysis of US30 market trends, identifying all-time highs, trading ranges, and potential breakouts.

8 February 2024

Share the article:

US30_ProH1.png

US30 1-Hour Timeframe, 08 February 2024


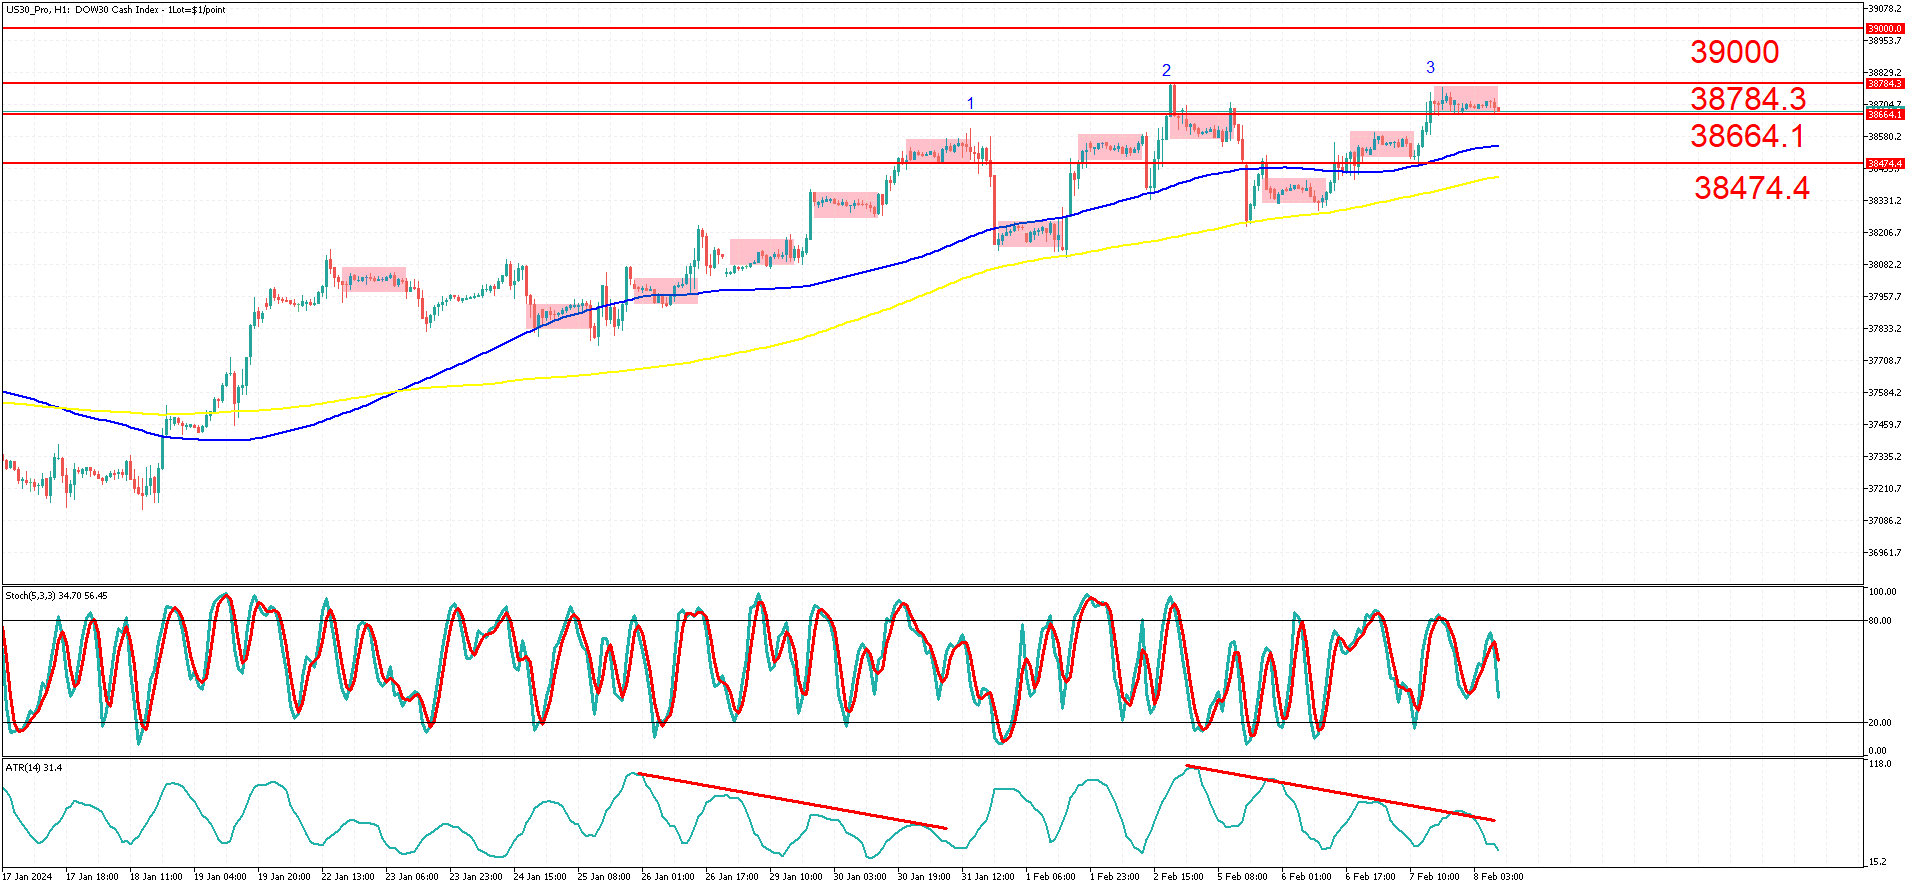
The US30 on a 1-hour timeframe has moved in a volatile uptrend since the recent low plotted on 18 January. On 2 February, the US30 reached a new all-time high of 38 784.3. This move dethroned the 31 January all-time high at 38 609.2.

Observing the striking resemblances between all-time highs (or any price action closely resembling them) is intriguing. Notably, the all-time high on January 31 (marked as blue 1) and the one on February 2 (marked as blue 2) stand out. Following each of these instances, there was a sharp decline in price action immediately after reaching a new high.

Currently, the market trades at 38 693 and is caught in a range (depicted by a pink square). One can observe this consistent behavior in the US30, where the market forms small trading ranges, followed by solid breakouts, with 90% of the recent breakouts being in line with the predominant uptrend.

The 200- and 100-period simple moving averages confirm the uptrend, with the 100-period SMA above the 200-period SMA. These averages also act as strong dynamic support and resistance levels.

Although the primary trend, and therefore the main bias, is to the upside, we need to be cautious of the fact that a small move to the upside in US30 will likely form a new all-time high, which might be prone to much higher volatility and in many cases a subsequent reversal lower.

When looking at our ATR (Average True Range) Indicator, it seems that the current volatility has been steadily reducing over the past few days, as one can observe right before the 31 January High (marked as blue 1).

After a period of reduced volatility, the market tends to form violent breakouts, as can be seen in the 31 January down candle, which whipped off close to 4 days of gain in a single 1-hour candle.

And all this brings us to today's setup.

We are in an uptrend, which favors a breakout to the upside. This will be our longer-term view, with a target at the next major psychological resistance level, 39000. However, in the short term, we can expect to see some retracement to the downside, either during a breakout or shortly afterward.

The downside target could be the area between the 200 and 100 period SMA. A break below this area will also invalidate an upward bias.

As always, take a good look at the upcoming news and keep the diminishing volatility on the ATR in mind; this does raise flags for a violent breakout once it occurs.

Summary:

  1. The primary outlook favors an upward trajectory, reflecting a long-term view on the US30 asset.
  2. Nonetheless, significant reversals are anticipated, particularly with the potential for establishing new all-time highs.
  3. Confirmation of this expectation comes from the diminishing volatility observed on the Average True Range (ATR).
  4. The target for an upward breakout is set at 39,000.
  5. Conversely, the downward breakout target is 38,474.4, or within the range delineated by the 100 and 200-period simple moving averages (SMA).
IMPORTANT NOTICE: Any news, opinions, research, analyses, prices or other information contained in this article are provided as general market commentary and do not constitute investment advice. The market commentary has not been prepared in accordance with legal requirements designed to promote the independence of investment research, and therefore, it is not subject to any prohibition on dealing ahead of dissemination. Past performance is not an indication of possible future performance. Any action you take upon the information in this article is strictly at your own risk, and we will not be liable for any losses and damages in connection with the use of this article.
RISK WARNING: CFDs are complex instruments and come with a high risk of losing money rapidly due to leverage. A high percentage of retail client investors lose money when trading CFDs with this provider. You should consider whether you understand how CFDs work and whether you can afford to take the high risk of losing your money.

Related articles

XAUUSD Struggles to Reclaim 3296 in Bear-Controlled Setup
31 July 2025
XAUUSD shows corrective bounce below major EMAs in a bearish setup, with 3296 as near-term resistance and 3164 as critical support to watch.

Read more

EUR/USD Bulls Take Charge Above 1.17 — Is 1.1850 Next?
24 July 2025
EUR/USD breaks above key moving averages with bullish momentum building. As long as the 50-period SMA holds, 1.1850 could be the next target in this mean-reverting market.

Read more

GBPUSD Tests Key Technical Support Near 1.3240
17 July 2025
Sterling hovers above its 100-day moving average as GBPUSD traders watch for a bounce or breakdown. Get insights into key support levels, oversold signals, and market scenarios.

Read more

Need Help? Visit our Help Section
Download NAGA Trader

Copyright © 2024 – All rights reserved.

NAGA is a trademark of The NAGA Group AG, a German based FinTech company publicly listed on the Frankfurt Stock Exchange | WKN: A161NR | ISIN: DE000A161NR7.

The website is operated by JME Financial Services (Pty) Ltd an authorised Financial Services Provider, regulated by the Financial Sector Conduct Authority in South Africa under license no. 37166. JME Financial Services (Pty) Ltd is located at Suite 10, 21 Lighthouse Rd 201 Beacon Rock, Umhlanga Rocks, Kwa-Zulu Natal, 4320, South Africa.

JME Financial Services (Pty) Ltd acts as an intermediary between the investor and NAGA Capital Ltd, the counterparty to the contract for difference purchased by the Investor via Naga.com/za. NAGA Capital Ltd is authorised and regulated by the Financial Services Authority Seychelles (FSA) under licence No. SD026. NAGA Capital Ltd is the principal to the CFD purchased by investors on this website. Other group entities: NAGA Markets Europe LTD which is authorised and regulated by the Cyprus Securities and Exchange Commission (CySEC) under licence No. 204/13.

RISK WARNING: Derivatives are complex instruments and come with a high risk of losing money rapidly due to leverage. You should consider whether you understand how derivatives work and whether you can afford to take the high risk of losing your money. The value of financial products can increase as well as decrease over time, depending on the value of the underlying securities and market conditions. Illustrations, forecasts or hypothetical data are not guaranteed and are provided for illustrative purposes only. JME Financial Services (Pty) Ltd does not render advice in respect of the CFD’s offered on this website. Before making an investment decision, you should rely on your own assessment. The Company’s disclaimer, conflict of interest policy are available on legal documents section.

Trading with NAGA Trader by following and/or copying or replicating the trades of other traders involves high levels of risks, even when following and/or copying or replicating the top-performing traders. Such risks include the risk that you may be following/copying the trading decisions of possibly inexperienced/unprofessional traders, or traders whose ultimate purpose or intention, or financial status may differ from yours. Before making an investment decision, you should rely on your own assessment of the person making the trading decisions and the terms of all the legal documentation.