


Investors on Monday shifted their focus to the new geopolitical dynamic while keeping one eye on the liquidity crisis. The president of Russia, Vladimir Putin, confirms the country will station fighter jets and missiles capable of holding nuclear weapons. However, as the reaction from the US and Europe has been calm and limited, no significant investor reaction has been experienced. Nonetheless, investors will monitor any escalation that may trigger a “risk off” sentiment.
The price of the US Dollar Index climbed for a second consecutive day on Friday as many investors chose to avoid weekend risk. Weekend price movement and fundamental developments throughout March have forced low-risk profiles to stick to the Dollar over the weekend. However, the US Dollar is gaining again this morning. The US Dollar Index rises to 103.22, gaining 0.10%. The Pound is also experiencing bullish price movements against all currencies. Traders of the Pound will follow tonight’s speech scheduled for the governor of the Bank of England.
Crude Oil
The price of Crude Oil rose during this morning’s Asian Session, again reaching $70 per barrel. Over the past 3 hours, the price is increasing by 1.26% as the Asian session comes to an edge and the European opens edges closer. The bullish price movement is forming a correction after the investor sentiment and confidence are recovering due to the SVB bank purchase. Economists advise that demand may rise now because the price is trading at a discount compared to previous months.
Technical analysis for crude oil is known to be less effective as the price is more related to the demand, supply, costs, and geopolitical developments. However, technical analysts can see the price has formed a clear bullish “Head and Shoulders'' pattern. The price is also trading above Moving Averages of smaller time frames and trading close to the upper band of the Bollinger bands. Both indications point towards a bullish price movement. However, the Bollinger Band on the daily chart indicates the asset mainly finds resistance at the $78.80 level. This has also previously acted as a support and breakout level.
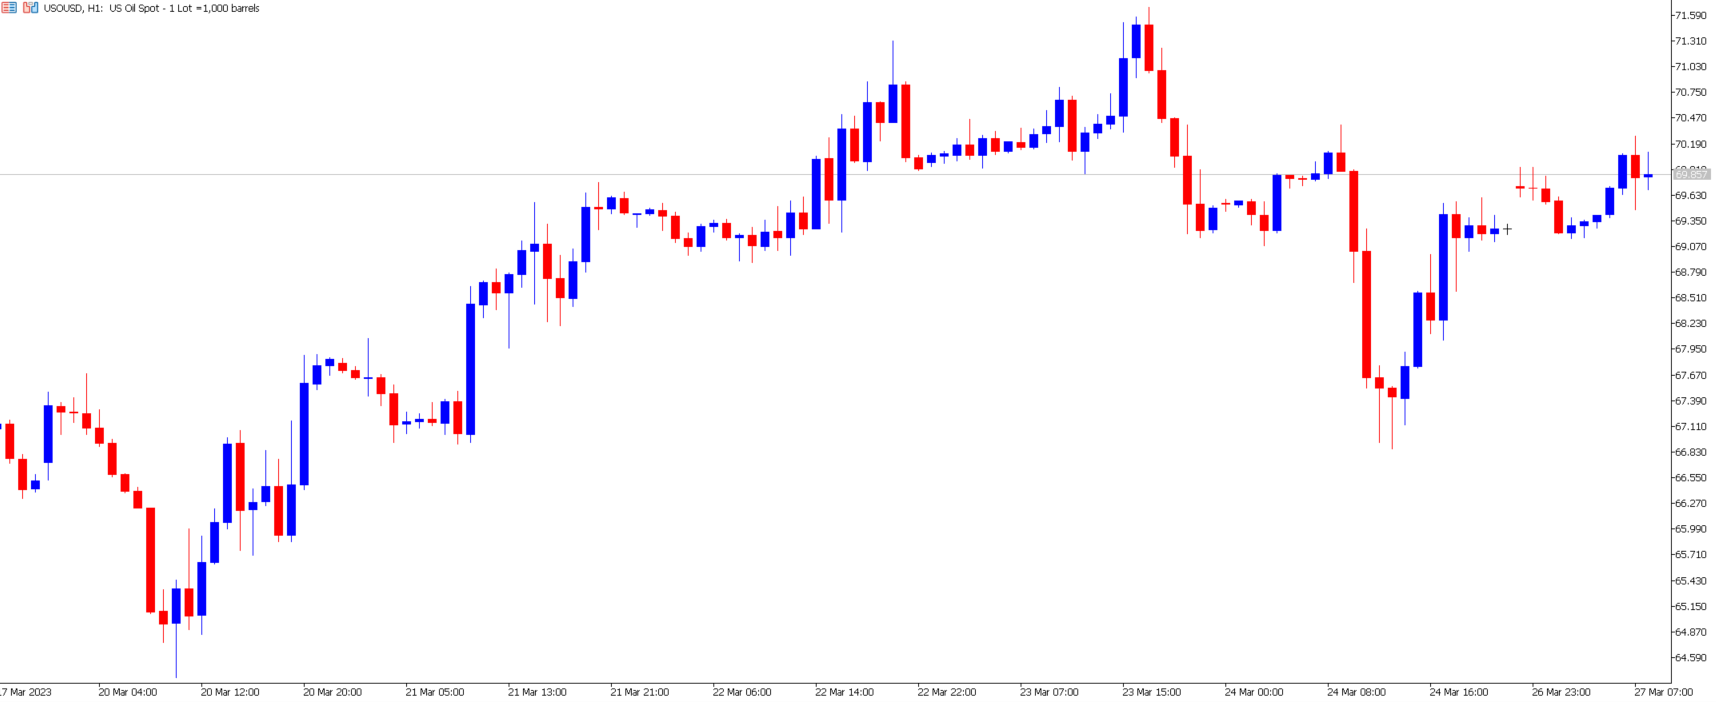
Fundamental factors positively influence Crude Oil's price, though it is not necessarily pointing toward another crisis or prices above $90 per barrel. China, the largest importer, is experiencing an economic recovery and growth. The CEO of AP Moller-Maersk, the second-largest container shipping group, has advised that US efforts to “decouple” the Chinese economy have not yet had any effect. However, the CEO, Vincent Clerc, advises that the Chinese economy is experiencing a much weaker-than-expected recovery.
Reports on Monday show that revenue from Chinese industrial groups has declined by almost 23% this year. This also adds further concerns about the economy’s rebound from the pandemic. Due to the above, investors act cautiously while analyzing the upward price movement. Investors will specifically be cautious of the $71.68 level, which has recently caused a collapse in demand.
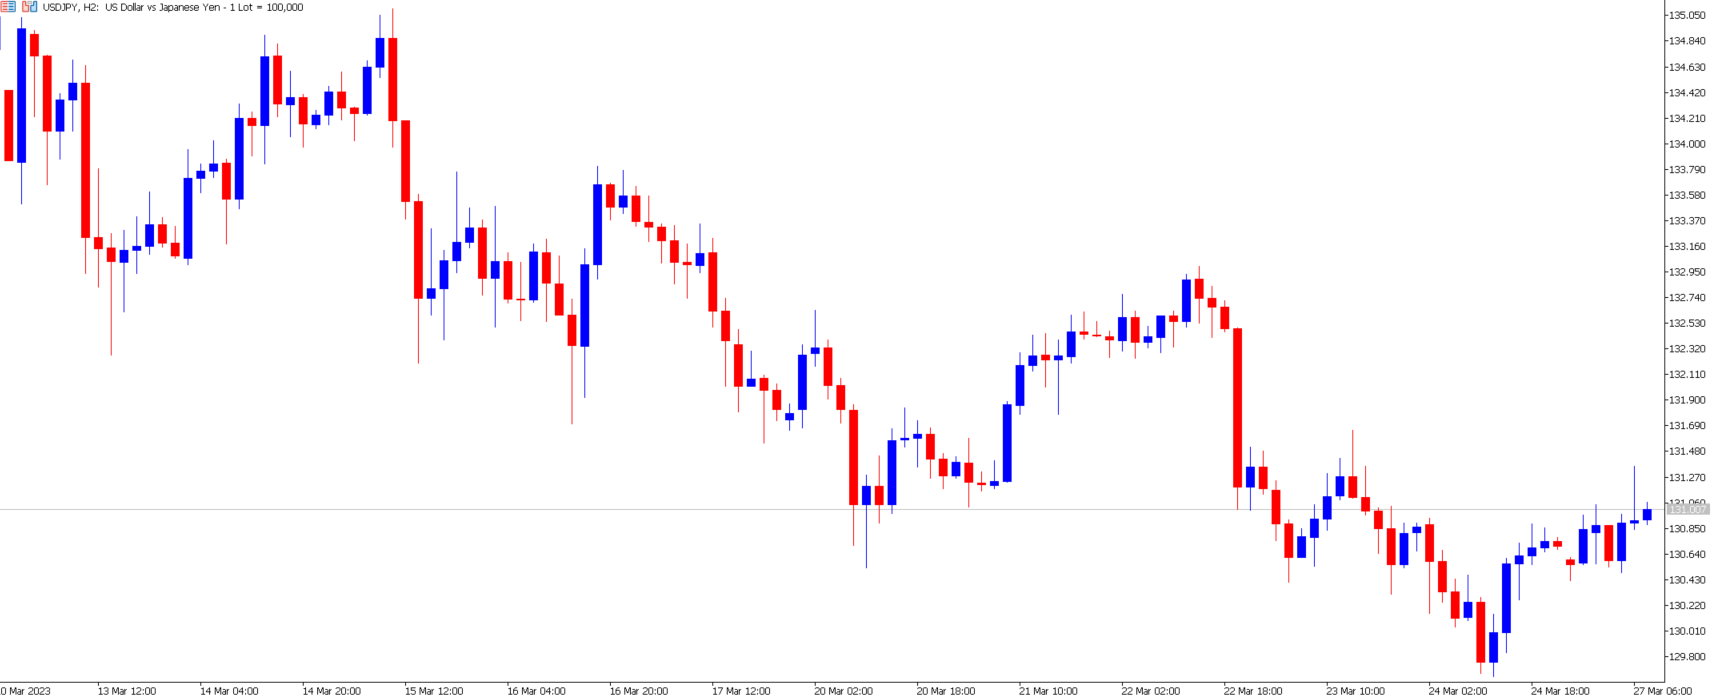
USD/JPY - The Dollar Climbs
The US Dollar has declined for 4 consecutive weeks against the Japanese Yen, the steadiest and clearest downtrend experienced in the currency market. This has largely been due to the liquidity crisis affecting US Banks and the Japanese Yen’s “safe haven status”. Though many economists have contended about Yen's status over the past 2 years. However, the Dollar has been supported by the liquidity crisis de-escalating and Japan’s latest inflation figures.
The Yen has been pressured since the COVID-19 crisis due to an ultra-dovish monetary policy and low economic growth. Japan has recently released its Consumer Price Index, which has shown inflation declining from 4.3% to 3.3%. The inflation rate has significantly declined, limiting the chances of the new governor setting a path for more competitive interest rates.
The price has formed a retracement, but the longer-term pattern still points towards a downward trend. A breakout above 131.650 and 133.000 will further improve the bullish outlook. Investors this week will largely be monitoring Consumer Confidence, US GDP figures, and Friday’s Core PCE Price Index.
Summary:
- The US Dollar continues its attempted correction. The US Dollar Index rises to 103.22, gaining 0.10%.
- The Pound is experiencing bullish price movements against all currencies. Traders turn their attention to tonight’s Bank of England speech.
- Crude Oil is once again climbing, attempting to correct previous declines partially. However, the asset is pressured by the recession risks and a weak Chinese recovery.
- Japan’s Consumer Price Index shows a slowing inflation declining from 4.3% to 3.3%. The lower inflation rate dampens the chances of a more competitive interest rate.


