1. Home
  2. Markets Updates
  3. SPX500 Sell-Off Continues — Geopolitical Tensions Weigh on Markets

SPX500 Sell-Off Continues — Geopolitical Tensions Weigh on Markets

Learn more --> SPX500 is under bearish pressure after breaking key support at 5734.

3 October 2024

Share the article:

SPX500_Pro'H1_3_Oct_2024.png

Past performance is not indicative of future results. All historical data, including but not limited to returns, volatility, and other performance metrics, should not be construed as a guarantee of future performance. 


SPX500 on an Hourly Timeframe 

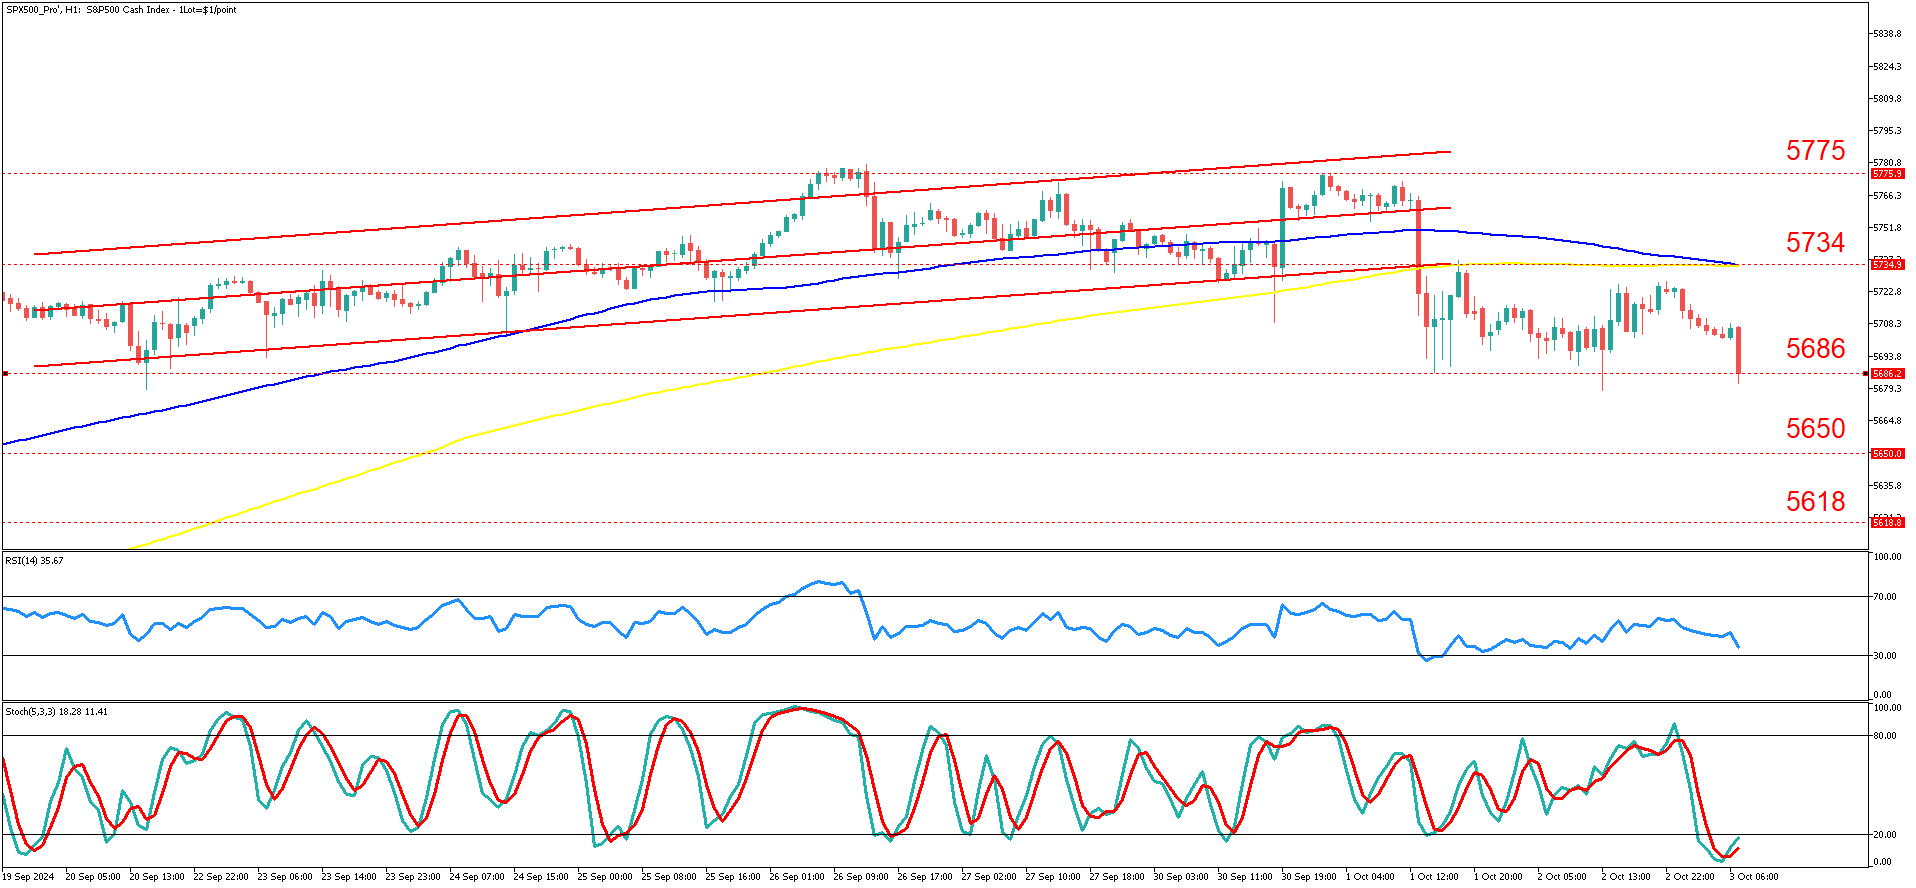
SPX500 on a 1-hour timeframe has been trading in a downward trajectory following a period of consolidation within a rising channel. The price reached a peak at the upper boundary near 5775, but failed to sustain the bullish momentum and reversed below key support levels. A steep decline occurred as the price broke below the 5734 level, marked by the 200-period moving average, indicating weakening buyer interest.  

The recent breakdown highlights increasing bearish pressure as the price approaches the 5686 support, showing that buyers were unable to counter the prevailing risk-off sentiment in the market.   

The technical indicators provide further confirmation of bearish momentum. The RSI is currently at 35, signaling that the market is nearing oversold conditions, but there is still room for further downside.  

Additionally, the Stochastic oscillator has dipped into oversold territory at 18, with a slight attempt at turning upwards. However, the lack of a significant bullish crossover suggests that the selling pressure may continue in the short term. Price remains below both the 50-period and 200-period moving averages, reinforcing the bearish bias. 

In the main scenario, continued bearish action is anticipated, with SPX500 potentially testing the 5618 support if downward pressure persists. The inability of bulls to defend the 5686 level may drive prices lower, especially given the current risk-averse market environment. A decisive break below 5686 could open the door for a more extended move toward lower support zones. 

Alternatively, if buyers manage to reclaim the 5686 level and stabilize the price action above it, a recovery towards the 5734 resistance could unfold. A decisive move above this level, particularly accompanied by increasing volumes, would suggest a potential shift back towards the upper boundary of the previous channel near 5775. However, any upside movement would likely be constrained by ongoing geopolitical risks. 

The recent decline has been fundamentally driven by heightened geopolitical tensions, particularly the missile attack from Iran on Israel. This development has raised concerns about a potential escalation in the Middle East, prompting a risk-off move across global markets. Investors are turning to safer assets like gold and government bonds, while equities face increased selling pressure.  

Close attention should be paid to further developments in the Middle East, as this could heavily influence market direction in the coming sessions. Risk-on sentiment could reemerge if tensions ease, but any further escalation would likely lead to additional downside for equities. 

Summary 

  • SPX500 broke key support at 5734, signaling increased selling pressure. 
  • Market sentiment turned risk-off due to heightened tensions in the Middle East. 
  • Price is approaching the 5686 support, which could determine the next move. 
  • RSI and Stochastic show oversold conditions, suggesting potential short-term volatility. 
  • Continued bearish action may test 5618, while any recovery depends on reclaiming 5734. 
IMPORTANT NOTICE: Any news, opinions, research, analyses, prices or other information contained in this article are provided as general market commentary and do not constitute investment advice. The market commentary has not been prepared in accordance with legal requirements designed to promote the independence of investment research, and therefore, it is not subject to any prohibition on dealing ahead of dissemination. Past performance is not an indication of possible future performance. Any action you take upon the information in this article is strictly at your own risk, and we will not be liable for any losses and damages in connection with the use of this article.
RISK WARNING: CFDs are complex instruments and come with a high risk of losing money rapidly due to leverage. A high percentage of retail client investors lose money when trading CFDs with this provider. You should consider whether you understand how CFDs work and whether you can afford to take the high risk of losing your money.

Related articles

Euro-Dollar Stuck in Sideways Channel, Eyes 1.1850 or 1.141
4 September 2025
The euro-dollar rally stalls as EUR/USD trades sideways near mid-range. Discover critical support, resistance, and market catalysts shaping the pair’s next breakout opportunity.

Read more

USDJPY Pinned at 146.80 as Breakout Tension Builds
28 August 2025
USDJPY consolidates around 146.80 with traders eyeing 146.00 support and 150.90 resistance. Daily chart outlook and market drivers explained.

Read more

EURUSD Consolidates After Strong May-July Rally
21 August 2025
EURUSD trades in a narrow range following a bullish run, showing indecision between 1.1600 and 1.1800. Technical indicators point to potential momentum shifts in the coming sessions.

Read more

Need Help? Visit our Help Section
Download NAGA Trader

Copyright © 2025 – All rights reserved.

NAGA is a trademark of The NAGA Group AG, a German based FinTech company publicly listed on the Frankfurt Stock Exchange | WKN: A161NR | ISIN: DE000A161NR7.

The website is operated by JME Financial Services (Pty) Ltd an authorised Financial Services Provider, regulated by the Financial Sector Conduct Authority in South Africa under license no. 37166. JME Financial Services (Pty) Ltd is located at Suite 10, 21 Lighthouse Rd 201 Beacon Rock, Umhlanga Rocks, Kwa-Zulu Natal, 4320, South Africa.

JME Financial Services (Pty) Ltd acts as an intermediary between the investor and NAGA Capital Ltd, the counterparty to the contract for difference purchased by the Investor via Naga.com/za. NAGA Capital Ltd is authorised and regulated by the Financial Services Authority Seychelles (FSA) under licence No. SD026. NAGA Capital Ltd is the principal to the CFD purchased by investors on this website. Other group entities: NAGA Markets Europe LTD which is authorised and regulated by the Cyprus Securities and Exchange Commission (CySEC) under licence No. 204/13.

RISK WARNING: Derivatives are complex instruments and come with a high risk of losing money rapidly due to leverage. You should consider whether you understand how derivatives work and whether you can afford to take the high risk of losing your money. The value of financial products can increase as well as decrease over time, depending on the value of the underlying securities and market conditions. Illustrations, forecasts or hypothetical data are not guaranteed and are provided for illustrative purposes only. JME Financial Services (Pty) Ltd does not render advice in respect of the CFD’s offered on this website. Before making an investment decision, you should rely on your own assessment. The Company’s disclaimer, conflict of interest policy are available on legal documents section.