1. Home
  2. Markets Updates
  3. SPX500 Range Bound: Key Levels and Trade Setups Unveiled

SPX500 Range Bound: Key Levels and Trade Setups Unveiled

Look at today's financial market analysis, December 7, 2023!

7 December 2023

Share the article:

SPX500 1-hour timeframe:

2023-12-07 11_36_38-Window.jpg
SPX500 on a 1-hour time frame. 07 December 2023


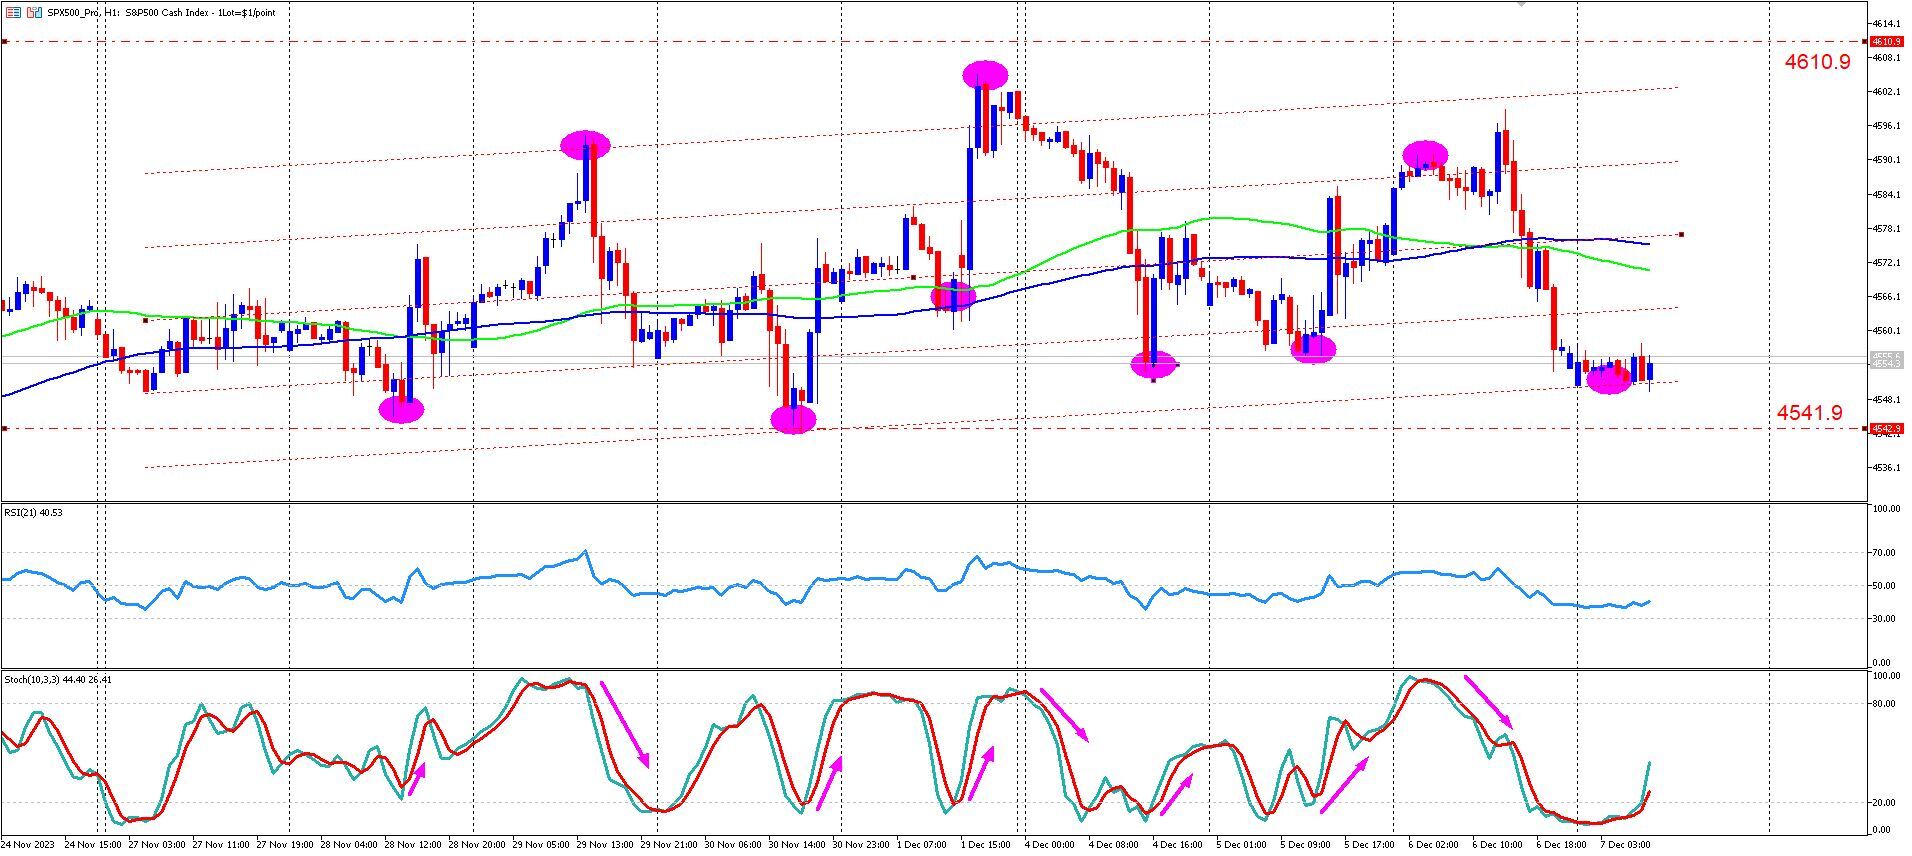
The SPX500, on an hourly chart, has maintained a robust uptrend since October 27, a trend underlined by moving averages consistently plotting below the price. Over the last nine days, the SPX500 has been confined within a trading range between 4610.9 and 4541.9, corresponding to the highs of July 27 and September 1. These levels are crucial to monitor.

The sideways trend is further evidenced by the 1 and 2 standard deviation regression channels. The channel exhibits a modest upward slope, and it's clear that the price adheres well to both the range and the channel. Additionally, the stochastic oscillator (10,3,3) shows consistent reversals in the overbought and oversold zones, typical of a ranging market.

However, caution is advised due to the market's significant extension on the daily timeframe, following the strong upward movement since October 27. This could trigger a short-term reversal before a new trend begins to form.

Notably, the market is currently responding to typical range trading signals. The signals are established by the overextending market, as indicated by the distance from the channel's midline, and the Stochastic oscillator reaching overbought or oversold levels (above 80 for overbought, below 20 for oversold).

On the hourly timeframe, the SPX500 rejects the 100-period simple moving average, establishing this average (depicted by a blue line) as a reliable dynamic support and resistance level.

Presently, the market is in a sideways or consolidation phase, with two strong boundaries at 4610.9 (the July 27 high) and 4541.9 (the September 1 high). If the market oscillates within these levels, trading opportunities may arise near the outer edges of the standard deviation channel, especially when coupled with overbought or oversold conditions in the Stochastic oscillator. Historical buy and sell signals are marked in purple on the chart. 

Currently, the market is touching the lower channel band with the Stochastic indicator below 20, presenting a classic mean reversion buy setup with potential targets at the channel's midline or the 100-period SMA, presently at 4575.2. Given the overall upward trend in the daily timeframe, a target of 4610.9 is also feasible.

Should the market close below the lower channel boundary (4541.9) convincingly, it may signal the end of the ranging phase, prompting a shift to breakout trades. Today's market is relatively unaffected by the news, suggesting continuing this ranging behavior. However, the release of the NFP and Michigan Consumer Sentiment reports tomorrow could introduce volatility, potentially leading to breakout trading scenarios.

Summary:

  • The market is oscillating between 4610.9 and 4541.9.
  • Within these levels, range-based setups are preferable.
  • Ideal range trades occur when the market is distant from the channel's midline, aligned with extreme Stochastic oscillator readings.
  • The market is currently near the channel's lower boundary, with the Stochastic indicator in the oversold region, presenting a potential buy opportunity.
  • Initial targets could be 4575.2 or potentially 4610.9.
  • A convincing close below 4541.9 could invalidate range trades, shifting focus to momentum or breakout strategies.
  • Investor actions in the coming days will ultimately determine the market's direction.
IMPORTANT NOTICE: Any news, opinions, research, analyses, prices or other information contained in this article are provided as general market commentary and do not constitute investment advice. The market commentary has not been prepared in accordance with legal requirements designed to promote the independence of investment research, and therefore, it is not subject to any prohibition on dealing ahead of dissemination. Past performance is not an indication of possible future performance. Any action you take upon the information in this article is strictly at your own risk, and we will not be liable for any losses and damages in connection with the use of this article.
RISK WARNING: CFDs are complex instruments and come with a high risk of losing money rapidly due to leverage. A high percentage of retail client investors lose money when trading CFDs with this provider. You should consider whether you understand how CFDs work and whether you can afford to take the high risk of losing your money.

Related articles

EUR/USD Bulls Take Charge Above 1.17 — Is 1.1850 Next?
24 July 2025
EUR/USD breaks above key moving averages with bullish momentum building. As long as the 50-period SMA holds, 1.1850 could be the next target in this mean-reverting market.

Read more

GBPUSD Tests Key Technical Support Near 1.3240
17 July 2025
Sterling hovers above its 100-day moving average as GBPUSD traders watch for a bounce or breakdown. Get insights into key support levels, oversold signals, and market scenarios.

Read more

Gold Stalls Between 3250 and 3350 Awaiting a Breakout Trigger
10 July 2025
XAUUSD remains range bound with neutral momentum and declining volatility. Explore the technical outlook, key levels, and potential breakout scenarios for gold.

Read more

Need Help? Visit our Help Section
Download NAGA Trader

Copyright © 2024 – All rights reserved.

NAGA is a trademark of The NAGA Group AG, a German based FinTech company publicly listed on the Frankfurt Stock Exchange | WKN: A161NR | ISIN: DE000A161NR7.

The website is operated by JME Financial Services (Pty) Ltd an authorised Financial Services Provider, regulated by the Financial Sector Conduct Authority in South Africa under license no. 37166. JME Financial Services (Pty) Ltd is located at Suite 10, 21 Lighthouse Rd 201 Beacon Rock, Umhlanga Rocks, Kwa-Zulu Natal, 4320, South Africa.

JME Financial Services (Pty) Ltd acts as an intermediary between the investor and NAGA Capital Ltd, the counterparty to the contract for difference purchased by the Investor via Naga.com/za. NAGA Capital Ltd is authorised and regulated by the Financial Services Authority Seychelles (FSA) under licence No. SD026. NAGA Capital Ltd is the principal to the CFD purchased by investors on this website. Other group entities: NAGA Markets Europe LTD which is authorised and regulated by the Cyprus Securities and Exchange Commission (CySEC) under licence No. 204/13.

RISK WARNING: Derivatives are complex instruments and come with a high risk of losing money rapidly due to leverage. You should consider whether you understand how derivatives work and whether you can afford to take the high risk of losing your money. The value of financial products can increase as well as decrease over time, depending on the value of the underlying securities and market conditions. Illustrations, forecasts or hypothetical data are not guaranteed and are provided for illustrative purposes only. JME Financial Services (Pty) Ltd does not render advice in respect of the CFD’s offered on this website. Before making an investment decision, you should rely on your own assessment. The Company’s disclaimer, conflict of interest policy are available on legal documents section.

Trading with NAGA Trader by following and/or copying or replicating the trades of other traders involves high levels of risks, even when following and/or copying or replicating the top-performing traders. Such risks include the risk that you may be following/copying the trading decisions of possibly inexperienced/unprofessional traders, or traders whose ultimate purpose or intention, or financial status may differ from yours. Before making an investment decision, you should rely on your own assessment of the person making the trading decisions and the terms of all the legal documentation.