The S&P 500 index (SPX500) on the daily timeframe.
Past performance is not a reliable indicator of future results. All historical data, including but not limited to returns, volatility, and other performance metrics, should not be construed as a guarantee of future performance.
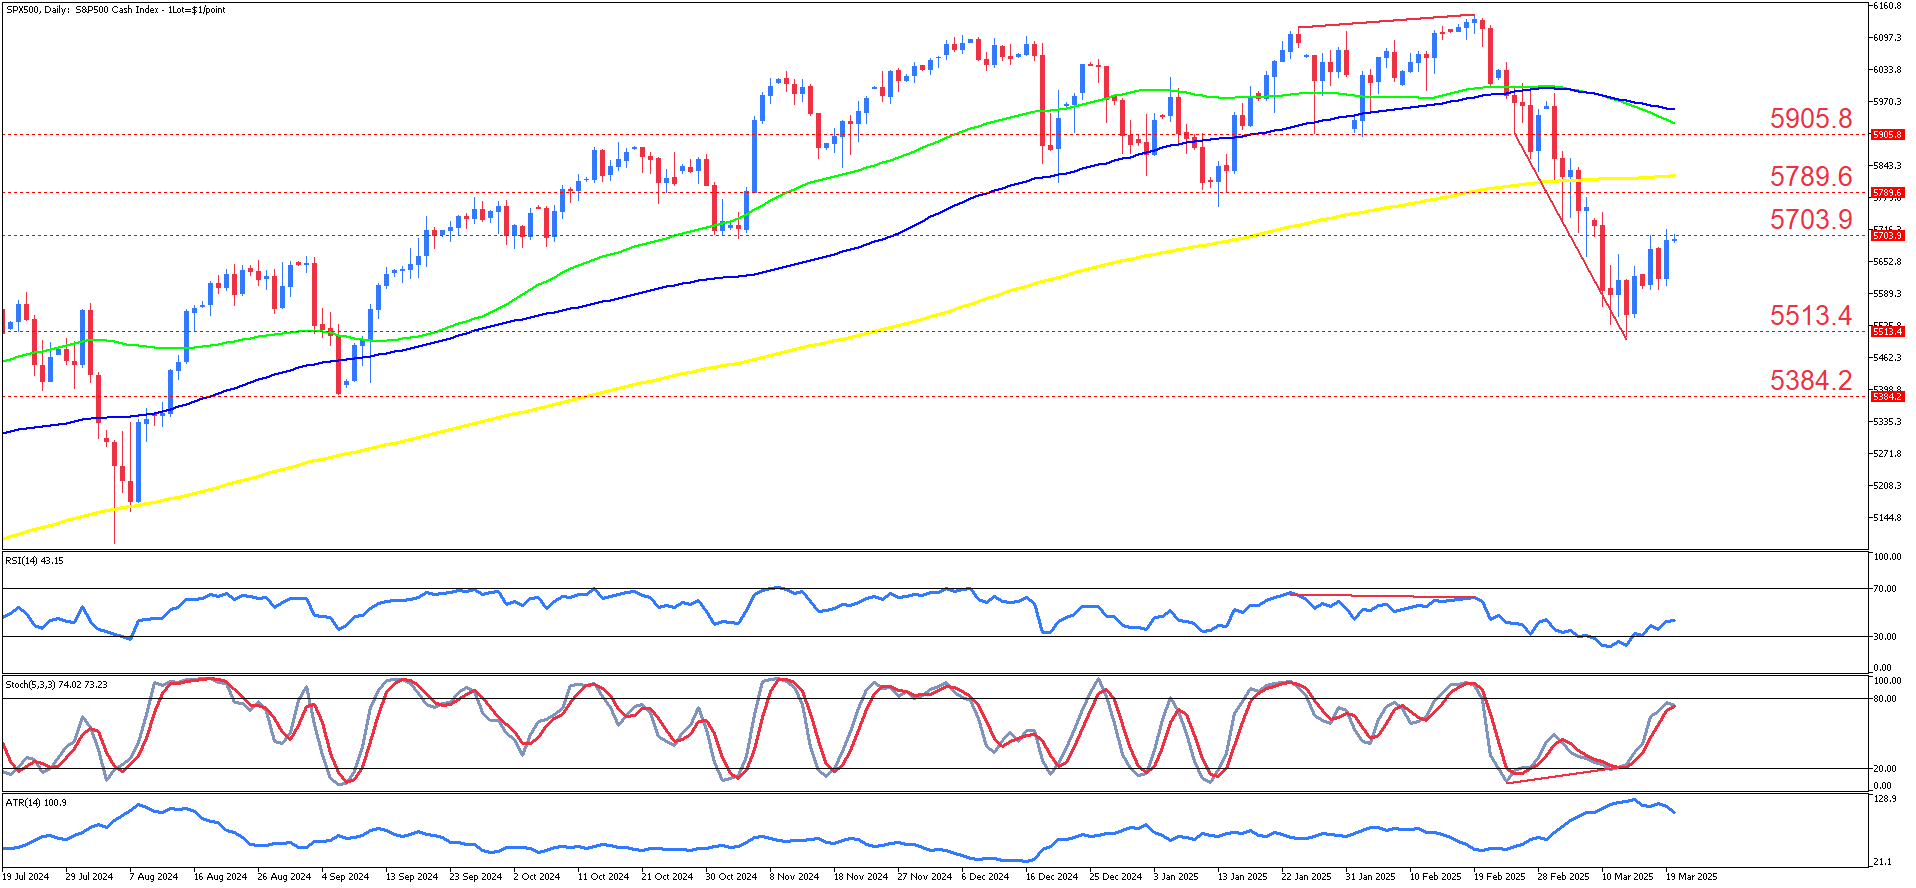
The S&P 500 index (SPX500) on the daily timeframe has recently experienced a significant downward correction after reaching record highs earlier in the year. Throughout the previous uptrend, the index demonstrated consistent strength, finding support on its 50-day (green) and 100-day (blue) moving averages, which acted as dynamic support levels during pullbacks. However, the failure to hold above these moving averages in early March 2025 led to an acceleration of bearish momentum. The decline pushed the index below key levels, confirming a technical breakdown, with the 200-day moving average (yellow) also failing to provide support during the initial selloff.
Following the sharp decline, the index established a local bottom near 5513.4, where buyers stepped in, leading to a short-term recovery. The rebound is currently testing the 5703.9 resistance level, which aligns closely with prior support now turned resistance. If the price can push higher, the next key resistance levels lie at 5789.6 and 5905.8, both of which coincide with significant technical levels. However, the presence of declining moving averages suggests that these zones could act as strong resistance. A failure to clear these levels could lead to renewed selling pressure, while a breakout above 5905.8 would signal potential bullish continuation.
Technical indicators reveal a mixed picture. The Relative Strength Index (RSI) at 43 indicates weak momentum but is not yet oversold, leaving room for further downside. The Stochastic Oscillator is rising from oversold conditions, indicating a short-term relief rally. However, a bullish divergence appears to be forming, as price action shows lower lows while the Stochastic Oscillator is making higher lows. This divergence suggests that downside momentum may be weakening, raising the possibility of another push higher. Historical analysis also reveals a bearish RSI divergence in late January 2025, where price made higher highs while RSI failed to confirm, leading to the current selloff.
In a bullish scenario, if the index sustains above 5703.9, it could extend the recovery toward 5789.6 and 5905.8. A confirmed breakout above these levels would indicate a shift in sentiment and increase the likelihood of a retest of the previous all-time highs near 6100. However, for this scenario to materialize, the price must also reclaim the 50-day and 100-day moving averages, turning them back into support. Without this confirmation, the rally remains vulnerable to failure.
Alternatively, if the index fails to hold above 5703.9, renewed selling pressure could send prices back toward 5513.4. A break below this support level would expose 5384.2, a zone that may attract stronger buyers. Given the clear bearish trend and recent failure of moving average bounces, further downside remains a strong possibility unless bulls can reclaim lost ground.
The S&P 500 is influenced by key macroeconomic and corporate factors, with both short- and long-term drivers shaping its outlook. The U.S. economy is projected to grow by 2.5% in 2025, indicating stable economic expansion. However, Federal Reserve policy remains a key variable, as interest rates significantly affect borrowing costs, corporate profits, and consumer spending. The Fed has recently opted to hold rates steady, citing ongoing economic uncertainty, but upcoming inflation and employment reports will be critical in shaping future rate decisions. While inflation has shown some cooling, persistent price pressures could force the Fed to keep rates higher for longer, weighing on equity markets.
Corporate earnings remain a major influence on the index, with Q1 2025 earnings projected to rise by 6.1% year-over-year on 3.7% revenue growth. However, downward revisions across most sectors indicate growing concerns over slowing demand and trade disruptions. The technology sector, which has driven much of the S&P 500’s gains, is now facing headwinds from regulatory scrutiny and slowing AI-related investments, creating additional uncertainty. Meanwhile, market sentiment remains cautious, as the index is down 3.5% year-to-date and recently confirmed entering a 10% correction from its February highs. Analysts have lowered year-end targets, with Goldman Sachs and RBC Capital Markets adjusting forecasts to 6,200, reflecting tempered optimism.
Upcoming macroeconomic events will be key in shaping market direction. The Federal Reserve’s next policy decision, alongside economic data on inflation and job growth, will play a major role in determining whether equities can stabilize or face further downside. Trade tensions between the U.S. and Europe are another emerging concern, as retaliatory tariffs from the European Commission could impact corporate earnings. Additionally, the Q1 earnings season will provide further insights into corporate health, with most sectors already seeing downward revisions in earnings estimates. Given these risks, investors should remain cautious and closely monitor upcoming data releases to gauge the market’s next move.
Summary:
- S&P 500 faces a correction after breaking key moving averages in March 2025.
- The index is testing resistance at 5703.9, with 5789.6 and 5905.8 as potential barriers.
- Mixed technical signals, with a bullish divergence but weak momentum.
- Macroeconomic factors like Fed policy and earnings will influence the next move.