The US Dollar spikes up after Europe releases its latest PMIs. London’s Investment Conference sparks concern over the banking crisis. At the London Investment Conference, leading economists and CEOs were questioned on the economy and the banking sector. Man Group’s CEO, Luke Ellis, advised that the banking crisis is not over and “a significant amount of banks will not exist in 12 to 24 months' time”. In addition to this, the market is showing a clear sign of “risk-off sentiment”. This may result in investors avoiding weekend risk, which has been a significant risk in the recent past.
Within the currency market, we can see that the US Dollar and the Japanese Yen are experiencing bullish price movement while the Pound and Euro decline. Again, this indicates a low-risk appetite today and a safe haven drive. Gold has also gained simultaneously with the Dollar, which is slowly becoming a frequent recurrence. In addition to this, assets related to corporate lending are also taking a sharp decline.
The UK and EU have released February’s Purchasing Managers’ Index for the manufacturing and services sectors. The French and German saw mixed results, while the UK indices were red. We can see from the 4 PMI reports released in the EU 2 are significantly lower than expected.
- French Manufacturing PMI - 47.7 vs. 48.1
- French Services PMI - 55.5 vs. 52.4
- German Manufacturing PMI - 44.4 vs. 47.1
- German Services PMI - 53.9 vs. 51.0
- UK Manufacturing PMI - 48.0 vs. 49.8
- UK Services PMI - 52.8 vs. 53.1
EUR/USD
The EUR/USD has declined after reaching a new monthly high during yesterday’s Asian Session. The decline continued during this morning’s first two sessions and dropped 1.00% before the US Session opened. The exchange rate on smaller timeframes, such as the 30 minutes and below, is forming a clear downward trend with lower highs and lows. However, traders will most probably be cautious of the support level at 1.07022, which has previously altered the price action.
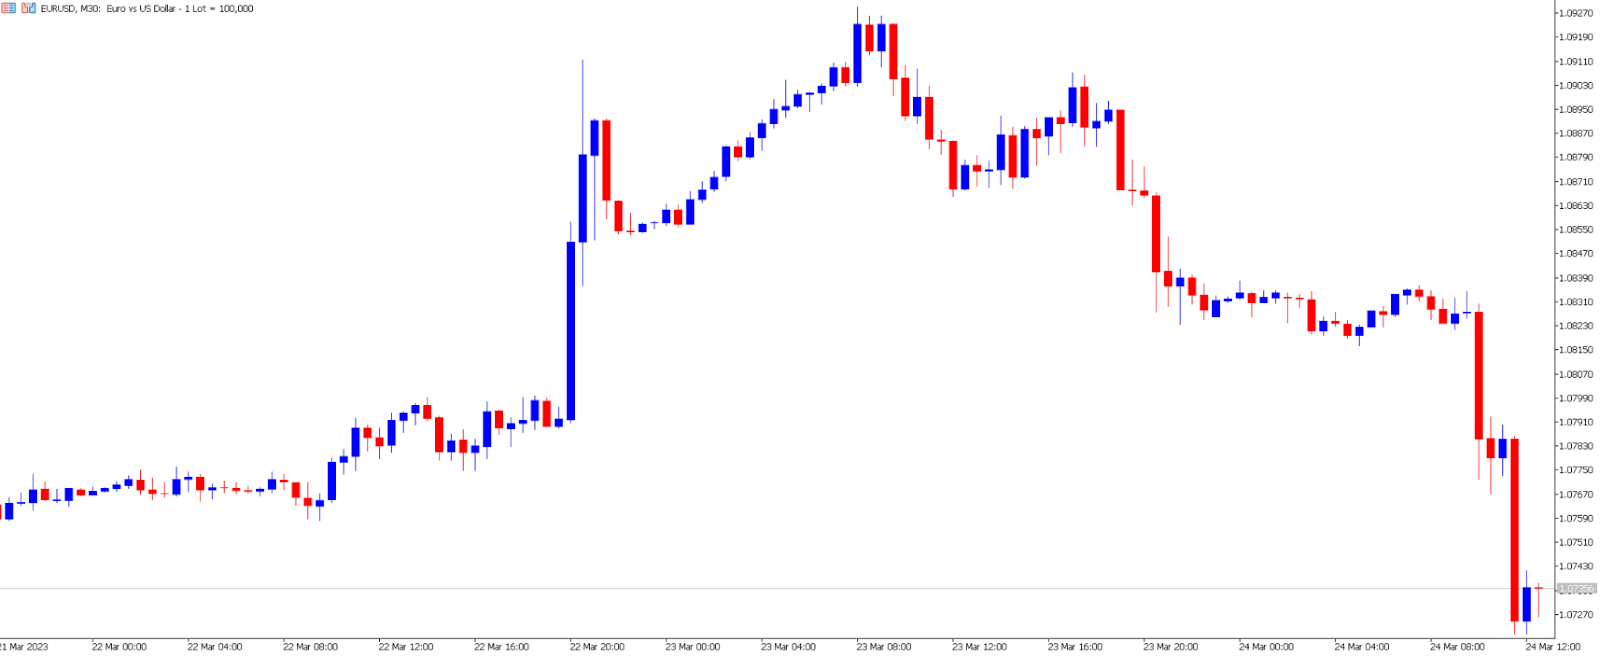
The exchange price is influenced by the latest PMI figures, which points toward a struggling economy. A figure below 50.0 is known to signal a possible economic contraction. In addition to this, the Head of the Bundesbank, Mr. Nagel, confirms that the financial system is recovering from the volatility, and the European Central Bank (ECB) is ready to provide all necessary support in the event of liquidity shortage among creditors. However, European banks have previously struggled, and investors continue to express dissatisfaction with the global banking system.
As a result, investors are also considering the Dollar again, specifically after Yellen’s recent comments. On Wednesday, the Treasury Secretary, Janet Yellen, advised that the government is now considering guaranteeing deposits above $250,000. As a result, the Dollar came under significant pressure, and Yellen came under fire. The treasury slightly changed its stance in the second press conference and confirmed the government would use all tools to ensure deposits are safe as they have done. The Dollar has since started increasing in value again.
The US Dollar Index throughout the day is pushing above 103.0 once again and is up 0.67% so far. The Dollar is increasing in value against all currencies, including the Japenese Yen, which is performing well against other currencies. Investors will also be monitoring this afternoon’s US Purchasing Managers’ Indexes.
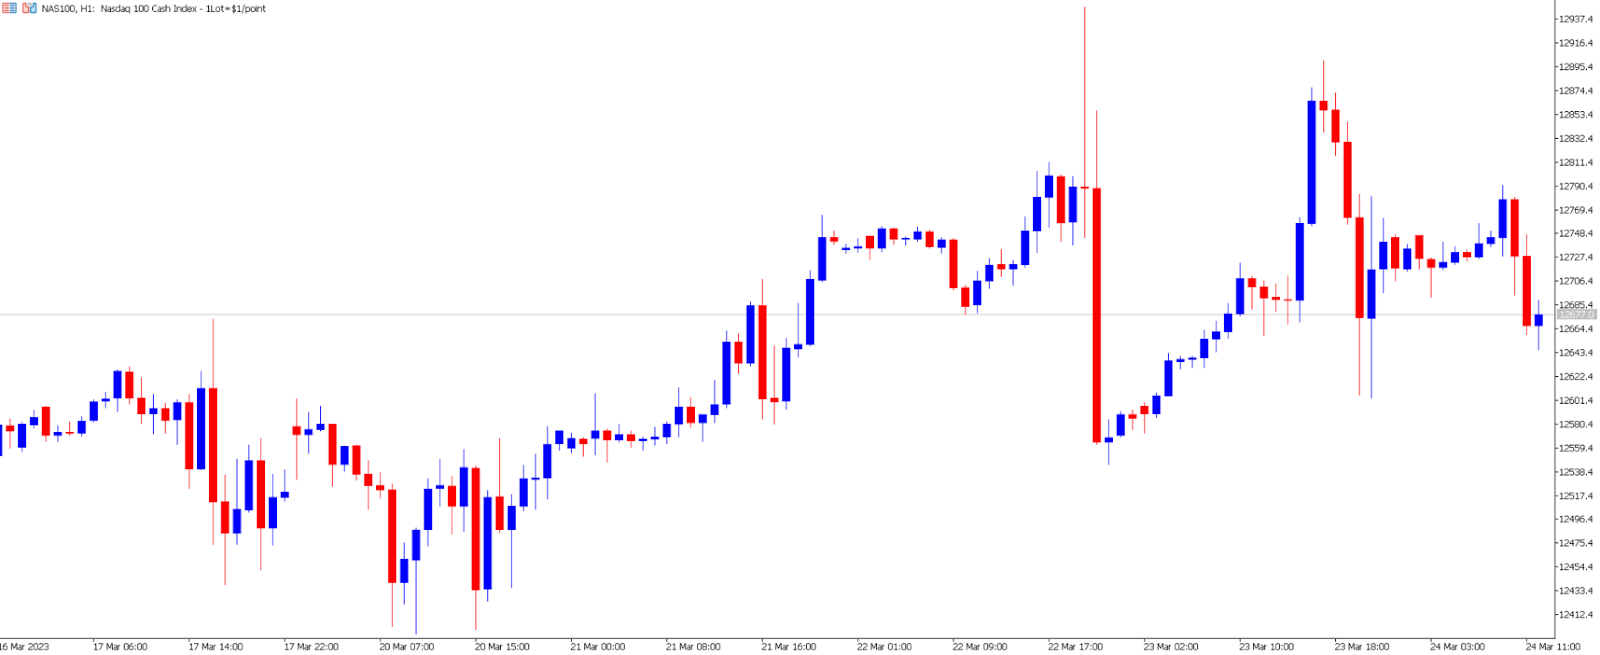
The NASDAQ
When investor confidence and sentiment drop, the index which tends to see the strongest decline is the NASDAQ, but not today. All global indices are down, including Europe, Asia, and the US, but the NASDAQ performs better than the Dow Jones and SNP500. This is partially due to investors avoiding banking stocks and holding onto technology companies again.
One of the best-performing stocks within the NASDAQ this week was Tesla. The company is expected to achieve record revenue in China due to the recent price cut of its best-selling models to 13.5%. According to China Merchants Bank, Tesla, from January 1 to March 19, sold 106,915 vehicles which is higher than in previous quarters.
The current price movement is forming a symmetrical triangle pattern which indicates the price can break in either direction. Therefore traders will be monitoring the price direction and the support level between $12,544 and $12,603. If the price breaks below, investors will contemplate whether the index will continue to decline.
Summary:
- Risk sentiment significantly declines as investors look to avoid “weekend risk” turningP to the US Dollar.
- Investor confidence in the Dollar increased after the Treasury Secretary confirmed the government would use all tools to ensure deposits are safe as they have done in the past.
- The US Dollar Index throughout the day is pushing above 103.0 once again and is up 0.67%.
- The NASDAQ declines but performs better than other indices. Global indices from all continents decline.