1. Home
  2. Markets Updates
  3. NAGA Weekly Recap January 9 — 13, 2023

NAGA Weekly Recap January 9 — 13, 2023

NAGA Email & Blog

13 January 2023

Share the article:

This week, we've seen some major economic news that have shaken up the markets. From unexpected shifts in currency values to important inflation releases from the United States, it's been a week of non-stop action.

But what does it all mean for investors like you? 🤔

#Markets.png

US inflation slows as CPI falls 0.1% in December

The latest data from the US Bureau of Labor Statistics shows that the headline rate of inflation in the United States fell to its lowest level since late 2021 in December.

The markets have responded positively to the decrease in inflation, as it suggests that the Federal Reserve may be able to stop raising interest rates in the near future.

Traders and investors see slowing inflation as a sign that the economy is not overheating, which can boost their confidence about putting their money into stocks and other assets.

Learn more

Trading involves significant risk of loss.

Stocks_dc573a24c5-2.png

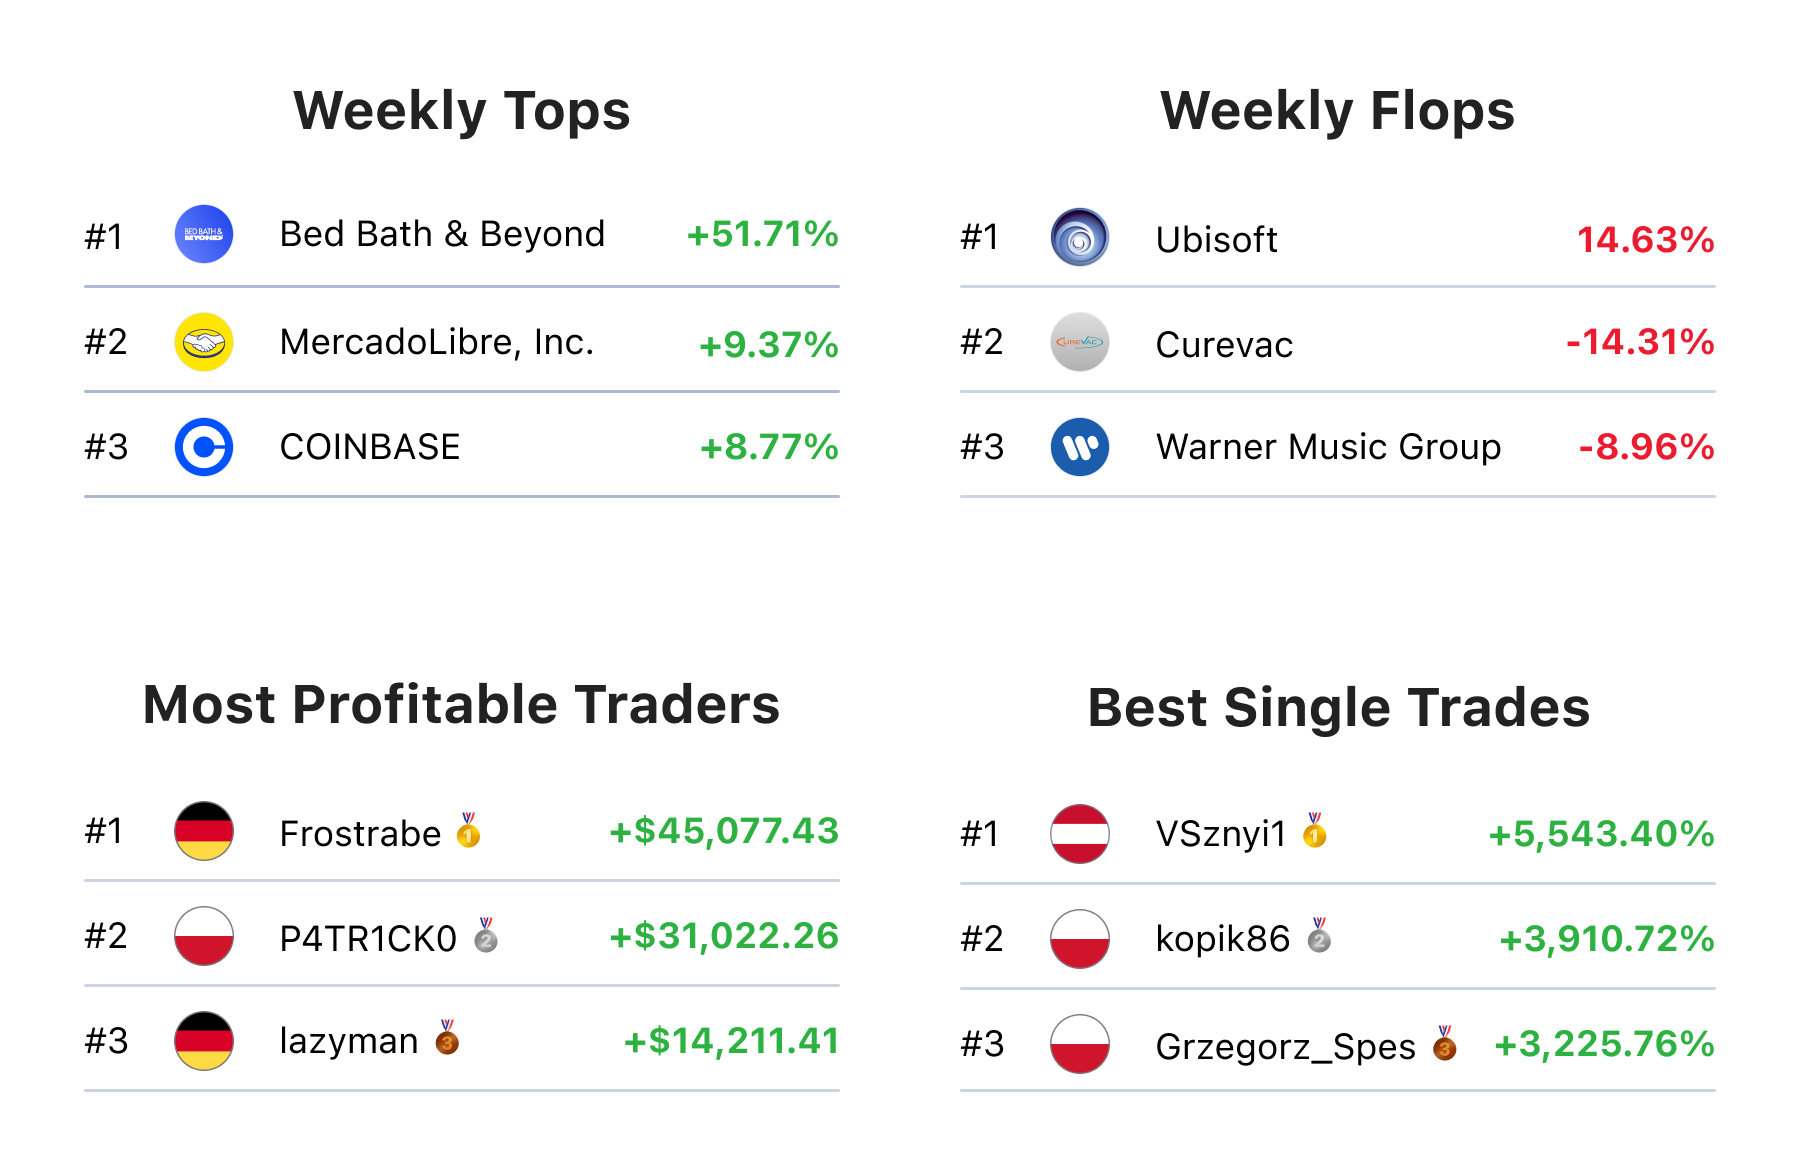
Bed Bath & Beyond jumps 51% to lead a last-gasp rally in meme stocks

A group of highly speculative stocks rallied double digits on Wednesday as retail investors pushed meme names up again in the new year after a dismal 2022.

Specifically, Bed Bath & Beyond skyrocketed by a whopping 51% to trigger the trend on Wednesday. The rally in Bed Bath & Beyond was initially triggered by news that it would lay off more employees in an attempt to reduce costs and stay in business.

Trade $BBBY

Trading involves significant risk of loss.

Gold prices aim above $1,900 after US CPI report

Gold price is retreating from near eight-month highs of $1,902 reached following the release of the United States Consumer Price Index (CPI) data on Thursday.

Gold bulls take a breather this Friday, as the US Dollar is attempting a minor recovery in tandem with the US Treasury bond yields, as the dust settles after volatile trading seen during Thursday’s American session.

Trade $XAU/USD

Trading involves significant risk of loss.

$GBP/USD holds steady near 1.2200 after UK data 

$GBP/USD continues to trade in a narrow channel at around 1.2200 in the early European morning on Friday. The data from the UK showed that GDP grew 0.1% in November, compared to the market expectation for a contraction of 0.2%, but failed to trigger a market reaction.

According to technical analysis, if the $GBP/USD falls below 1.1841, it will confirm the "double tops" pattern and could indicate a decline to 1.1440. On the other hand, if the $GBP/USD rises above 1.2250, it will contradict the bearish pattern, potentially leading to an increase towards the previous monthly high of 1.2445-50.

Trade $GBP/USD

Trading involves significant risk of loss.

This concludes our weekly recap. Have a great weekend and see you next week! 👋

IMPORTANT NOTICE: Any news, opinions, research, analyses, prices or other information contained in this article are provided as general market commentary and do not constitute investment advice. The market commentary has not been prepared in accordance with legal requirements designed to promote the independence of investment research, and therefore, it is not subject to any prohibition on dealing ahead of dissemination. Past performance is not an indication of possible future performance. Any action you take upon the information in this article is strictly at your own risk, and we will not be liable for any losses and damages in connection with the use of this article.
RISK WARNING: CFDs are complex instruments and come with a high risk of losing money rapidly due to leverage. A high percentage of retail client investors lose money when trading CFDs with this provider. You should consider whether you understand how CFDs work and whether you can afford to take the high risk of losing your money.

Related articles

Euro-Dollar Stuck in Sideways Channel, Eyes 1.1850 or 1.141
4 September 2025
The euro-dollar rally stalls as EUR/USD trades sideways near mid-range. Discover critical support, resistance, and market catalysts shaping the pair’s next breakout opportunity.

Read more

USDJPY Pinned at 146.80 as Breakout Tension Builds
28 August 2025
USDJPY consolidates around 146.80 with traders eyeing 146.00 support and 150.90 resistance. Daily chart outlook and market drivers explained.

Read more

EURUSD Consolidates After Strong May-July Rally
21 August 2025
EURUSD trades in a narrow range following a bullish run, showing indecision between 1.1600 and 1.1800. Technical indicators point to potential momentum shifts in the coming sessions.

Read more

Need Help? Visit our Help Section
Download NAGA Trader

Copyright © 2025 – All rights reserved.

NAGA is a trademark of The NAGA Group AG, a German based FinTech company publicly listed on the Frankfurt Stock Exchange | WKN: A161NR | ISIN: DE000A161NR7.

The website is operated by JME Financial Services (Pty) Ltd an authorised Financial Services Provider, regulated by the Financial Sector Conduct Authority in South Africa under license no. 37166. JME Financial Services (Pty) Ltd is located at Suite 10, 21 Lighthouse Rd 201 Beacon Rock, Umhlanga Rocks, Kwa-Zulu Natal, 4320, South Africa.

JME Financial Services (Pty) Ltd acts as an intermediary between the investor and NAGA Capital Ltd, the counterparty to the contract for difference purchased by the Investor via Naga.com/za. NAGA Capital Ltd is authorised and regulated by the Financial Services Authority Seychelles (FSA) under licence No. SD026. NAGA Capital Ltd is the principal to the CFD purchased by investors on this website. Other group entities: NAGA Markets Europe LTD which is authorised and regulated by the Cyprus Securities and Exchange Commission (CySEC) under licence No. 204/13.

RISK WARNING: Derivatives are complex instruments and come with a high risk of losing money rapidly due to leverage. You should consider whether you understand how derivatives work and whether you can afford to take the high risk of losing your money. The value of financial products can increase as well as decrease over time, depending on the value of the underlying securities and market conditions. Illustrations, forecasts or hypothetical data are not guaranteed and are provided for illustrative purposes only. JME Financial Services (Pty) Ltd does not render advice in respect of the CFD’s offered on this website. Before making an investment decision, you should rely on your own assessment. The Company’s disclaimer, conflict of interest policy are available on legal documents section.