


The stock market continues to rise as investor confidence returns and earning season edges closer. Investors tend to become more interested in the stock market as earning season approaches, but momentum is only maintained if indeed company’s financial reports validate the stock value. Technical Analysts have advised the NASDAQ is officially in a bullish trend for the first time in 3 years. However, Fundamental Analysts voice concern about the second half of the year. This morning’s Future market shows green for the main global indices, including the SNP500, DAX, and CAC.
Over the past 24 hours, the US Dollar experienced mixed price movement with bullish and bearish waves. This morning the US Dollar Index is trading at the daily open price as the index continues reverting market trends. The Dollar experienced its strongest price movement against the Japanese Yen, where the exchange rate increased by 1.15%.
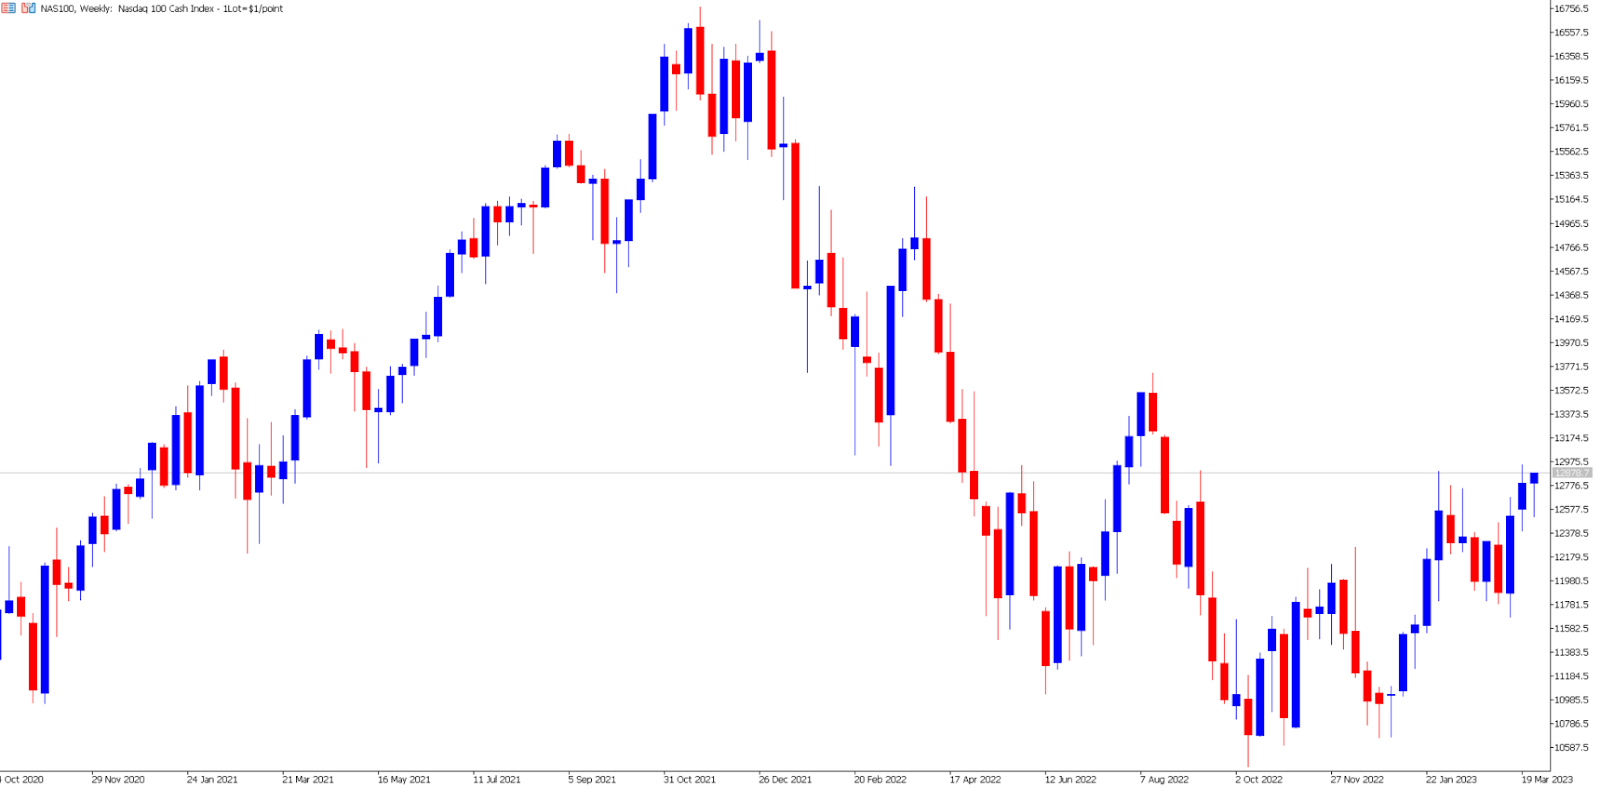
The NASDAQ Hits a 7-Month High.
Bulls again return to the NASDAQ and almost entirely regains previous declines seen earlier this week. The NASDAQ has been the best-performing index in 2023 but has struggled over the past two weeks due to the US liquidity market. However, the NASDAQ again was the best-performing index based on daily performance.
The index increased by 1.87%, higher than other US and European indexes. The SNP500 increased by 1.40%, the Dow Jones by 1.00%, and the DAX by 1.23%. The best-performing European Index was the CAC40 which climbed 1.40%.
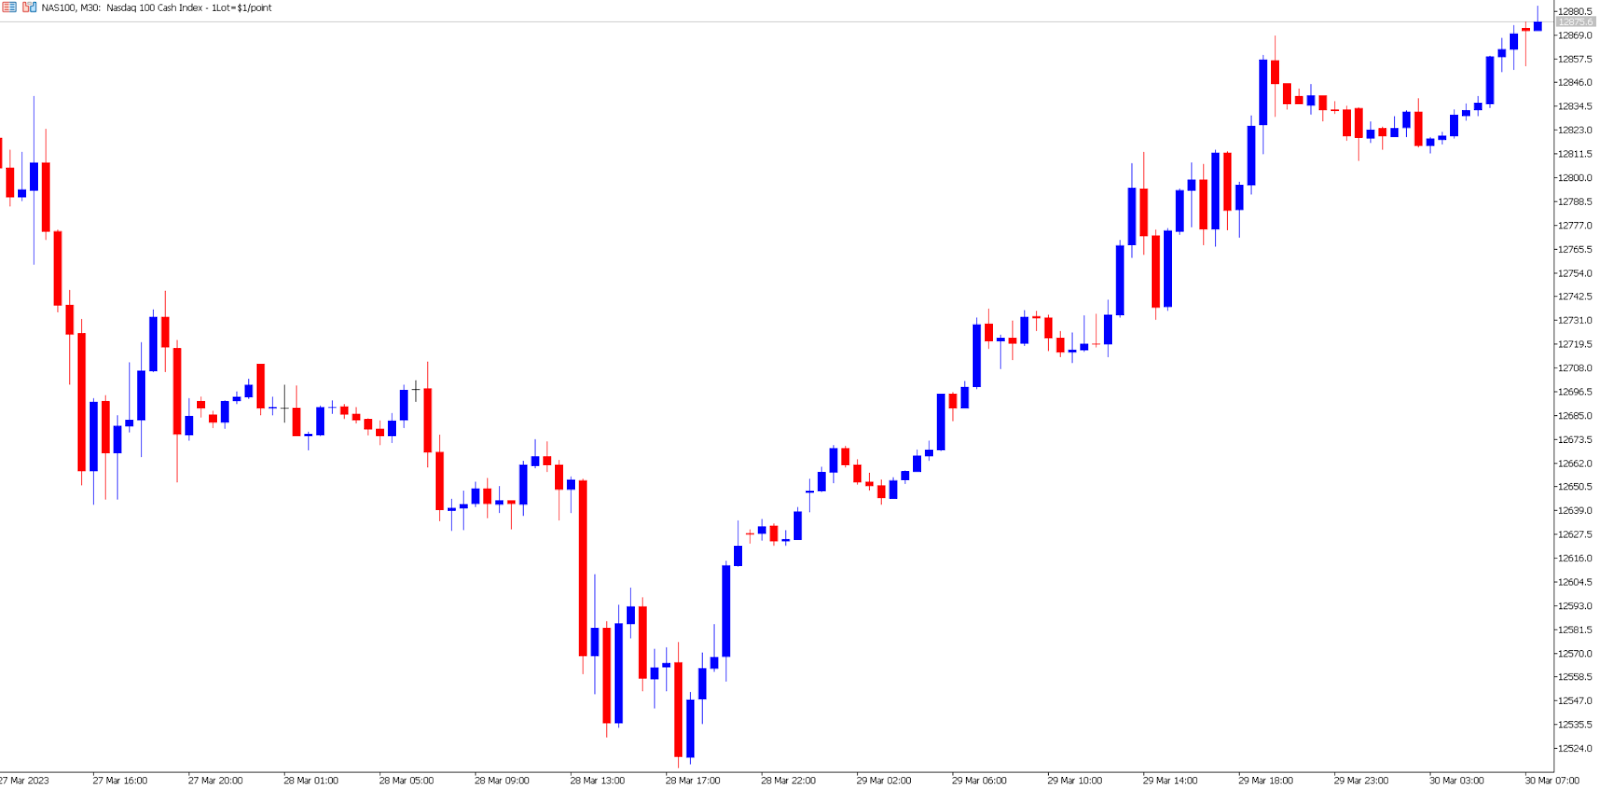
Technical analysis, including indicators and price action, continue to point towards an upward trend, as do footprint charts. Moving averages are crossed over upwards, and the price continues to form bullish breakouts this morning. The price is also trading in the upper Bollinger Band and above the neutral zone of the RSI. The only concern for technical analysts is the price does not find resistance at the previous price rejection levels. At these levels, traders can see “gravestone Dojis” formed on the 22nd and 23rd of March.
NASDAQ - Why has the NASDAQ experienced a solid bullish trend?
The keen interest from traders is partially related to technical analysis and the index's performance this year. The index trades at a discount after a difficult 2022, giving investors higher returns than other assets from different classes. In addition, the Bond market and specifically yields have made the stock market, in turn on income, more attractive for investors. Low bond yields can prompt traders to consider the stock market as an alternative, but only if investor confidence is sufficiently strong.
Investors are still attempting to exploit the Artificial Intelligence trend, mainly benefiting the NASDAQ and the technology sector. Lastly, the bullish trend has been partially fueled as technology companies have significantly decreased their workforce and expense-to-income ratios. Traders should note that a decrease in expenditure tends to fuel investor confidence, specifically if it does not affect ongoing projects and income. An excellent example of this is Disney, which again announced more layoffs for an unprofitable project. As a result, the stock climbed 2.16% during yesterday’s US session.
The NASDAQ Longer-Term Concerns
However, analysts mainly focus on the longer-term picture, and fundamental analysis is less keen. A recent example is Ninety One UK’s Portfolio Manager, Stephanie Niven, who advised this morning that they and many economists believe the NASDAQ may experience bullish price movement in the short term but will decline during the second half of the year. Mrs. Niven confirmed that Ninety One UK believes interest rates have a lagging effect on the economy and that the US will experience a recession in the year's second half. If the unemployment rate does rise and the economic growth significantly slows, it is indeed known to pressure the stock market. Regarding how much the index may decline, this will depend on the depth, duration and diffusion of the recession.
The NASDAQ Over the Next 24-Hours
In the short term, investors will monitor three major economic releases. The most important will be the Final Gross Domestic Product, which is scheduled for this afternoon, and tomorrow’s Core PCE Price Index. NASDAQ bulls will hope for a strong GDP figure but a lower-than-expected PCE Price Index. This would paint a picture of economic growth and declining inflation which paints towards a “soft landing”.
In addition, investors will also be monitoring the Unemployment Claims, which are expected to rise slightly from 191,000 to 196,000. The Unemployment Claims are still considerably low and cannot do any real damage unless higher than 250,000.
Summary:
- Technical Analysts have advised the NASDAQ is officially in a bullish trend for the first time in 3 years.
- The NASDAQ has been the best-performing index in 2023. The trend has been partially fueled by the AI trend, declining bond yields, and layoffs in the sector.
- Fundamental Analysts advise that the NASDAQ may experience bullish price movement in the short term but will decline during the year's second half.
- Investors turn their attention to the Final GDP, which is scheduled for this afternoon, and tomorrow’s Core PCE Price Index


