1. Home
  2. Markets Updates
  3. Is UK100 Ready For a Reversal?

Is UK100 Ready For a Reversal?

Look at today's financial market analysis, January 11, 2024!

11 January 2024

Share the article:

2024-01-11 13_58_51-Window.jpg

UK100 Daily Timeframe 11 January 2024

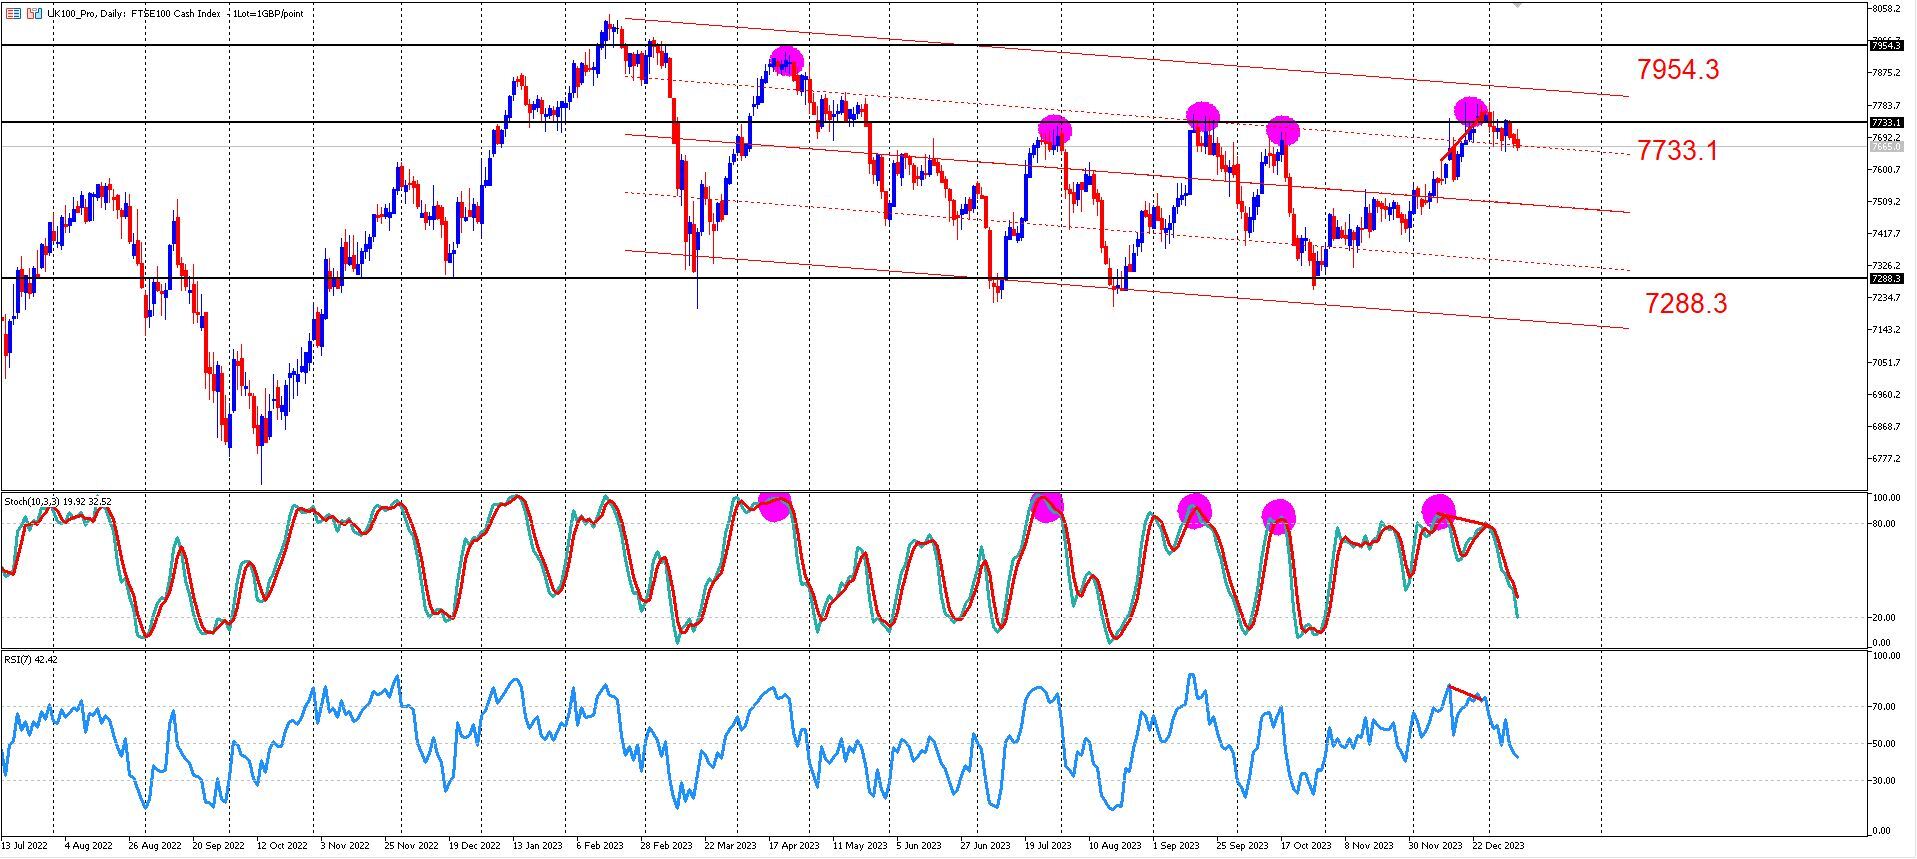
The UK100 on the daily timeframe, also known as the Footsie, has been moving in a strong uptrend until it plotted the study period high on 16 February 2023. This high sits at 8041.8. Since 16 February, the market has demonstrated strong mean reversion properties, as can be seen with a gentle downward-sloping regression channel added to the price, where rice oscillates above and below the mean in a somewhat predictable fashion.

This behavior places UK100 in the bearish camp. One might argue that the past two months of price action was a solid uptrend, which would be true for the short term. However, the trend is predominantly down if we take a zoomed-out view. 

Added to our downward bias is that we recently had the RSI and the Stochastic oscillator in the oversold territory. This signal is not a strong indication of an impending market reversal to the downside, but given the context of the market trading in the upper half of a downward-sloping regression channel, it adds significant weight to our outlook.

In red circles, one can see the four reversals that took place when similar setups occurred. 

But that's not the end of trouble for the bulls; combined with the overbought signals in the regression channel context, two very important factors place the bids squarely in favor of the bears.

First of which is the divergence on both the RSI and Stochastic oscillators.

Divergence is when, in this case, price action makes higher highs, but the oscillators make lower highs. This is a fairly reliable reversal signal. But coupled with the important support and resistance level, is it a setup of note? Price reached the 7733.1 resistance level and failed to trade above it with conviction.

This resistance area and the recent 7791.6 highs serve as an aggressive line in the sand. If bulls manage to push the price above this area, consider changing your bearish view. A more relaxed change point might be the 7954.3 resistance level or the top line of the channel. Any of these scenarios will invalidate the bearish view if surpassed with conviction.

As potential targets to the downside, the first and safest exit is usually the middle line of the regression channel. Which is roughly at 7500 psychological level.

If the bears continue their charge below this level, the next target is the 7288.3 support level, which proved very tough to subdue in the past.

Despite this, it's important to remain vigilant for any fundamental factors that could alter this perspective. From a technical standpoint, the bias remains firmly bearish until a close above recent highs indicates otherwise.

Summary

  1. The UK100 is currently in a well-respected downward-sloping regression channel.
  2. The bias is to the downside, with targets roughly at:
    1. Target 1: 7500
    2. Target 2: 7288.3
  3. The RSI and Stochastic oscillators confirm the bias with their overbought and divergent readings.
  4. The recent failure to stay above the 7733.1 level and the price being in the top half of the channel also add significant weight to the downside.
  5. A convincing close above the 7791.6 resistance level will call for caution to bet on the downside.
  6. A convincing close above the top trend line of the channel will invalidate the bearish outlook, which we can use to open a potential buy with a target of 7954.3.
IMPORTANT NOTICE: Any news, opinions, research, analyses, prices or other information contained in this article are provided as general market commentary and do not constitute investment advice. The market commentary has not been prepared in accordance with legal requirements designed to promote the independence of investment research, and therefore, it is not subject to any prohibition on dealing ahead of dissemination. Past performance is not an indication of possible future performance. Any action you take upon the information in this article is strictly at your own risk, and we will not be liable for any losses and damages in connection with the use of this article.
RISK WARNING: CFDs are complex instruments and come with a high risk of losing money rapidly due to leverage. A high percentage of retail client investors lose money when trading CFDs with this provider. You should consider whether you understand how CFDs work and whether you can afford to take the high risk of losing your money.

Related articles

Euro-Dollar Stuck in Sideways Channel, Eyes 1.1850 or 1.141
4 September 2025
The euro-dollar rally stalls as EUR/USD trades sideways near mid-range. Discover critical support, resistance, and market catalysts shaping the pair’s next breakout opportunity.

Read more

USDJPY Pinned at 146.80 as Breakout Tension Builds
28 August 2025
USDJPY consolidates around 146.80 with traders eyeing 146.00 support and 150.90 resistance. Daily chart outlook and market drivers explained.

Read more

EURUSD Consolidates After Strong May-July Rally
21 August 2025
EURUSD trades in a narrow range following a bullish run, showing indecision between 1.1600 and 1.1800. Technical indicators point to potential momentum shifts in the coming sessions.

Read more

Need Help? Visit our Help Section
Download NAGA Trader

Copyright © 2025 – All rights reserved.

NAGA is a trademark of The NAGA Group AG, a German based FinTech company publicly listed on the Frankfurt Stock Exchange | WKN: A161NR | ISIN: DE000A161NR7.

The website is operated by JME Financial Services (Pty) Ltd an authorised Financial Services Provider, regulated by the Financial Sector Conduct Authority in South Africa under license no. 37166. JME Financial Services (Pty) Ltd is located at Suite 10, 21 Lighthouse Rd 201 Beacon Rock, Umhlanga Rocks, Kwa-Zulu Natal, 4320, South Africa.

JME Financial Services (Pty) Ltd acts as an intermediary between the investor and NAGA Capital Ltd, the counterparty to the contract for difference purchased by the Investor via Naga.com/za. NAGA Capital Ltd is authorised and regulated by the Financial Services Authority Seychelles (FSA) under licence No. SD026. NAGA Capital Ltd is the principal to the CFD purchased by investors on this website. Other group entities: NAGA Markets Europe LTD which is authorised and regulated by the Cyprus Securities and Exchange Commission (CySEC) under licence No. 204/13.

RISK WARNING: Derivatives are complex instruments and come with a high risk of losing money rapidly due to leverage. You should consider whether you understand how derivatives work and whether you can afford to take the high risk of losing your money. The value of financial products can increase as well as decrease over time, depending on the value of the underlying securities and market conditions. Illustrations, forecasts or hypothetical data are not guaranteed and are provided for illustrative purposes only. JME Financial Services (Pty) Ltd does not render advice in respect of the CFD’s offered on this website. Before making an investment decision, you should rely on your own assessment. The Company’s disclaimer, conflict of interest policy are available on legal documents section.