


The US Dollar has kept within the price range formed after last week’s inflation figures. This has resulted in strong price corrections and a symmetrical triangle pattern. The pattern has served well for traders using reversion strategies. The stock market has also formed a symmetrical pattern where the price has formed higher lows but lower highs. In both scenarios, it is important that traders monitor breakout points and significant price levels such as resistance levels.
Though traders should note that the price movement is also influenced by earnings. Goldman Sachs will release their earnings before the US session opens. Also, Netflix will release its earnings on Thursday after the market closes. The earnings report is affecting the overall investor sentiment toward the stock market. Traders can also check out our latest technical analysis video where our market analyst, Michalis Efthymiou, dives deeper into the NASDAQ’s price movement.
The price movement for crude oil does differ from the stock market and US Dollar. The asset has not formed a symmetrical pattern but has declined to lower lows. The previous resistance point which has also formed a psychological price has influenced the recent price movement. The resistance level formed on December 27th and then again on January 3rd. On both occasions, the resistance levels caused a decline between 5-10%.
The latest Gross Domestic Product figure for China has pressured the price of Crude Oil this morning. China saw its second slowest growth in GDP since the 1970s which worried traders but economists have noted that the figures are slightly better than expected. China’s GDP figure grew 3%, which is 0.2% more than expected. Analysts expect the Chinese economy to pick up pace after fiscal support and less COVID-19 restrictions. Economists determine economic growth using the country's Gross Domestic Product.
XAU/USD
The price of Gold has formed a clear downward trend pattern after a lower low and lower high. This can be seen mainly on smaller timeframes, but the price movement has formed nothing more than a retracement on larger timeframes. The price this morning has declined by a further 0.41% and has now reached the previous “flipped level”. It is at this point that traders will eagerly monitor whether the price will follow the longer-term trend or form a correction.
As mentioned previously within our market analysis, the instrument had increased consecutively for 6 days and was overbought on most indications. Therefore, as previously mentioned, a bearish retracement was possible. When looking at regression channels on the 3-hour timeframes the price still remains within the bullish zone and has reached a support level.
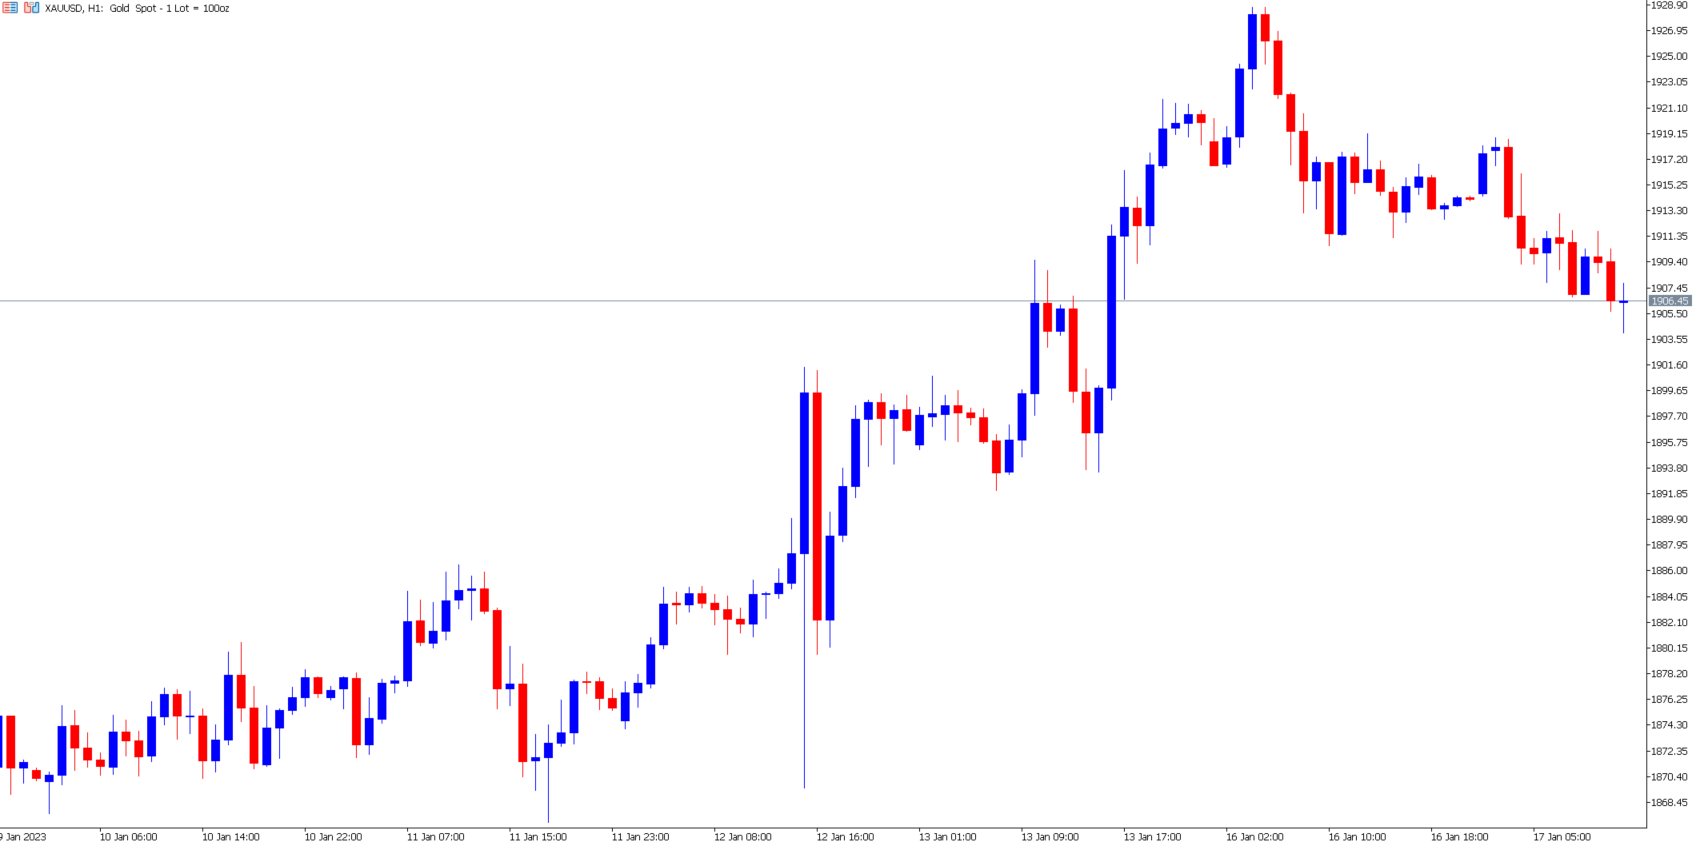
The US Dollar and the global monetary policy will continue influencing the price of Gold. Currently, the US Dollar is showing little price movement due to the recent bank holiday, but traders are hoping for another impulse wave that will assist with their analysis of Gold. The US Dollar this morning is only slightly higher than the open price. The price of the US Dollar Index is 102.30 but still is witnessing some bearish volatility.
Investors will also be monitoring the policy decisions of global banks including the Federal Reserve, Bank of England and European Central Bank. The risk of recession has decreased due to a correction in energy prices, specifically gas, and a decline in inflation. However, will a higher risk sentiment pressure Gold or support Gold due to a weakening monetary policy? This is something that economists will be analyzing over the next few months.
The US Commodity Futures Trading Commission has advised that investors continue to increase their exposure to Gold and the number of speculative positions has increased by almost 6% in a single week. According to the UCFTC, more positions are held speculating a decline against an increase. Therefore, many traders believe the commodity may be overbought in the longer term.
Earning season is influencing the price of Gold due to its safe haven status. A strong decline or spike in the stock market can influence investors' need for safe-haven assets. Traders will also be monitoring this week’s Producers Price Index scheduled to be released tomorrow.
Summary:
- The US Dollar remains within the reoccurring price range but other assets form symmetrical triangle patterns. Traders focus on breakout points.
- Gold forms an expected retracement after 6 days of strong declines. UCFTC report shows most traders believe the asset is overbought.
- Stocks and Gold are likely to be influenced by tomorrow’s Producer Price Index and earning reports.
- Goldman Sachs will release their earnings for the previous quarter and Netflix on Thursday night.


