


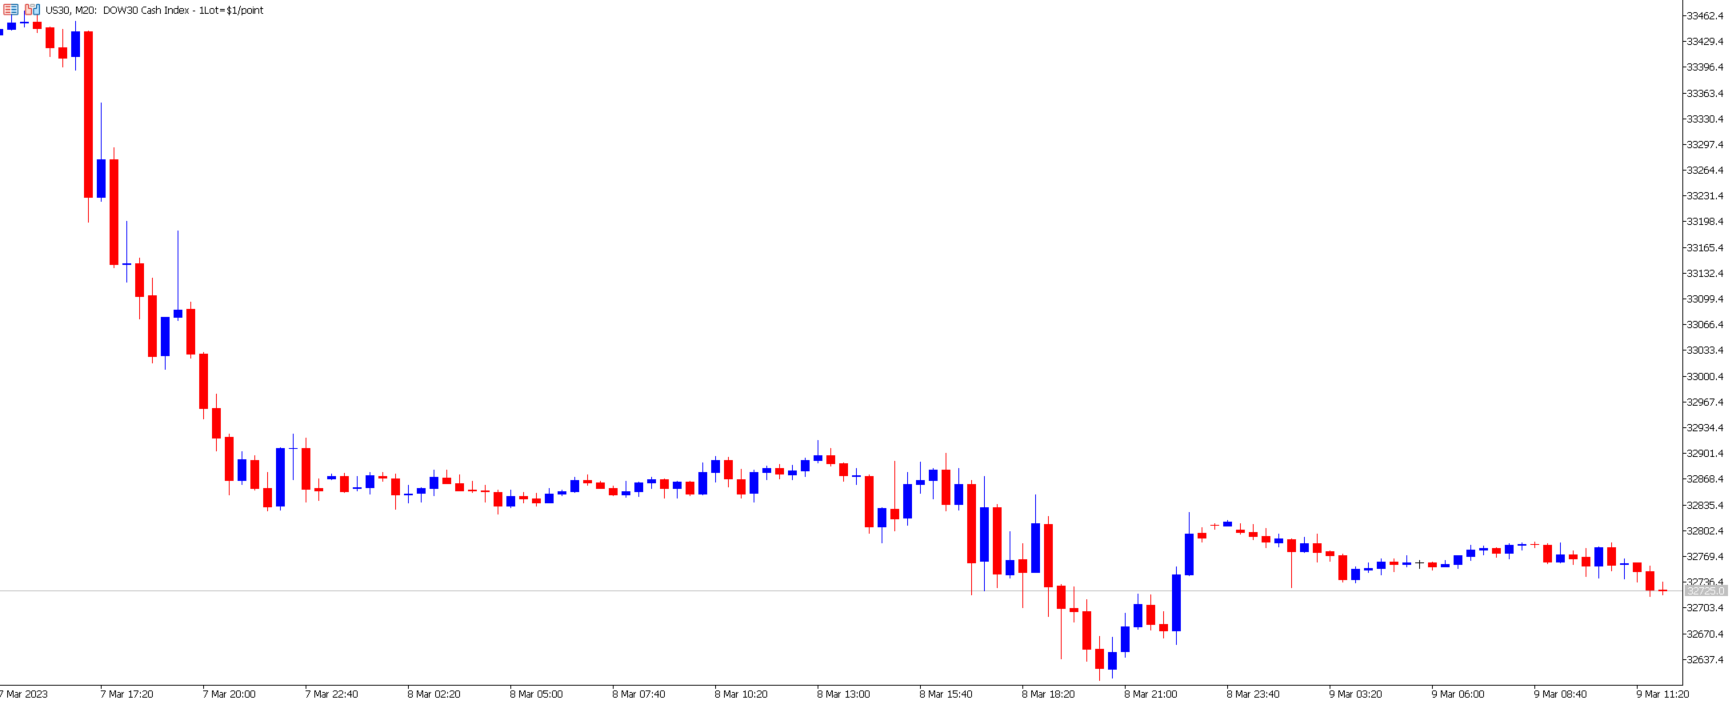
The US Dollar price has remained stable and has maintained gains from Tuesday. The US Dollar Index slightly declines during this morning’s Asian session measuring 0.14%. However, the Index remains considerably higher than the week’s open price and has formed nothing more than a retracement so far. The US Stock market has declined to a new weekly low but is experiencing bearish and bullish impulse waves.
The testimony by the Chairmen of the Federal Reserve has continued to influence the price movement of both the Dollar and US indices. Some economists have stated the tone was slightly less hawkish in the second day’s testimony, but most believe nothing has fundamentally changed. However, investors were also monitoring various economic data, pointing to pressure on the stock market and support for the Dollar. The 10-Year Bond Auction saw Bond Yields significantly increase from 3.60% to 3.99%, which indicates that investors believe interest rates will continue to climb.
Higher bond yields tend to support the price of the Dollar and draw away investors from the stock market. Higher yields are considered negative for stocks, prompting investors to consider bonds instead of stocks. Nonetheless, this does not mean an instant decline; traders will still need to monitor price action and other drivers. The main drivers over the next 2 weeks will likely be tomorrow’s Unemployment Rate, Non-Farm Payrolls, and next week’s inflation figures.
Yesterday's employment figures continue to point toward an unbalanced employment sector. The ADP Non-Farm Employment Change increased to 242,000 from 119,000 and was 45,000 more than the previous thought. The JOLTS Job Openings also came in 240,000 more than expected.
EUR/USD
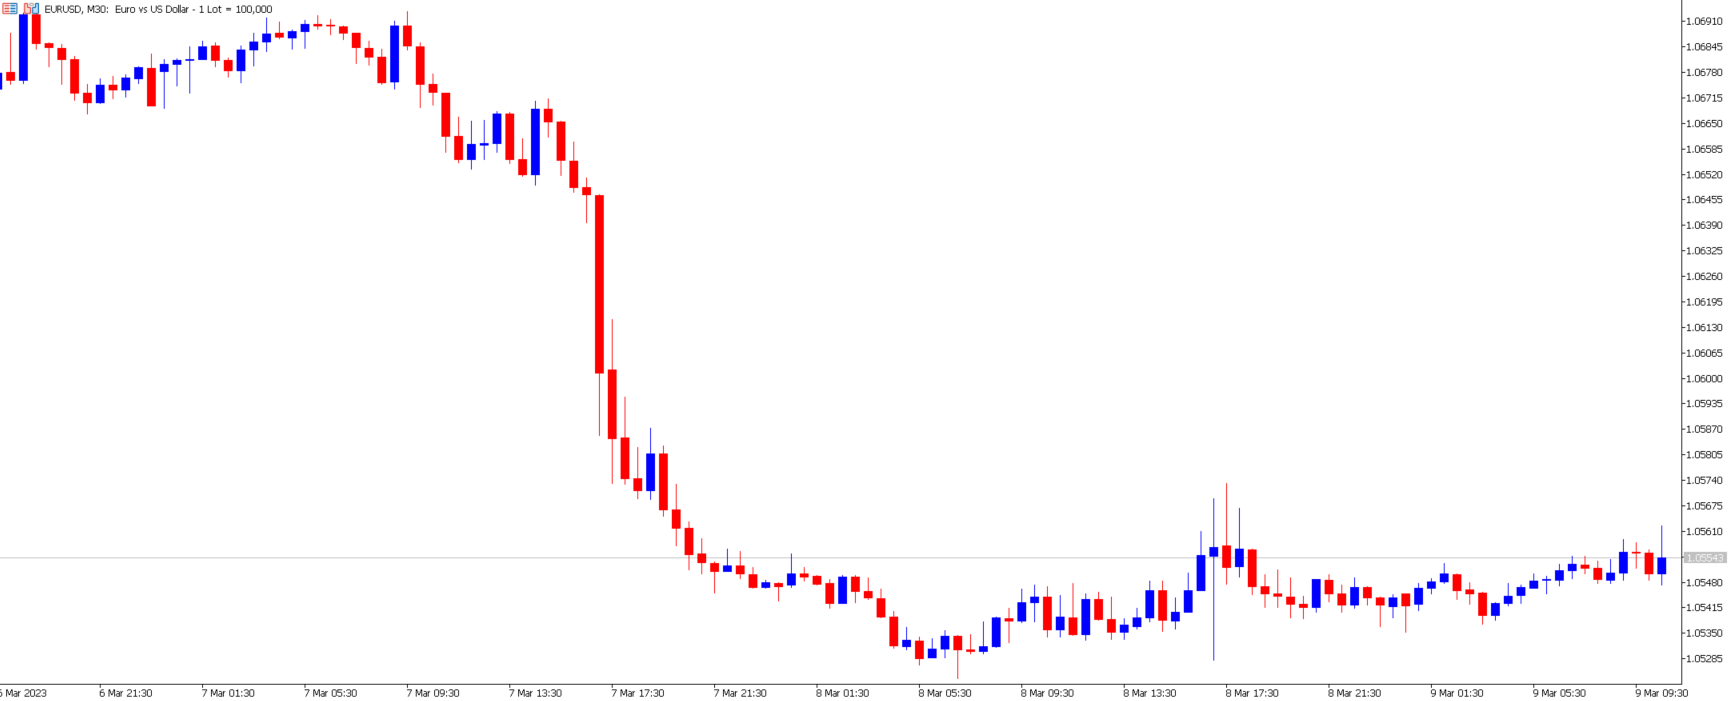
The EUR/USD has moved mainly sideways, as expected after such a strong collapse. After a strong impulse wave, the market tends to hold until further price drivers influence the price. Over the past 4 trading sessions, the exchange rate has formed strong price rejection levels at 1.05232 and 1.05738. These levels can be used as signal support, resistance, and breakout levels.
Both currencies are experiencing mixed performance against different counter currencies. The Euro has managed to gain against the Pound but is declining against the Yen and the Franc. Due to the current horizontal trend, the technical analysis must clearly indicate the next price movement. However, larger timeframes are pointing towards a downward trend with possible retracements.
German statistics from yesterday were slightly better than expected. Industrial production rose by 3.5% instead of the 1.4% expected, but retail sales fell by 0.3% over the same period instead of an expected increase of 2.0%. However, the current main driver is the central bank’s monetary policy. The European Central Bank is expected to raise the rate by 2% and the Federal Reserve by 1%. This would take the Fed’s Fund Rate to 6%, the highest since before the 2008 banking crisis.
To better understand how interest rates may change over spring, investors will be looking at 3 figures. First, investors will analyze tomorrow’s NFP Figures, next week’s Consumer Price Index, and Producer Price Index. Higher-than-expected figures will most likely force the Fed’s hands toward becoming more hawkish. These three events are likely to greatly impact the US dollar price and the global stock market.
NASDAQ
The NASDAQ is being influenced by similar factors as mentioned above. The NASDAQ has come under pressure as per the whole global stock market. However, the NASDAQ has performed significantly better than other indices. During yesterday’s US session, the NASDAQ dropped to a new low but climbed higher shortly afterward.
The price of NASDAQ has been supported by chipmakers such as Nvidia, which have grown in demand. Nvidia, for example, increased by more than 4% during yesterday’s session after the CEO, Mr. Jensen, boosted investor confidence in AI. The technology sector has also been supported by the AI drive in 2023. The asset can still be pressured if the general market sees a significantly lower investor sentiment.
Traders can also obtain more signals and technical analysis information via our latest video below.
NASDAQ Technical Analysis Video
Summary:
- The 10-Year Bond Auction saw Bond Yields significantly increase from 3.60% to 3.99%, which indicates that investors believe interest rates will continue to climb.
- ADP Non-Farm Employment Change increased to 242,000 from 119,000 and was 45,000 more than the previous thought.
- NASDAQ has been supported by chipmakers and AI-related stocks such as Nvidia, which have grown in demand.
- NFP, CPI, and PPI key for pricing the US Dollar and Indices.


