1. Home
  2. Markets Updates
  3. Bulls vs. Bears: EUR/USD Battle at 1.09 — What's Next?

Bulls vs. Bears: EUR/USD Battle at 1.09 — What's Next?

EURUSD analysis reveals a volatile downtrend, followed by a breakout towards resistance

Updated September 29, 2025

Share the article:

EURUSD_ProH1.png
EUR/USD 1-Hour Timeframe, 22 February 2024


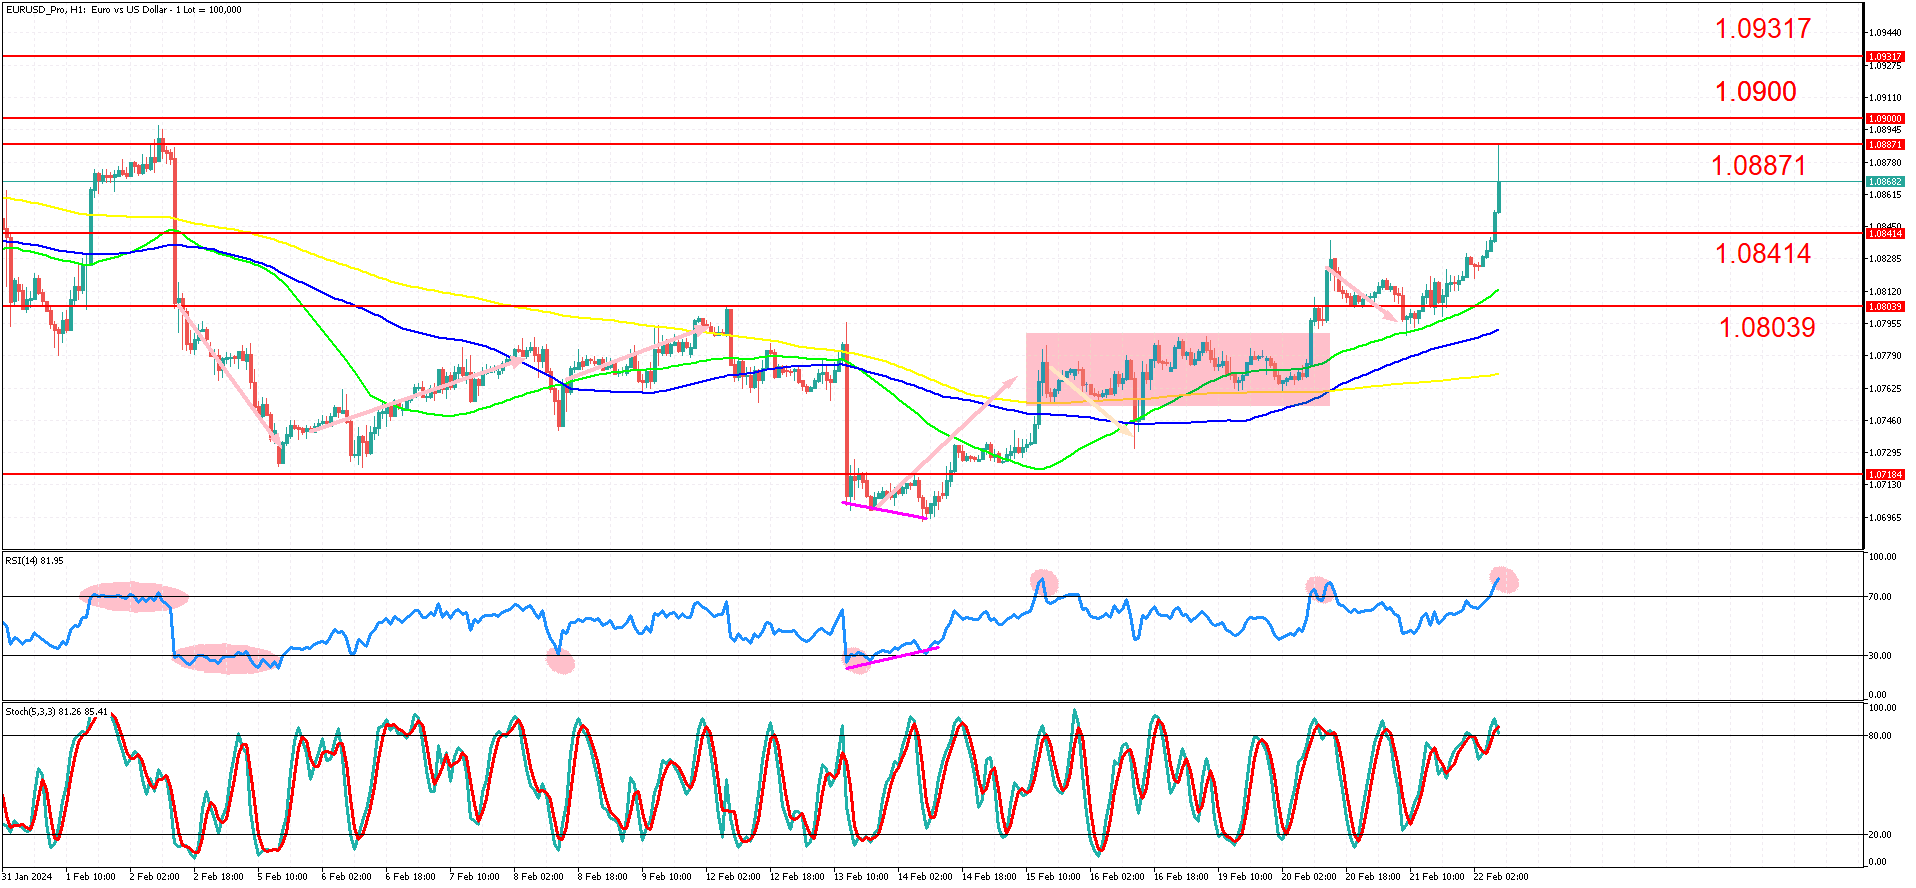
The EUR/USD has been experiencing a volatile downtrend in the 1-hour timeframe until it hit the low point of 1.069 on Valentine's Day (February 14th). A clear reversal sign was indicated by the divergence between the RSI and price, as shown by the purple lines on the chart. Divergence occurs when the price moves in one direction (in this case, downward), but our indicator (RSI) moves in the opposite direction (upward, in this case).

After divergence and subsequent upward movement, the market remained relatively stable for four consecutive days. However, this type of ranging behavior is often followed by significant and sudden breakouts, as was the case here.

On February 20th, the market broke out of the trading range (shown in a pink square) and experienced a strong upward push, approaching the resistance zone of 1.088 to 1.090.

Recent PMI figures for France exceeded expectations and contributed to the overall push higher.

Despite the bulls' efforts, they couldn't maintain their momentum or break through the 1.088/1.090 level. At the time of writing, a significant shooting star pattern had formed, hinting at a correction to the downside.

We are presently in an uptrend as EUR/USD is forming higher highs and higher lows. This upward bias is confirmed by the moving averages (200, 100, and 50), all pointing up and supporting price. Especially the 50-period simple moving average acts as a reliable dynamic support and resistance level.

As a trader, contrasting with a passive investor, timing the market is essential. It appears that the market might move downwards before breaking through the 1.090 level. The RSI has been a reliable turning point predictor for the pair, although not always perfect. One can observe the pink markings on the chart that showcase the overbought and oversold levels coupled with significant corrections on the chart. Currently, the RSI is at 82, indicating another strong overbought level. The stochastic oscillator also suggests the same, along with the current inverted hammer candlestick formation.

The market seems to be overextended and could undergo a correction soon. In such a scenario, the next logical level of support would be the 1.08414 support or possibly the 50-period simple moving average. However, if recent lows are convincingly breached, we may even see the market drop to the 1.07184 level.

On the other hand, if the bulls can push through the 1.090 psychological barrier, we could be in for a bull run that may only stop at the 1.09317 level.

Given the busy economic calendar, traders should keep an eye on changing sentiment and microeconomic themes.

Summary:

  • Recent Valentine's Day divergence led to a market reversal, initiating an uptrend.
  • Despite the longer-term bullish bias, an overbought RSI and a prominent shooting star suggest a short-term reversal downwards.
  • Failure to surpass the current candle's high could lead to a decline towards 1.08414 or the 50/100 period simple moving average zone.
  • Bulls aiming to break above the 1.09 psychological barrier may target the 1.09317 level.
  • Stay vigilant with the economic calendar for potential shifts in sentiment.
IMPORTANT NOTICE: Any news, opinions, research, analyses, prices or other information contained in this article are provided as general market commentary and do not constitute investment advice. The market commentary has not been prepared in accordance with legal requirements designed to promote the independence of investment research, and therefore, it is not subject to any prohibition on dealing ahead of dissemination. Past performance is not an indication of possible future performance. Any action you take upon the information in this article is strictly at your own risk, and we will not be liable for any losses and damages in connection with the use of this article.
RISK WARNING: CFDs are complex instruments and come with a high risk of losing money rapidly due to leverage. A high percentage of retail client investors lose money when trading CFDs with this provider. You should consider whether you understand how CFDs work and whether you can afford to take the high risk of losing your money.

Related articles

Euro-Dollar Stuck in Sideways Channel, Eyes 1.1850 or 1.141
October 7, 2025
The euro-dollar rally stalls as EUR/USD trades sideways near mid-range. Discover critical support, resistance, and market catalysts shaping the pair’s next breakout opportunity.

Read more

USDJPY Pinned at 146.80 as Breakout Tension Builds
October 6, 2025
USDJPY consolidates around 146.80 with traders eyeing 146.00 support and 150.90 resistance. Daily chart outlook and market drivers explained.

Read more

EURUSD Consolidates After Strong May-July Rally
October 6, 2025
EURUSD trades in a narrow range following a bullish run, showing indecision between 1.1600 and 1.1800. Technical indicators point to potential momentum shifts in the coming sessions.

Read more

Need Help? Visit our Help Section
Download NAGA Trader

Copyright © 2025 – All rights reserved.

NAGA is a trademark of The NAGA Group AG, a German based FinTech company publicly listed on the Frankfurt Stock Exchange | WKN: A161NR | ISIN: DE000A161NR7.

The website is operated by JME Financial Services (Pty) Ltd an authorised Financial Services Provider, regulated by the Financial Sector Conduct Authority in South Africa under license no. 37166. JME Financial Services (Pty) Ltd is located at Suite 10, 21 Lighthouse Rd 201 Beacon Rock, Umhlanga Rocks, Kwa-Zulu Natal, 4320, South Africa.

JME Financial Services (Pty) Ltd acts as an intermediary between the investor and NAGA Capital Ltd, the counterparty to the contract for difference purchased by the Investor via Naga.com/za. NAGA Capital Ltd is authorised and regulated by the Financial Services Authority Seychelles (FSA) under licence No. SD026. NAGA Capital Ltd is the principal to the CFD purchased by investors on this website. Other group entities: NAGA Markets Europe LTD which is authorised and regulated by the Cyprus Securities and Exchange Commission (CySEC) under licence No. 204/13.

RISK WARNING: Derivatives are complex instruments and come with a high risk of losing money rapidly due to leverage. You should consider whether you understand how derivatives work and whether you can afford to take the high risk of losing your money. The value of financial products can increase as well as decrease over time, depending on the value of the underlying securities and market conditions. Illustrations, forecasts or hypothetical data are not guaranteed and are provided for illustrative purposes only. JME Financial Services (Pty) Ltd does not render advice in respect of the CFD’s offered on this website. Before making an investment decision, you should rely on your own assessment. The Company’s disclaimer, conflict of interest policy are available on legal documents section.