


The financial trading markets over the past week have seen the 3 major global banks confirm their interest rate decision. All decisions were as expected, but the major shock came from the US’s employment figures. Over the past 4 months, US employment figures slowed as the Federal Reserve kept to its hiking policy. We could see the effect of the restrictive monetary policy as the Non-Farm Payroll declined from over 500,000 in August to 223,000 in January.
On Friday, the NFP was again expected to show a slowdown, on average most economists believed the figure would decline to 190,000. However, the NFP read 517,000 almost matching August’s reading. In addition, the US’s Unemployment Rate declined to 3.4%, the lowest since 1970! The US simultaneously confirmed its ISM Services Purchasing Managers’ Index which also came in at 55.2, up from 49.6 in December. A reading above 50.0 is known to signal economic growth.
In addition to the above, the stock market also witnessed a break in the bulls’ strong 4-week run. The best-performing US index over the past month has been awarded to the NASDAQ but saw a 3% decline towards the end of the week. This resulted from disappointing earnings from Apple, Alphabet, and Amazon. However, the price remains significantly higher than the price ranges experienced from October to December 2022.
GBP/USD - Dollar climbs as Unemployment hits a 53-Year-Low
The GBP/USD experienced significant declines on Thursday and Friday as the US Dollar Index rose above 103.00. The exchange rate opened on a lower gap this morning but has since slightly increased in value. Nonetheless, the price of the exchange remains under pressure from multiple influencing factors.
As mentioned above, the US Dollar found its opportunity to climb with the bullish stock trend breaking and the employment figures brought new confidence. Over the 2 trading days, the GBP/USD declined by 2.80%. This leaves the price hovering between 2 major support and resistance levels. The resistance level has formed at 1.2445 and the support at 1.1836.
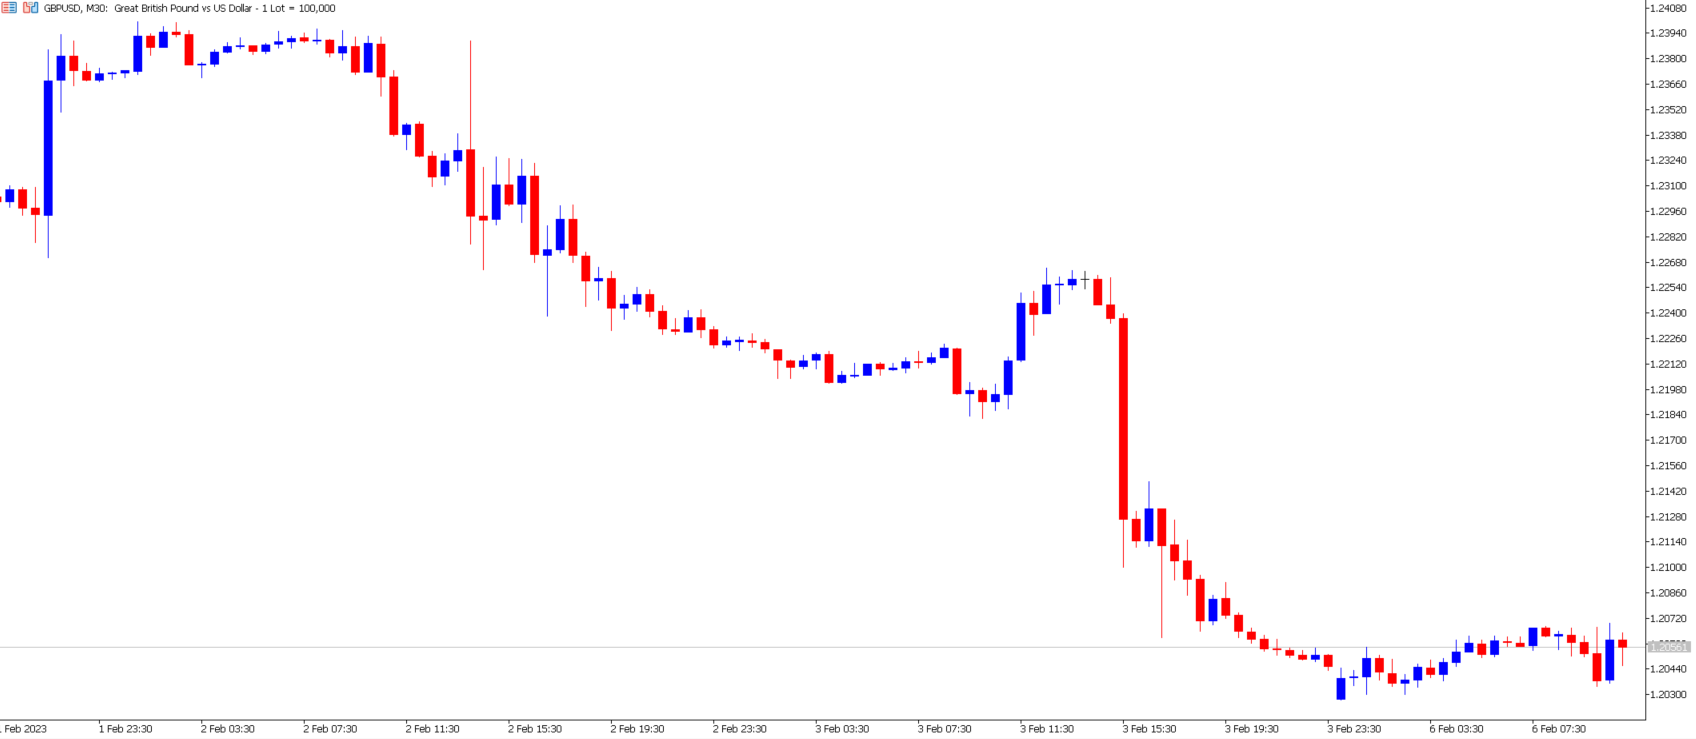
The US Dollar saw bullish price movement against all competitors but saw more movement against the Pound than most other currencies. The British Pound has been struggling over the past week due to local worker strikes, poor economic data, and the current high risk of a recession compared to other economies. According to experts, this is also something that was seen in the country’s latest PMI, which significantly declined due to civil servant protests and Brexit.
During this morning’s Asian session, the instrument formed a slight retracement measuring 0.33%. However, the price waves continue to form a bearish trend pattern. The Relative Strength Index and Moving Averages also indicate a downward trend. However, technical analysis on larger timeframes such as the daily, shows signs of the price finding potential support. Therefore, traders will largely be monitoring the price direction, momentum, and possible breakouts of support and resistance levels.
Crude Oil - Goldman Sachs see another Bullish Run
The price of Crude Oil rises during today’s trading while investors turn their attention to previous support levels. The asset’s price saw significant declines towards the end of last week measuring more than 7%. However, even with the bearish price action, investors remain cautious and unconvinced that the price will renew recent lows.
The most recent low was in December when the price declined to $70.22, however, the price has formed 3 higher lows on the daily timeframe. On the daily timeframe, the price forms an ascending triangle pattern known as a bullish signal in the longer term. However, this will all depend on whether the price rises over the next 2 days or forms a bearish breakout.
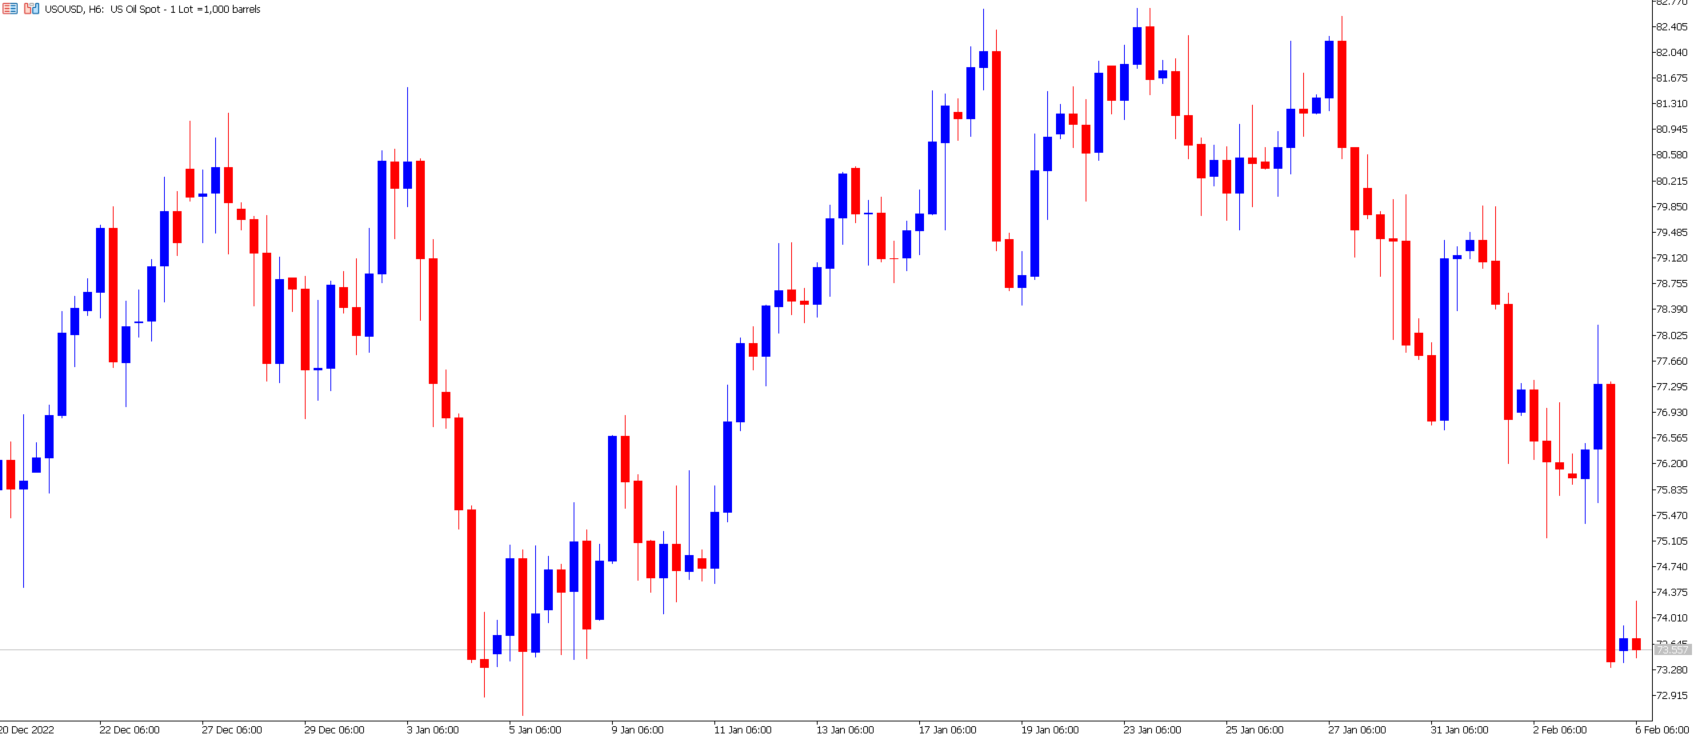
Goldman Sachs is one of the institutions which believe the price is likely to rise over the next 2-3 quarters. According to the investment bank, the price of crude oil is likely to be supported by 2 main factors. The first is the G7 sanctions on Russian oil this month which may significantly lower the supply within the global market. The second is China's economic recovery which may also increase the level of global demand.
Summary:
- The US Dollar Index climbs above 103.00 after 2-days of significant increases.
- The US Dollar obtains support from positive employment figures. The US Unemployment Rate hits a 53-year low.
- The US ISM Services Purchasing Managers’ Index reads 55.2, up from 49.6 in December and indicates economic growth.
- Crude oil forms an ascending triangle pattern, while Goldman Sachs sees the price witnessing another bullish trend.


