
Investors prepare for increased volatility across all assets as the Consumer Price Index release is now only hours away. The CPI announcement is likely to cause strong price movements across most asset classes due to its influence on the economy and specifically the central bank’s monetary policy.
Consumer Price Index - What is Expected?
The CPI figure is going to be the deciding factor as to whether we get 25 or 50 basis points in February. In addition to this, the market is also still undecided on whether the Federal Reserve will hike for 1 or 2 more months. The inflation rate in the second half of last year declined from 9.1% to 7.1%, but this still is a milestone away from the Fed’s target of 2%.
Today’s announcement is expected to be between -0.1% to 0.0% which will bring the inflation rate down to 6.5%. If inflation does indeed decline by a further 0.6%, it would take the inflation rate down to a 14-month low. Economists have advised that their prediction of a lower inflation rate is mainly due to lower commodity prices and a slowdown in consumer demand.
The lower demand can also be seen in yesterday’s report from the World Bank. The report advised that the global economy is close to recession this year and that worldwide growth is likely to decline to 1.7%. This is well below the previously expected gain of 3%. The US economy is expected to grow 0.5% against the previous expectation of 2.4%.
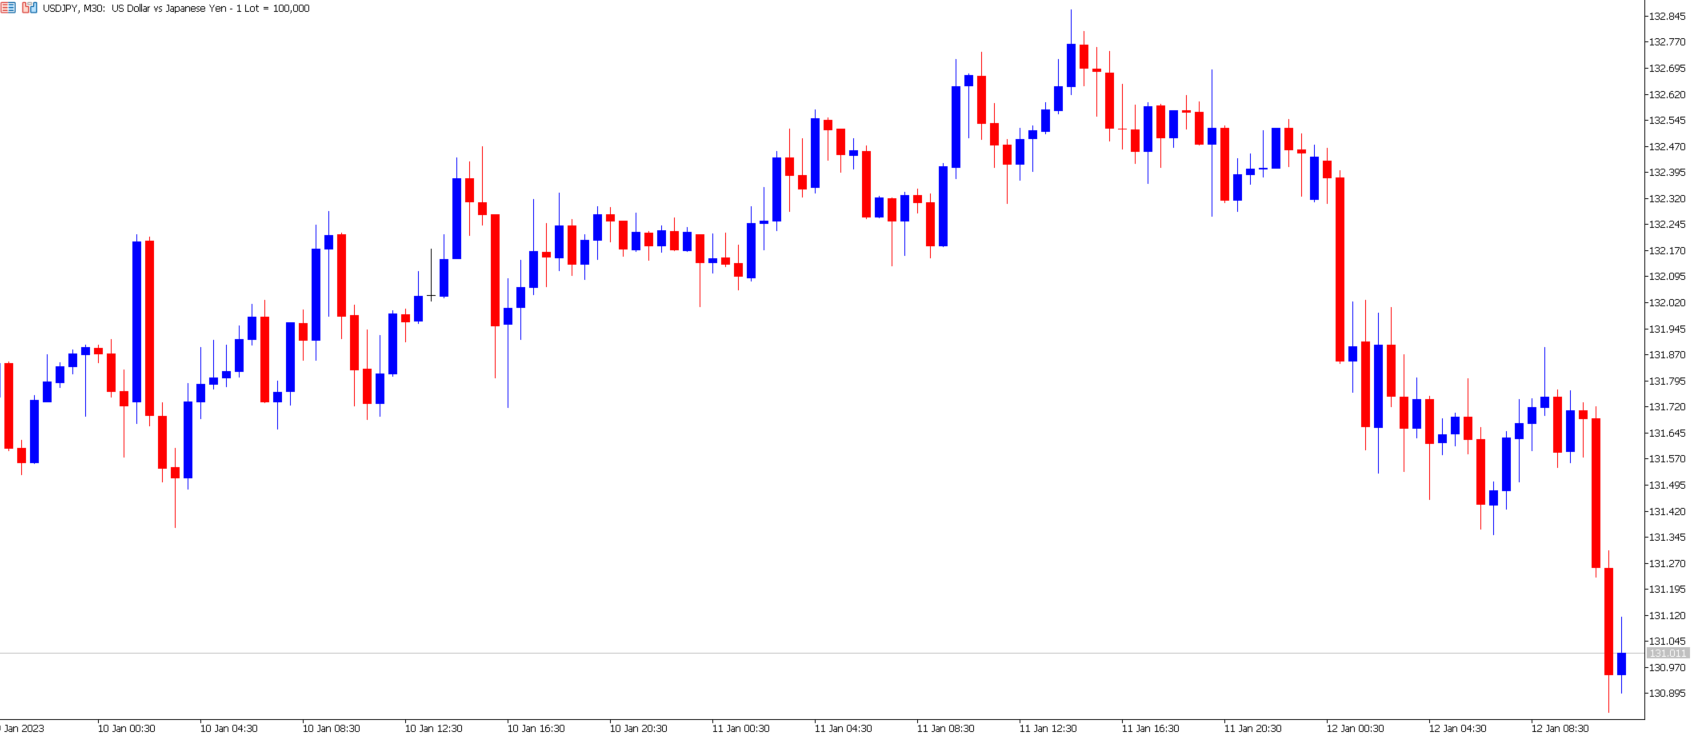
Traders should note that the inflation rate cannot be certain until the announcement is made. Markets are specifically likely to be volatile if the release reads differently from that which is expected. The US Dollar during this morning’s session continues to remain under pressure. The US Dollar Index has declined by 0.13% and continues to hover around price lows.
US and European Stocks
When looking at both European and US equities, we can see both are experiencing stronger bullish price movements compared to December. This is partially due to the upcoming earnings season, but mainly due to a change in sentiment toward the global monetary policy.
The Federal Reserve has specifically become less hawkish compared to the European Central Bank. The European Central Bank in December saw more than ⅓ of its members vote for a 75 basis point rate hike. In addition to this, the EU is currently seeing an inflation rate of more than 9%. Therefore we can see not only a more hawkish stance but also a stronger need for interest rate hikes.
Yesterday, a French Central Bank official during a conference advised that the country's economy grew by 0.1%. In addition to this, the recovery in business activity and the resumption of the work of several nuclear power plants, have brought energy prices down. Regulatory officials also confirmed that supply problems with French companies are gradually being resolved.
Currently both the Euro and European stocks are outperforming their US competitors. Potentially this may be related to the change in the Fed’s monetary policy, but today’s CPI announcement will also be an influential factor. Take a look at our latest technical analysis video below where our educator, Jacques, dives deeper into understanding NASDAQ’s price movement.
Bitcoin Reaches a 2-Month High
The price of Bitcoin over the past 24 Hours has increased by almost 5%. One of the main causes is the US Dollar’s decline in value and slightly higher risk sentiment. The market is experiencing a further risk sentiment regardless of the higher risk of recession. The cryptocurrency market capitalization has increased from $815 billion to over $883, which is deemed to be a significant increase. Bitcoin’s market share has also slightly increased to almost 40%.
The price movement of Bitcoin is forming a clear Elliot Wave-style bullish trend and has successfully formed bullish breakouts. The price is also moving above all major Moving Averages which gives further indications of potential bullish price movement going forward. However, traders should be cautious that the price is currently overbought on the Relative Strength Index. The RSI may be indicating a retracement after the latest impulse wave.
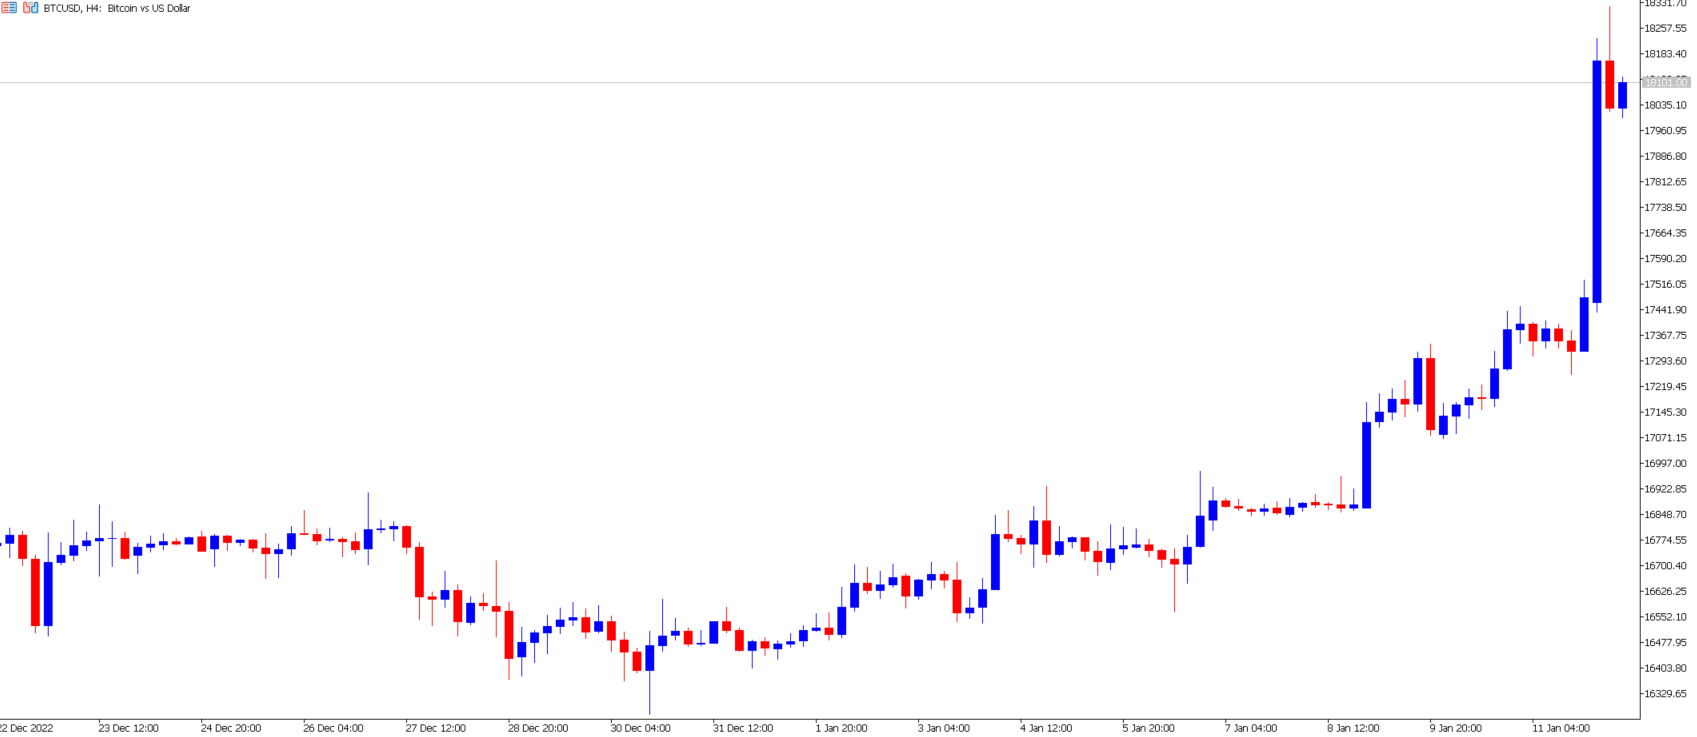
Bitcoin/USD 4-Hour Chart on January 12th
The cryptocurrency market has also been supported by a recovery of more than $5 billion from the FTX closure. The funds are to be used to repay back creditors, in other words, investors and traders. Economists believe this may improve confidence within the industry as a whole.
Summary:
- The US Dollar Index again declines as December’s Consumer Price Index edges closer.
- Inflation is expected to decline to 6.5% largely due to lower commodity prices and global demand.
- The European stock market outperforms its US competitors, but that is about to change while the ECB remains more hawkish than the Fed.
- Bitcoin increases to a 3-month high and is supported by the latest $5 billion recovery from the FTX closure.