Past performance is not indicative of future results. All historical data, including but not limited to returns, volatility, and other performance metrics, should not be construed as a guarantee of future performance.
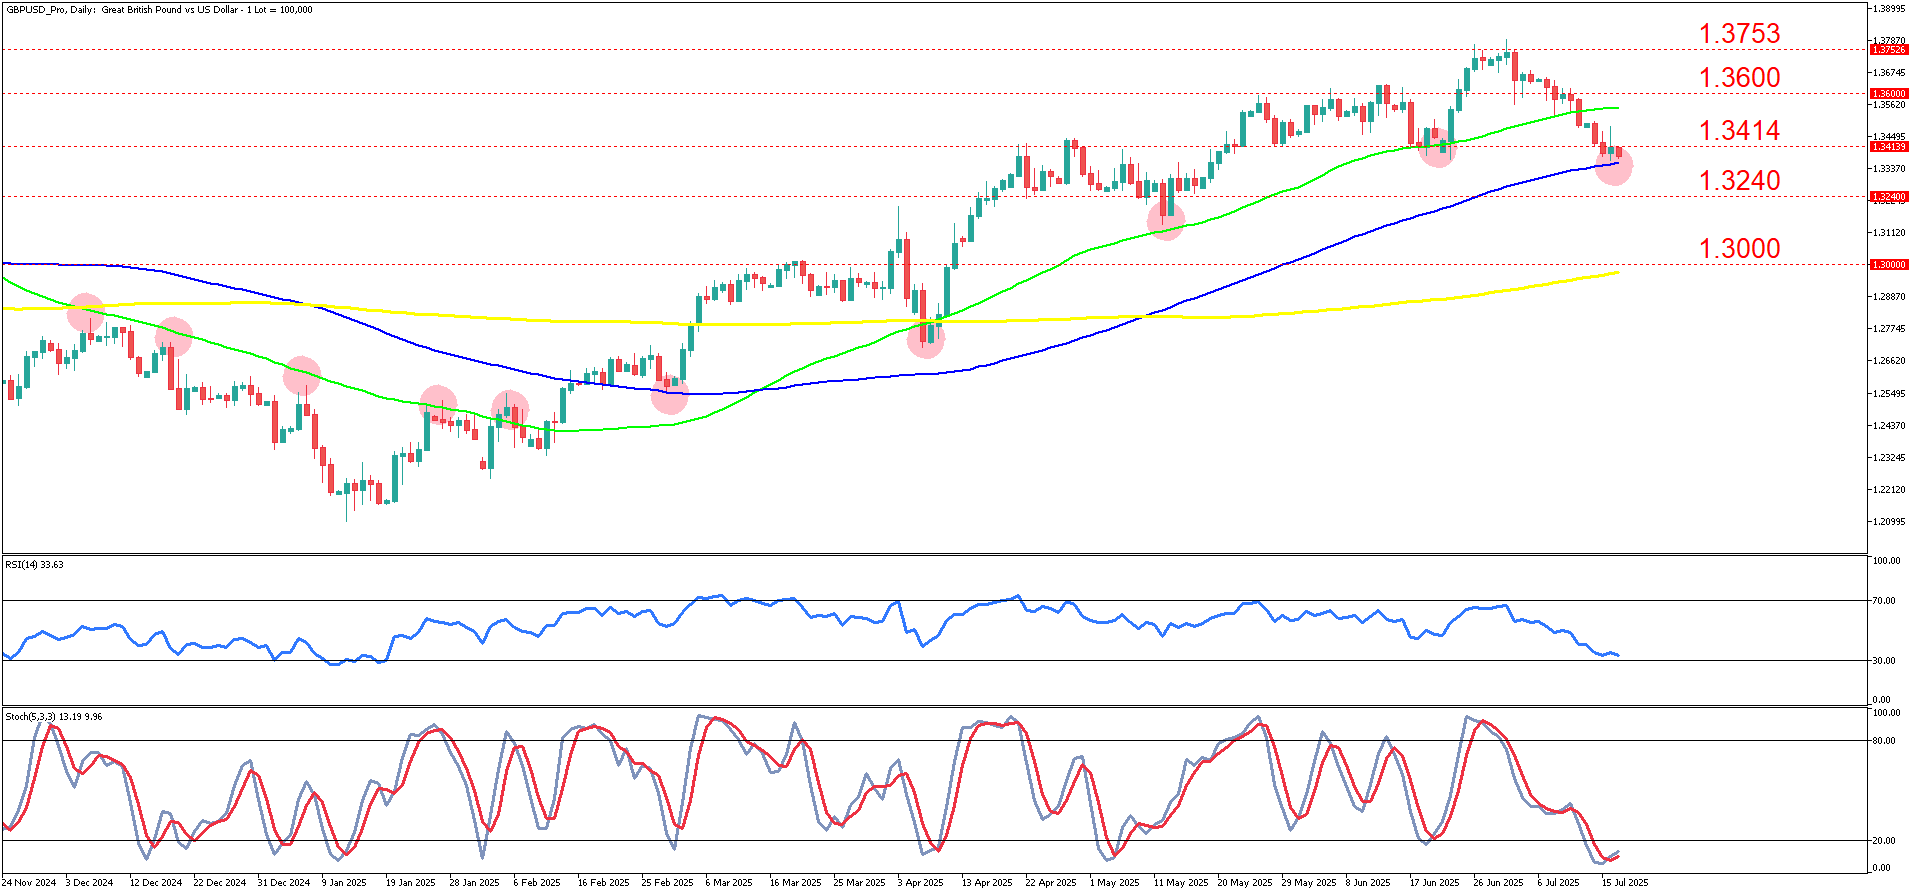
GBPUSD on a daily timeframe
The past technical action shows a strong recovery from the lows around late December 2024, following a prolonged downtrend that respected resistance near the 50-day moving average (green) and 100-day moving average (blue) as depicted by the red circles. After several failed attempts to breach these averages on the way down, the pair eventually built a base around late January to February 2025 and launched into an uptrend, breaking above those same moving averages which then flipped into dynamic support. These repeated bounces off the moving averages are clearly highlighted by the red circles, suggesting that traders have been consistently respecting these technical levels for several months.
Recent price action shows a retracement from the highs around 1.3753, with price now hovering just above the 100-day moving average (blue) near 1.3240. After a steady series of higher highs and higher lows, GBPUSD has seen increased selling pressure in July 2025, with the last few sessions testing the confluence of the blue 100-day moving average and horizontal support at 1.3240. Price has printed several bearish daily candles, but has not yet broken decisively below this zone.
Indicators confirm a weakened momentum profile. RSI is currently at 33.63, indicating the pair is approaching oversold territory but not yet extremely stretched. The stochastic oscillator, however, is already in deeply oversold territory (below 20) with %K and %D lines around 13 and 9 respectively, hinting at potential exhaustion of the current selloff. Support levels are clearly marked at 1.3240 and 1.3000, with resistance zones at 1.3414, 1.3600, and 1.3753. Divergences are not strongly visible, but the repeated moving average bounces in the past suggest that price is likely to respect these averages again unless a major fundamental catalyst breaks the pattern.
The main scenario projects that GBPUSD may find a technical floor around 1.3240 where the 100-day moving average is situated. Should buyers step in at this confluence support, a rebound toward the first resistance at 1.3414 is plausible, followed by a possible retest of 1.3600 if momentum returns. The oversold stochastic supports this potential bounce scenario in the short term, with medium-term buyers likely defending this zone aggressively.
The alternative scenario would unfold if price breaks and closes decisively below 1.3240, invalidating the moving average support. In this case, selling pressure could accelerate toward the next horizontal support at 1.3000, which also aligns with the daily support level from earlier in the year. A breach of this level could open a deeper correction, potentially targeting the 1.2800 area or lower, though confirmation would require sustained bearish momentum and a continued divergence between price and moving averages.
In terms of fundamentals, GBPUSD has been influenced by weaker UK GDP growth data and ongoing speculation regarding the Bank of England’s policy stance, with markets leaning toward a more dovish outlook amid softening inflation prints. On the US side, stronger-than-expected retail sales and hawkish comments from several Federal Reserve officials have supported the dollar.
SUMMARY:
- GBPUSD bounced off key moving averages after a sharp late-2024 downtrend.
- July selling pressure pushes price to critical support at 1.3240, testing the 100-day MA.
- Oversold RSI and stochastic suggest the selloff may be near exhaustion.
- A break below 1.3240 risks a drop to 1.3000; a bounce could target 1.3414 and 1.3600.