


The US Dollar Index slightly declined during this morning’s Asian session but has maintained a price above 104.40. Additionally, the price remains above this week’s earlier pricing, but investors are eager to see if the currency can establish itself above 104.50 or if the resistance level will hold strong. The Fed’s latest Meeting Minutes report also affects the US Dollar price and other instruments.
Federal Meeting Minutes Report
The Meeting Minutes Report from February gave some further insight into what the monetary policy may look like in 2023. However, it should be noted that the insight is from 3-weeks ago, before the latest figures were released, such as the Consumer Price Index and Producer Price Index. The latest employment figures, inflation data, and Purchasing Managers’ Indices all point to a more hawkish Federal Reserve.
Though the Meeting Minutes gave mixed signals, economists may interpret the report differently. Nearly all committee members voted for a 25-basis-point-rate-hike, with only a “few” members opting for a 50-basis-point-hike. None of the members voted to stop hiking interest rates. Additionally, the group of bankers stuck to their stance on inflation, which remains too high, and that more hikes are to come. Here, the Fed remained generally hawkish before the latest economic data and even more hawkish.
So what does this mean for tradable assets? A more hawkish Fed is known to pressure the stock market, Gold and to support the US dollar price. So far this week, the SNP500 has declined by 1.80%, and the US Dollar index has increased by 0.25 points.
SNP500 — Fed Minutes Show Hawkish Stance Before this Month’s Economic Data
Yesterday's market analysis also spoke about SNP500's bearish movement and the possibility of a further decline. The price movement throughout the 3 trading sessions was trendless but again mainly experiencing more substantial downward pressure. Towards the end of the US Trading Session, the price had declined by 0.60% to a new monthly low. However, the price slightly increased in the last 2-hours before the market closed.
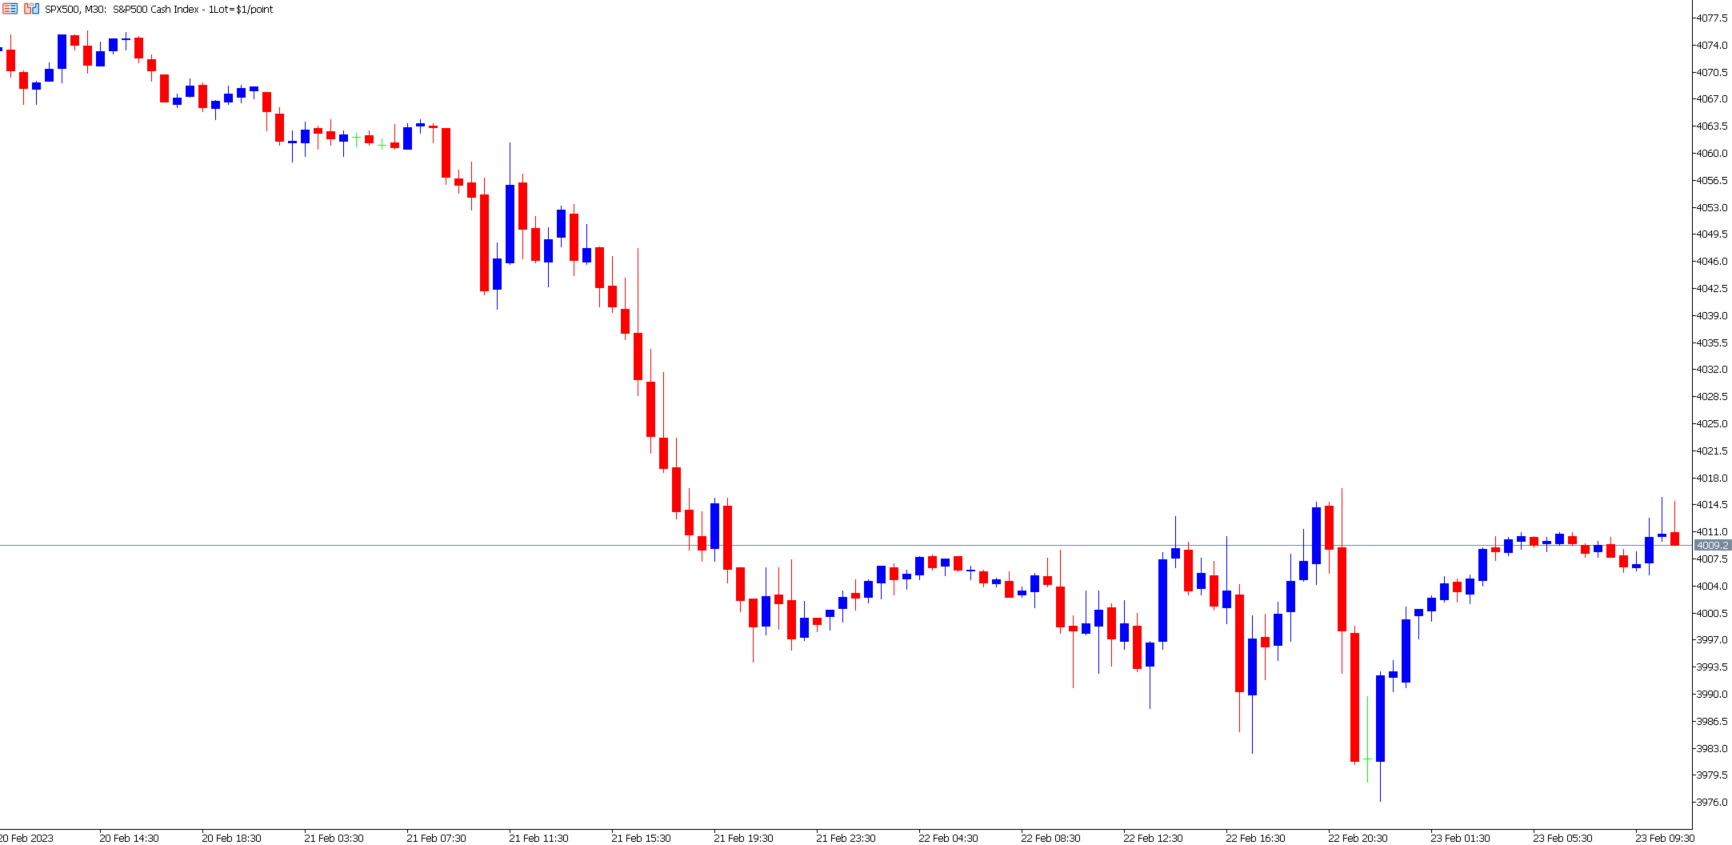
When looking at technical analysis, we see a divergence pattern forming on most oscillators but more on the RSI. A divergence pattern indicates a loss of momentum and a possible change in trend. Traders can also see the loss of momentum when looking at price action. The price saw a reverse symmetrical triangle pattern indicating possible movement in both directions.
However, the price remains under pressure from a stronger reaction from the Federal Reserve. Traders will monitor if the higher interest rates will have the desired effect and also for concrete indications of how high rates may go. For example, the Federal Fund Rate will reach 5.25% or 6% before hikes stop. The higher the rate, the more pressure on the stock market.
DAX — Technical Analysis Video
The DAX also came under pressure from lower investor sentiment within the global stock market. The German DAX is under similar pressure from interest rate hikes and weaker-than-expected economic data. Nonetheless, the asset is experiencing a change in momentum when looking at price action. This morning's price formed a bullish price gap and climbed by 0.64% compared to yesterday’s closing price.
Look at our latest technical analysis video on the DAX’s price movement.
Crude Oil — Chinese imports from Russia hit 3-Year High
Stocks are not the only market under pressure from a more expensive US Dollar but also rate hikes. Crude Oil has also declined in price over the past 2-days. The price of Crude Oil throughout yesterday’s trading session declined by 3% and dropped to its lowest price since February 6th.
Over the last 3-months has formed a “traditional price” zone between $72 and $82. Buyers seem unwilling to purchase above $82 and take advantage of the discounted price of $72. As a result, the price has seen a reverting market between these two prices. This morning the price has increased by 0.80% but is still not to obtain solid indications of future bullish movement.
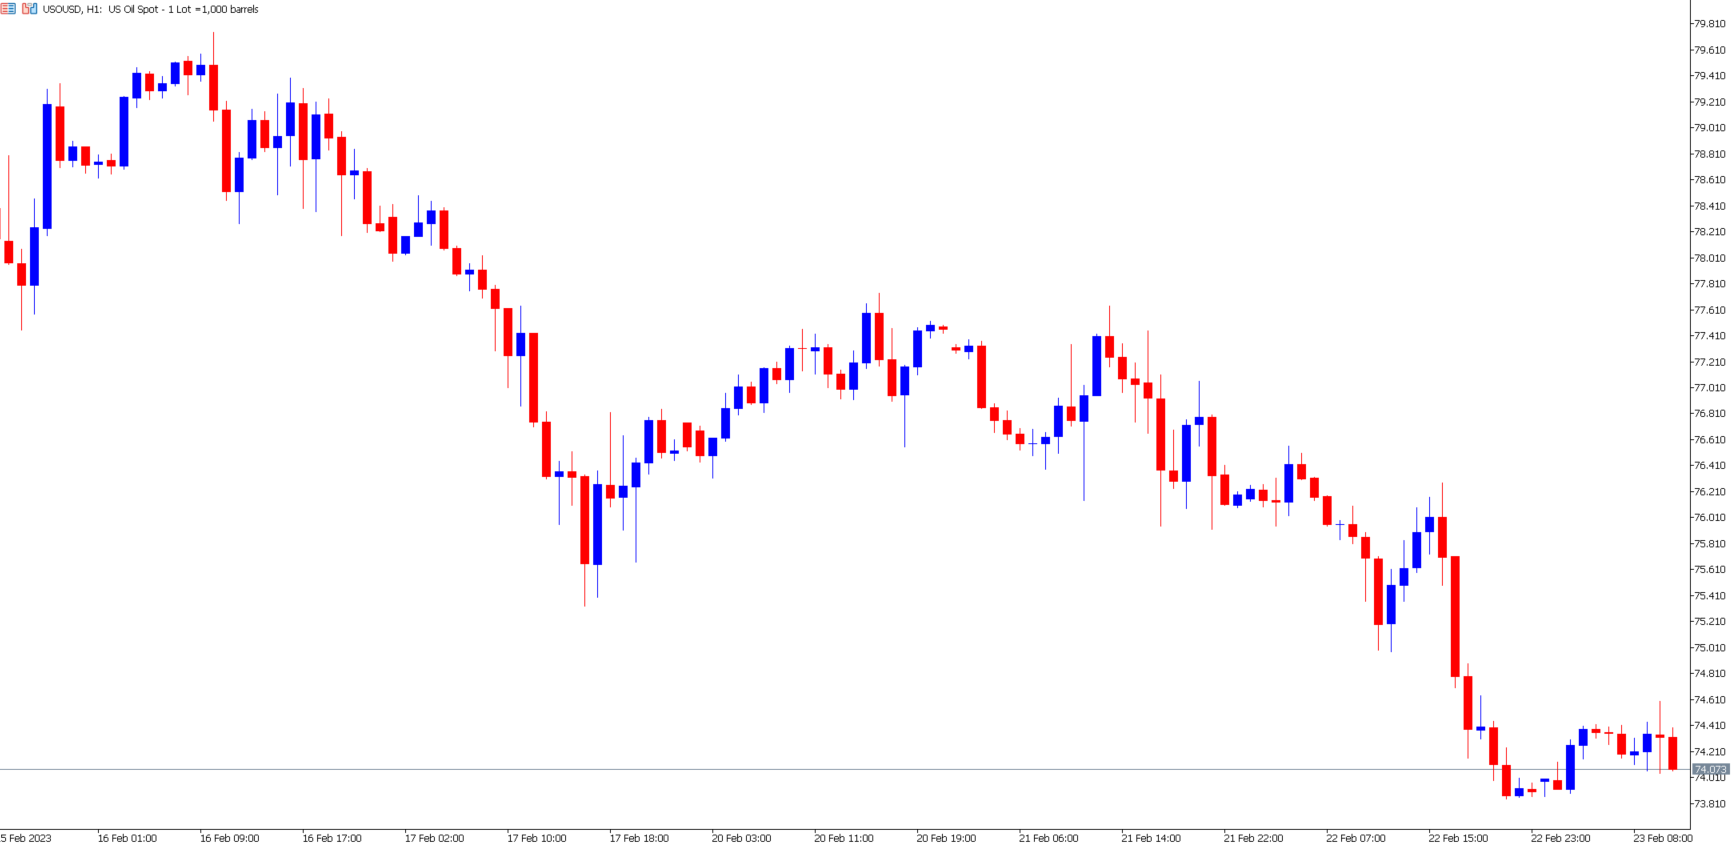
When looking at price drivers, fundamental elements also point to a potentially lower Crude Oil price. Global banks' more restrictive hawkish policy will likely limit economic growth and even cause a small recession. Additionally, the supply from Russia has not declined as previously expected. According to reports, China’s imports from Russia are close to reaching a 3-year high. Higher supply again is known to pressure Oil prices.
Nonetheless, no indications have been obtained pointing to a price outside the recurring price range from the past 3-months. Investors this afternoon will also be monitoring the Crude Oil inventories, which can create some volatility.
Summary:
- Nearly all committee members chose a 25 basis point hike but also agreed with further interest rate hikes.
- Yesterday, the SNP500 did not see a clear trend, but a stronger bearish moment was witnessed.
- The DAX outperforms its US competitors but also experiences similar declines. However, the price strongly jumped during this morning’s session.
- Crude Oil is under pressure from more hawkish monetary policies and due to high Russian Oil supply.


