The EUR/USD opened 2026 as the consensus long trade on Wall Street, with Goldman Sachs, Deutsche Bank, and MUFG all targeting 1.24–1.25 by year-end. Then the Strait of Hormuz conflict pushed US and eurozone inflation sharply higher, the ECB hiked on June 11 for the first time since 2023, and the Fed signalled hikes — not cuts — at its June 17 meeting.
The Euro to US Dollar rate has pulled back from its 2026 high of 1.20 to the critical support level 1.14, with both central banks now leaning hawkish and neither providing the clear rate-divergence signal that typically drives a trend move. The pair is, as one currency analyst put it, "stuck in the middle" rather than poised for a break in either direction. Here is the full updated EUR/USD forecast for the rest of 2026 and beyond.
EUR/USD Forecast 2026 — Key Notes
- Euro to US Dollar price prediction H2 2026: From current levels – weakest since mid-March, the path forward hinges on a single question: do the two central banks diverge in H2 2026, or do they move in parallel?
- BASE CASE (~50%) — 1.13 – 1.21: EUR/USD remains range-bound as both central banks hold or move in small increments. The pair oscillates between 1.13 and 1.21, consistent with Cambridge Currencies' and broader analyst median projections, with no sustained trend in either direction absent a clear inflation surprise in either jurisdiction.
- BULL CASE (~25%) — 1.21 – 1.26: US inflation cools faster than expected through summer, taking the projected Fed hike off the table while the ECB delivers a second 25bp hike in July or September. The resulting renewed rate-divergence — ECB tightening, Fed on hold — is the scenario that sends EUR/USD back toward 1.22–1.25, consistent with Goldman, Deutsche Bank, and JPMorgan's base cases.
- BEAR CASE (~25%) — 1.08 – 1.13: The Iran ceasefire fully collapses, oil re-spikes, and the Fed delivers one or two actual rate hikes before year-end that the ECB cannot match given the eurozone's fragile 0.8% GDP growth. EUR/USD breaks below the critical 1.1400 support (the 23.6% Fibonacci retracement of the 2022–2026 rally) and extends toward 1.10 or lower as the dollar re-establishes a yield advantage above 150bp.
Note: These are illustrative scenarios only, not price targets or investment recommendations. Actual outcomes may differ materially.
- EUR/USD Forecast 2027: The 2027 outlook is wide-ranging because the pair sits at a technical turning point, with a bullish path pointing toward 1.25–1.30+ if support holds and the Fed starts cutting. A bearish break could send it toward 1.06–1.09 before any recovery attempt, while the broader bias still leans slightly toward euro strength.
- EUR/USD 5-Year Forecast (2027–2030+): Long-term EUR/USD forecasts are best viewed as a structural framework rather than a precise target, with the main bullish drivers being US fiscal deficits, reserve diversification, and narrowing US-eurozone growth gaps. The common forecast range remains very wide — roughly 1.08 to 1.40+ by 2030 — which reflects high uncertainty about both the timing and size of any euro gains.
- Trade EUR/USD with NAGA: Speculate on EUR/USD price movements through CFDs — long or short, with tight spreads.
EUR/USD Fundamental Analysis 2026
The ECB raised its deposit rate 25bp to 2.25% on June 11 — its first hike since 2023 — while the Fed held at 3.50–3.75% on June 17 but signalled a likely 2026 hike, with nine of eighteen members now projecting tightening. When both central banks lean hawkish, the rate-divergence trade that typically moves EUR/USD goes quiet.
The Central Bank Pivot — ECB Hikes, Fed Signals Hikes
European Central Bank
2.25%
Hiked +25bp on June 11, 2026 — first hike since 2023
Eurozone inflation hit 3.2% in May (core 2.5%), driven by Strait of Hormuz energy costs. The ECB simultaneously cut its 2026 GDP forecast to ~0.8% and raised inflation projections. Markets price less than 30bp of further 2026 tightening, but policymaker Šimkus has flagged a potential July or September follow-up hike. Next decision: July 23, 2026.Federal Reserve
3.50–3.75%
Held June 17 — dot plot flipped from cut to hike
US inflation at 4.2% YoY in May (the highest since April 2023) has removed room to cut. Nine of eighteen FOMC members now project a 2026 hike; the median dot-plot year-end target jumped to 3.8% from 3.4% in March. Chair Warsh declined to submit his own projection and announced five internal task forces. Next decision: July 29, 2026.
The rate differential between the Fed and ECB peaked at roughly 3.25 percentage points in 2023 when the Fed had hiked aggressively while the ECB lagged. That gap has since narrowed dramatically — from 3.25% to 1.50% today — as the ECB hiked to 4.0% in 2023–24, then both banks cut through 2024–25, before the Fed stopped cutting first (holding at 3.75% since late 2025 while the ECB continued to 2.0%). The ECB's June 2026 hike to 2.25% narrows the gap further to 1.50%.
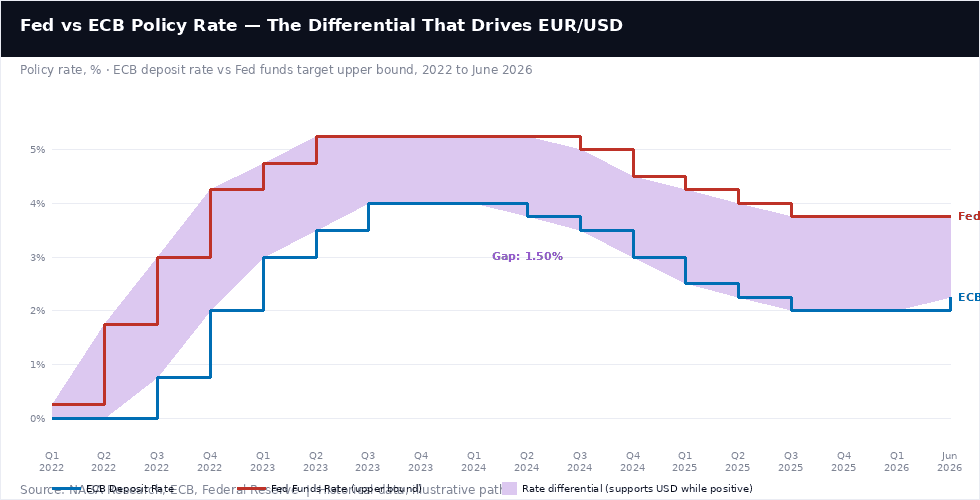
The core bull case for EUR/USD — that the remaining 1.50% gap compresses further as the Fed eventually cuts while the ECB holds or hikes — remains structurally intact, but the timeline has been pushed back by the dual-hawkish-pivot of June 2026. Goldman Sachs estimates that each 50bp of differential compression adds approximately 300–400 pips to EUR/USD; the remaining 1.50% gap, if it closes to neutral, implies roughly 900–1,200 pips of potential upside — the mathematical case for the 1.22–1.25 targets.
Inflation — The Common Enemy Driving Both Banks
The Strait of Hormuz conflict has been the single most disruptive macro event of 2026 for currency markets. Every $10 sustained increase in oil prices adds approximately 0.5 percentage points to eurozone HICP inflation, according to the ECB's own modelling; with oil up more than $40 since the conflict began in late February, that implies roughly 2 full percentage points of additional inflation pressure. In the US, energy prices drove May CPI to 4.2% YoY — the highest since April 2023 — despite core CPI of 2.9% showing the underlying picture is less alarming. In the eurozone, the equivalent reading was 3.2% (core 2.5% from 2.2% in April).
Both readings are materially above target, but the euro's inflation is closer to its source (proximity to Middle East energy supply chains, higher energy import dependence), while the US reading is more mixed, with shelter and services costs contributing alongside energy. This distinction matters for the rate path: the ECB can argue its hike is specifically targeted at imported energy inflation and may pause quickly if oil reverses; the Fed's higher CPI has more domestic structural components that are harder to control with a single pause.
Growth Divergence — Eurozone's Hidden Risk
Eurozone GDP contracted in Q1 2026, and the ECB's updated 2026 growth forecast of ~0.8% reflects genuine fragility. This creates an uncomfortable constraint for the ECB: hiking aggressively into a near-recessionary economy risks doing significant damage, which is why markets are pricing only 30bp of additional 2026 ECB tightening even after the June hike.
Germany's €1 trillion infrastructure and defence spending program provides a structural medium-term tailwind — and was a cornerstone of the original Goldman/Deutsche Bank 1.25 target theses — but its multiplier effects take 12–18 months to feed through meaningfully into GDP data. The US economy is stronger in absolute terms, but the Fed's own 2026 GDP projections have been revised lower amid tariff headwinds and higher-for-longer borrowing costs. In a "both economies slow together" scenario, EUR/USD tends to grind sideways rather than trend.
Geopolitics — The Iran Ceasefire as Wild Card
The US-Iran ceasefire remains the most binary swing factor for EUR/USD. A durable ceasefire and Strait of Hormuz reopening would ease oil prices sharply — reducing inflation in both jurisdictions, relieving pressure on both central banks, and potentially reviving the "both banks pivot dovish" narrative that had supported EUR/USD's earlier 2026 rally toward 1.20. However, planned Swiss peace talks were cancelled abruptly on June 19, and President Trump has warned of renewed military action if the agreement's terms are violated. Markets have scaled back both ECB and Fed tightening expectations in recent days on ceasefire relief, only to partly reverse those bets on the same day when the talks fell through. This binary oil/inflation feedback loop through geopolitics is likely to remain the dominant near-term driver for EUR/USD, with every headline on the ceasefire capable of 50–100 pip swings.
EUR/USD Technical Analysis
The weekly EUR/USD chart reveals two dominant structures working simultaneously — and, critically, working against each other right now.
The Long-Term Ascending Channel (2022–2026)
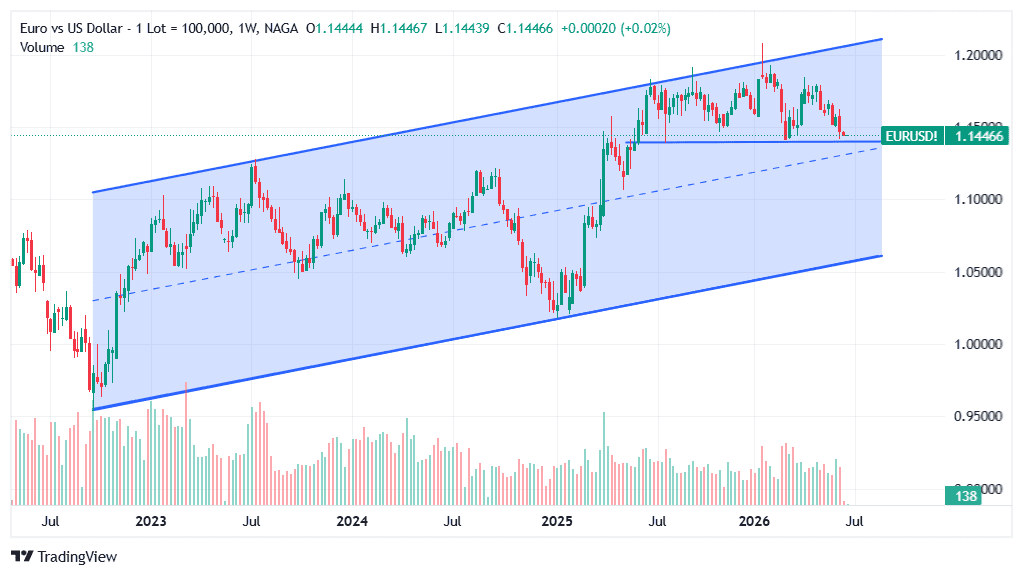
EUR/USD has been trading inside a well-defined ascending channel since the September 2022 parity-crisis low at 0.9536. The channel's lower boundary connects that 2022 low through the 2023 and 2024 higher lows (roughly 1.04 in late 2023, 1.06 in mid-2024), rising steadily toward approximately 1.08–1.09 today. The upper boundary connects the 2023 high near 1.12 through the 2025 high near 1.19 and the January 2026 peak at 1.2019 — all three of which essentially touched the same rising upper rail.
The channel midline (the dashed diagonal in the chart) has repeatedly served as a dynamic pivot, with the pair tending to find support or resistance along it during consolidation phases, as it did through most of 2024. EUR/USD currently sits between the midline and the lower boundary of this channel, in the lower third of the structure — which, within the channel framework, is a neutral-to-bullish position as long as the lower boundary holds.
Past performance is not a reliable indicator of future results. All historical data, including but not limited to returns, volatility, and other performance metrics, should not be construed as a guarantee of future performance.
The Triple Top — A Distribution Pattern at the Upper Rail
Overlaid on that longer-term bullish structure is a shorter-term bearish warning: a triple top distribution pattern forming near the channel's upper boundary. Three roughly equal highs have clustered between 1.18 and 1.2019 — the September 2025 spike, the January 28, 2026 peak (1.2019), and a second 2026 rally peak before the current selloff. Each successive high has failed to break convincingly above 1.20, and each has been followed by a deeper pullback.
This triple top is a distribution pattern: after repeated failed attempts to hold above a key level, buyers are exhausted, and the balance of supply and demand tips toward sellers. The neckline of this pattern sits near the 1.14–1.15 zone. A sustained weekly close below 1.1400 would be the clearest confirmation of a neckline break, with the measured-move target for a triple top of this size pointing toward 1.06–1.08 — which happens to coincide almost exactly with the ascending channel's lower boundary as it projects forward.
In other words, a confirmed triple top breakdown does not necessarily destroy the longer-term EUR/USD bull structure, but it would likely mean a visit to the channel floor before any resumption of the uptrend.
The counterargument for bulls is straightforward: the 1.14–1.15 zone has absorbed multiple tests already (the March 2026 tariff-shock low, the June 19 intraday low at 1.1435), and the ascending channel structure is intact. If this level holds on a weekly closing basis, the triple-top neckline becomes a failed breakdown — which would itself be a bullish signal. The resolution of this technical standoff, combined with the July 23 ECB decision and July 29 Fed meeting, makes the next four to six weeks decisive for EUR/USD's H2 trajectory.
Key Technical Levels
LEVEL RATE SIGNIFICANCE Channel Upper Rail / Triple Top 1.18 – 1.2019 Three failed attempts at the ascending channel's upper boundary (Sep 2025, Jan 2026, May 2026) — triple top distribution pattern; recovering above 1.20 on a weekly close would negate the pattern Bank Consensus Target Zone 1.22 – 1.25 Goldman, Deutsche Bank, MUFG, Scotiabank, JPMorgan, ING year-end targets — would require a decisive upper rail breakout above the triple top R1 Resistance 1.1635 – 1.1805 Broken-resistance-now-support on the April recovery rally; first meaningful overhead barrier before a channel midline retest Critical Support Area 1.1400 – 1.1476 March 2026 swing low (1.1476) and June 19 intraday low (1.1435) form a double-tested support zone; the make-or-break level for the bulls Channel Midline (Dynamic) ~1.10–1.11 (rising) The ascending channel's midline, which previously acted as pivot support/resistance through 2024; a measured-move breakdown target zone Channel Lower Boundary / Triple Top Target ~1.06–1.09 (rising) Rising trendline from the 2022 low; coincides with the textbook triple-top measured-move target — the ultimate bear-case floor within the channel structure Past performance is not a reliable indicator of future results. Technical levels are analytical reference points, not guaranteed price targets.
Learn more about technical analysis tools at NAGA Academy.
EUR/USD Forecast 2026 — Institution Predictions
Goldman Sachs (1.25), Deutsche Bank (1.25), MUFG (1.24), Scotiabank (1.24), JPMorgan (1.22), and ING (1.22) all maintain bullish year-end EUR/USD price targets — though these forecasts were set before the June central bank pivot and assume rate divergence materialises in H2.
INSTITUTION END-2026 TARGET BIAS KEY DRIVER / CAVEAT Goldman Sachs ~1.25 Most bullish major bank Structural USD weakness, fading US exceptionalism, reserve diversification away from dollar assets Deutsche Bank ~1.25 Very bullish German fiscal multiplier (€1 trillion programme), global growth rebound, geopolitical improvement assumed MUFG ~1.24 Bullish ("post-peak USD world") ~5% USD weakening; foreign inflows to European bonds/equities; ECB policy stability Scotiabank ~1.24 Bullish, but notes 1.20 as challenging Narrowing rate differentials, broadly constructive risk sentiment; rallies above 1.20 seen as harder to sustain JPMorgan ~1.22 Moderately bullish Relative real yields increasingly favour euro; cooling US labor data; original Dec 2026 target 1.20 later raised ING ~1.22 Bullish, fair value rising toward 1.20+ Gradual eurozone growth improvement, lower energy prices (pre-Iran conflict assumption), USD depreciation UBS ~1.20 Neutral-bullish (revised down from 1.23) French political uncertainty trimmed earlier 1.23 target; broadly supportive macro backdrop assumed Morgan Stanley ~1.20 Neutral; V-shape path Early-year strength (to 1.23 in spring), late-year pullback to 1.16–1.20 as US economy stabilises Cambridge Currencies 1.13–1.21 range Most conservative, range-bound view Both central banks now firm → range-bound with modest upward bias; pair "stuck mid-range" until divergence confirms
An important caveat applies to virtually all these EUR/USD forecasts: they were published during Q1 2026 — before the ECB's first-since-2023 rate hike, before the Fed's hawkish June pivot, and before the ceasefire talks collapsed. The structural bull case (narrowing rate differentials, German fiscal stimulus, fading dollar exceptionalism) remains intact in most of these frameworks, but the timeline has been pushed back.
The banks that assumed the ECB would hold at 2.0% while the Fed continued cutting are working with a fundamentally different input today — namely, both banks hiking simultaneously — and have not yet updated their published EUR/USD targets. The more conservative Cambridge Currencies range-bound view (1.13–1.21 for the rest of 2026) may better capture the near-term reality than the consensus 1.22–1.25 targets.
AI-Based EUR/USD Forecasts — What the Algorithms Say
Algorithmic and AI-driven forecasting models for EUR/USD show a notably tighter range than the bank consensus, largely because most were trained on historical patterns that favour mean-reversion toward the pair's long-run average — and are therefore structurally cautious about the more bullish 1.22–1.25 bank targets as well as the more bearish sub-1.10 scenarios.
MODEL 2026 RANGE / YEAR-END 2027 TARGET BIAS & NOTES CoinCodex $1.14 – $1.18 (avg $1.16) $1.03 – $1.26 (avg ~$1.16, then declining to $1.03 by Dec 2027) Neutral in 2026, bearish 2027 — momentum model; projects gradual decline through H2 2026 and most of 2027, inconsistent with bank consensus LongForecast $1.12 – $1.14 by year-end (declining from current) ~$1.12 H1, rising to ~$1.19+ by end-2027 Bearish near-term, bullish 2027 — projects further weakness through Oct–Dec 2026 (close ~$1.11–$1.12) before recovery; 2027 range $1.116–$1.261 TradersUnion (statistical) Range-bound, broadly current levels ~$1.13 avg by end-2027 Conservative consolidation — model projects ~$1.13 by end-2027, ~$1.23 by end-2028, then back to ~$1.08 by 2030; high multi-year variance WalletInvestor Bullish; up to $1.25 flagged Broadly constructive, aligns with bank bull case Bullish — the most optimistic AI model, broadly tracking the Goldman/Deutsche Bank thesis of structural dollar weakness
The pattern across AI models is consistent and instructive: where bank forecasters build a structural narrative (rate differentials, fiscal flows, reserve diversification) and project a destination, algorithmic models tend to extrapolate recent price action and revert toward the historical mean, producing more conservative and often contradictory near-term projections.
The most striking divergence is CoinCodex's projection of a decline toward $1.03 by December 2027 — a reading that directly contradicts every major bank's structural thesis — and illustrates the fundamental limitation of momentum-based models in genuinely macro-driven currency markets.
LongForecast's model is arguably more useful precisely because it shows the near-term bearish risk (further weakness to $1.11–$1.12 through late 2026 if the triple-top neckline breaks) before a structural recovery takes hold — a sequence that maps surprisingly well onto the technical picture outlined above.
AI and algorithmic forecasting models are based on historical data patterns and should not be used as the sole basis for trading decisions. Past performance and algorithmic projections are not reliable indicators of future results.
EUR/USD Price History — Key Moments
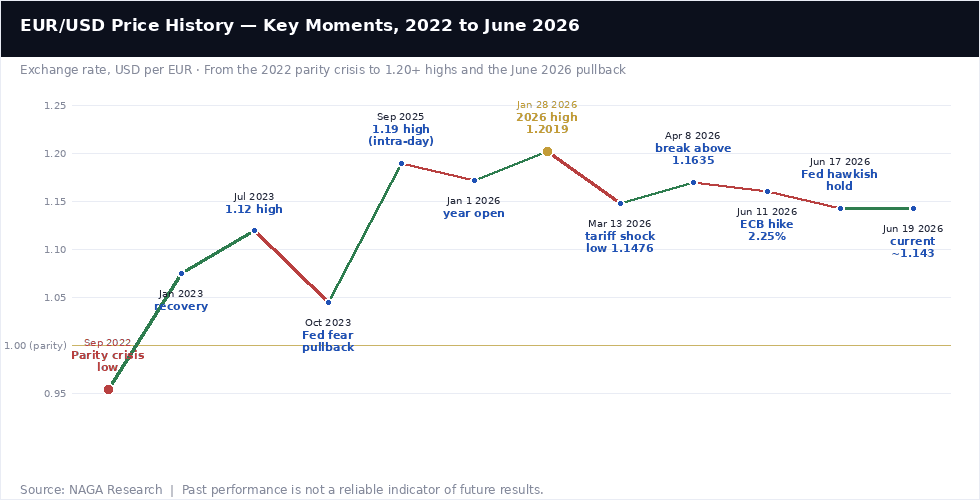
The EUR/USD pair has had one of the most volatile multi-year stretches in its history since 2022, starting from a crisis below parity and recovering more than 25 figures (2,500 pips) to its 2026 high, before the latest pullback.
September 2022: The Parity Crisis Low (0.9536)
EUR/USD reached its lowest point since 2002 in September 2022, touching 0.9536 as the Federal Reserve's aggressive rate-hiking campaign pushed the dollar to multi-decade highs against virtually every major currency. The eurozone faced a simultaneous energy crisis triggered by Russia's invasion of Ukraine, with natural gas prices spiking to historic highs and German industrial output contracting sharply. This combination — a hawkish Fed with a 300bp+ rate advantage and a eurozone facing a recessionary energy shock — drove the pair to a level few had thought possible even a year earlier.
2023–2024: Recovery as the Fed–ECB Gap Narrowed
EUR/USD recovered steadily through 2023 and 2024 as the ECB's own aggressive hiking cycle (which ultimately took rates to 4.0%) closed the gap with the Fed, and as European energy markets normalised after the initial Russia shock. The pair reached 1.12 intraday in mid-2023, pulled back sharply in autumn 2023 when Fed rate-cut hopes were dashed, and the dollar strengthened again, then resumed its recovery through 2024 as both central banks began their easing cycles.
2025: The Dollar's Biggest Annual Decline Since 2017
The US dollar fell 9.4% on a DXY basis in 2025 — its largest annual decline since the first year of Trump's first term — as the Fed cut three times (75bp total to 3.50–3.75%) while the ECB continued its easing path. EUR/USD rode this dollar weakness from 1.04 at the start of 2025 to 1.1756 at year-end, touching an intraday high of 1.1919 in September 2025. The pair entered 2026 at 1.1721 — its strongest year-open since 2021.
January 28, 2026: The 1.2019 High
EUR/USD crossed 1.20 for the first time since mid-2021 on January 28, 2026, touching an intraday high of 1.2019, driven by expectations that the Fed would continue cutting rates in 2026 while the ECB held. German fiscal expansion (the announced €1 trillion infrastructure and defence programme) and foreign capital returning to European equity and bond markets provided additional tailwinds. This level is the structural target that most bank forecasters remain focused on for H2 2026 — whether the pair can reclaim and hold above 1.20 will be a key test of whether the 2025–2026 dollar-weakness thesis remains intact.
March 2026: The Tariff Shock Low (1.1476)
The combination of the Strait of Hormuz conflict beginning in late February and fresh US tariff threats drove EUR/USD to a 2026 low near 1.1476 on March 13, in a risk-off episode that simultaneously strengthened the dollar as a safe-haven currency and weighed on the euro's growth-sensitive profile. The pair broke below the critical 1.16 support on April 8, which subsequently served as a pivot for the recovery before the pair turned down again.
June 2026: The Dual Central Bank Pivot
The ECB hiked 25bp to 2.25% on June 11 — a move that briefly supported the euro before being offset by the Fed's own hawkish signal on June 17, which sent the dollar to its strongest level since May 2025. EUR/USD has since drifted to around 1.143 — its lowest level since mid-March — as the abrupt cancellation of the US-Iran peace talks in Switzerland on June 19 added geopolitical uncertainty on top of the already complicated central bank picture. The pair ended the week of June 19 on a negative note, on track for roughly a 1% weekly decline.
It is worth keeping in mind that both analysts and online forecasting sites can and do get their predictions wrong. Keep in mind that past performance and forecasts are not reliable indicators of future returns. When considering EURUSD price predictions for 2026 and beyond, it’s important to keep in mind that high market volatility and the macroeconomic environment make it difficult to produce accurate long-term EURUSD analyses and estimates. As such, analysts and forecasters can get their EURUSD forecast wrong.
It is essential to do your research and always remember that your decision to trade depends on your attitude to risk, your expertise in the market, the spread of your investment portfolio, and how comfortable you feel about losing money. You should never invest money that you cannot afford to lose.
Sources:
- European Central Bank — Monetary Policy Decisions, June 11, 2026
- Federal Reserve — FOMC Press Release, June 17, 2026
- Trading Economics — EUR/USD Historical Data
- Cambridge Currencies — Euro Forecast 2026
- MUFG Research — 2026 Annual FX Outlook
- J.P. Morgan Global Research — 2026 Market Outlook
- FX Empire — EURUSD Forecast 2026
Other Resources:
- NASDAQ 100 forecast & price predictions 2026
- DAX 40 forecast & price predictions 2026
- Gold forecast & price predictions 2026
- Silver forecast & price predictions 2026
- Oil forecast & price predictions 2026
- Natural gas forecast & price predictions 2026
- Dow Jones forecast & price predictions 2026
- How to trade forex
- Technical analysis academy guide
- Fundamental analysis — what moves FX