Past performance is not indicative of future results. All historical data, including but not limited to returns, volatility, and other performance metrics, should not be construed as a guarantee of future performance.
XAUUSD on a 1-hour timeframe
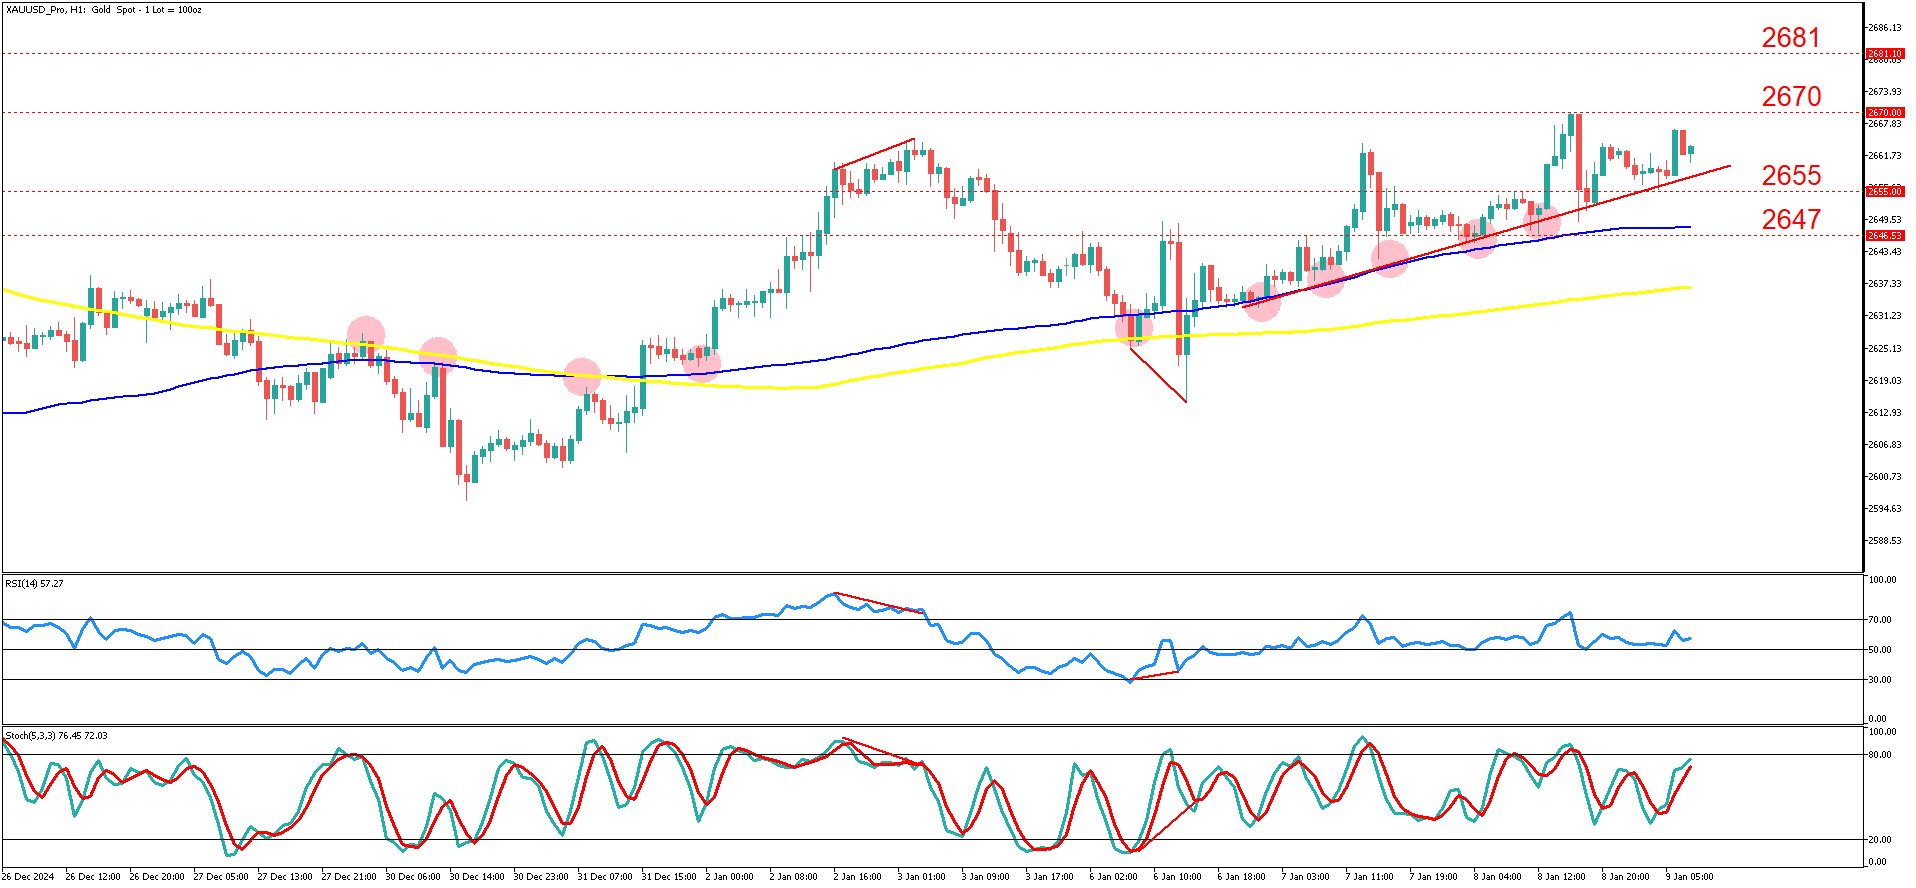
XAUUSD on a 1-hour timeframe has demonstrated a consistent upward trajectory since rebounding from a low of approximately 2598 in late December. The price has shown repeated interaction with the 100-period SMA (blue line), highlighted by red circles, where it found robust support, reinforcing its significance as a dynamic level in the current bullish context. This alignment suggests institutional interest around these levels and the continuation of a well-supported rally. The 200-period SMA (yellow line) remains further below, providing an additional long-term support framework.
Recent price action has been characterized by a series of higher highs and higher lows, aligning with a rising trendline. The price reached a high near 2670 before retracing slightly to the 2655-2647 range, where buyers have stepped in, maintaining the structure.
Momentum indicators, including the Stochastic oscillator, have reflected past divergence signals, as marked by red trendlines. These divergences, combined with price retracements, served as a precursor to recent reversals, which coincided with overbought conditions. Such divergences indicate that momentum was faltering at previous highs, providing traders with opportunities to capitalize on corrective moves.
The RSI (14) remains elevated around 57, reflecting a continuation of bullish momentum but with room for further upside. The Stochastic oscillator currently suggests overbought conditions but has not yet signaled a confirmed reversal, keeping bullish scenarios intact while cautioning against overextension. A break above the 2670 level could trigger additional buying interest, targeting the 2681 level. A failure to sustain above the rising trendline near 2655 could invite a pullback toward 2647 or the 100-period SMA.
The main scenario projects a continuation of the uptrend, with a potential test of the 2681 resistance and an eventual breakout toward new highs, assuming sustained momentum and buying interest. However, the alternative scenario considers a break below 2655 and the 100-period SMA, leading to a potential correction toward 2647 and even 2630. This would realign the focus toward the 200-period SMA as the next significant support.
Traders should remain cautious as market sentiment could shift rapidly based on upcoming economic data. The U.S. Non-Farm Payrolls report and the Unemployment Rate are pivotal, with stronger-than-expected results potentially weighing on gold as expectations for higher interest rates strengthen the U.S. dollar. Conversely, weaker employment figures could bolster gold prices as a safe-haven asset amid concerns over slowing economic growth. Additionally, the Michigan Consumer Sentiment preliminary reading may offer insights into consumer confidence and inflation expectations, both of which are critical drivers of gold's appeal as an inflation hedge. These events are likely to induce significant volatility in gold prices, reinforcing the importance of risk management.
Summary:
- XAUUSD has shown a consistent bullish trend since late December, rebounding from around 2598.
- The 100-period SMA has provided strong support, indicating institutional interest.
- Stochastic oscillator and RSI suggest continued bullish momentum, though caution is needed near overbought levels.
- A break above 2670 targets 2681, while a failure to sustain above 2655 may lead to a pullback toward 2647 or the 100-period SMA.
- U.S. Non-Farm Payrolls and Unemployment Rate reports could significantly impact gold prices and induce volatility.