


NASDAQ 100 on a 4-hour timeframe
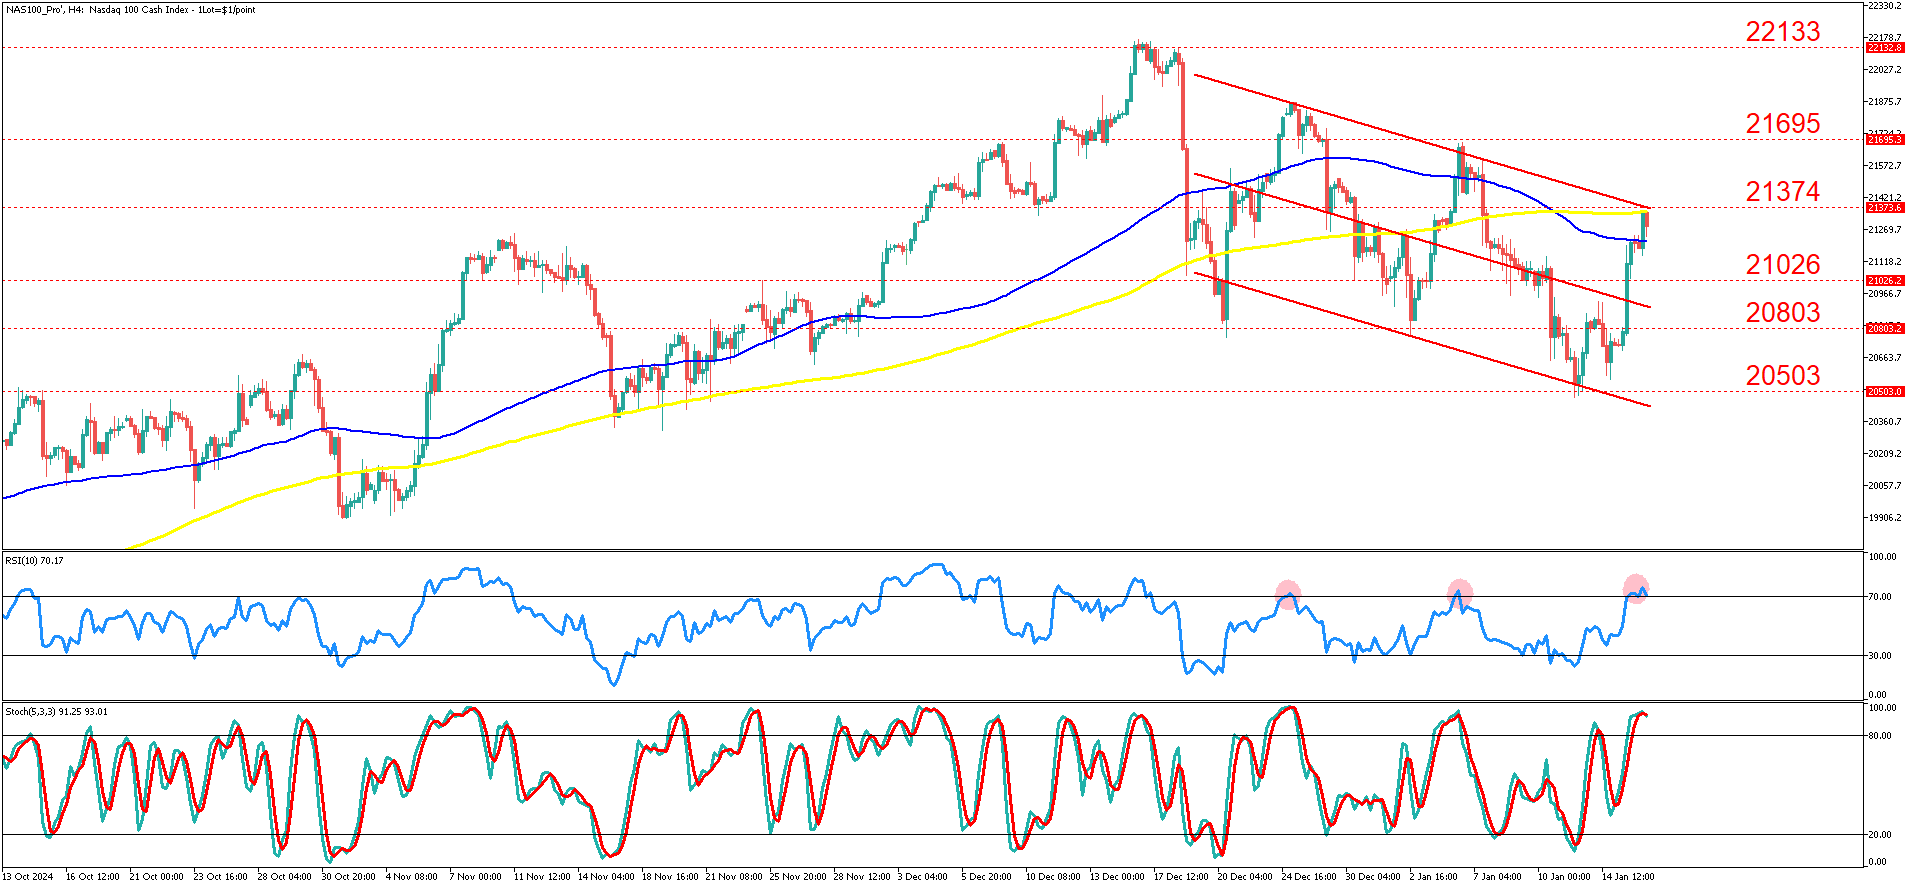
NASDAQ 100 on a 4-hour timeframe. The index recently experienced significant price action, with the broader trend defined by a descending channel pattern, marked by lower highs and lower lows since mid-November 2024. The chart displays clear resistance and support levels at 21,374 and 20,503, respectively, with multiple price rejections confirming these levels. Moving averages show a generally bearish alignment over the past two months, with the 50-period EMA (blue line) trending below the 200-period EMA (yellow line), reinforcing the medium-term downtrend.
The index has shown bullish momentum in recent sessions, with price rebounding from the 20,503 support level and rallying to test the upper boundary of the descending regression channel near 21,374. This marks the third instance in recent months where the RSI entered overbought territory as price action approached the top of the channel. The two prior instances led to sharp mean-reverting moves, with price retreating to the lower or mid-channel regions. Given this historical pattern and the current overbought signals, the primary scenario anticipates a pullback from these levels. Initial targets for the retracement include the 50-period EMA near 21,026, with a deeper move likely testing 20,803 or even 20,503 if bearish momentum intensifies.
Alternatively, if the index successfully breaks out above the 21,374 resistance level and sustains above the descending channel, it could signal a potential trend reversal. In this case, the next key resistance levels are 21,695 and 22,133. This bullish scenario would require strong follow-through momentum and supportive external catalysts, such as favorable economic data or robust earnings results, to maintain upward pressure.
Technical indicators further support the primary scenario, as the RSI remains in overbought territory near 70, and the stochastic oscillator confirms overextension. Both indicators suggest that upside potential may be limited, and the risk of mean-reverting price action is elevated.
Fundamentally, recent positive developments, such as softer-than-expected inflation data and strong bank earnings, have driven the recent rally. However, the upcoming release of economic indicators, including retail sales data, and Federal Reserve commentary could act as market-moving events. Additionally, the performance of AI-related stocks and geopolitical uncertainties remain critical influences on the NASDAQ 100’s trajectory. These factors could amplify volatility, particularly if they counteract the technical bias toward a correction.
Summary:
- NASDAQ 100 remains in a descending channel with resistance at 21,374 and support at 20,503.
- The 50-period EMA below the 200-period EMA confirms a bearish trend.
- Recent rebound to 21,374 faces overbought RSI, likely prompting a pullback to 21,026 or lower.
- A breakout above 21,374 targets 21,695, but strong catalysts are needed.
- Economic data and external factors could drive volatility.


