


The week begins with the US Dollar declining in value against all currencies other than a few exotic currencies. The US Dollar Index declines to 104.07, measuring a 0.13% decline. The deal struck over the weekend to raise the US debt ceiling to avoid a default continues to be the main news. The deal will now go to Congress and, if approved, to the US President for sign-off. However, investors should note that Friday’s PCE Price Index recently supported the price of the Dollar. In addition, the Dollar's most important price action is known to be 2–3 hours before the opening of the US Trading Session. Therefore, traders should still be monitoring any potential gains.
Is a Fed Hike Imminent?
On Friday, the Bureau of Economic Analysis made public the PCE Price Index for the previous month. Markets expected the index to read 0.3% rather than the released 0.4%, which was also the highest since February. Therefore, investors saw higher economic growth, lower unemployment claims, and higher-than-expected inflation the previous week. All three events can push the Federal Reserve towards a 0.25% rate hike. According to Bloomberg, 30% of economists believe the Fed will hike in June. The Federal Reserve will release its interest rate decision on June 14th.
After the inflation data release, the US Dollar rose to its highest since March 20th. However, investors should note that the price is now forming a retracement against the Dollar. For this reason, traders should closely monitor the price action. Even though the Dollar has been declining this morning and late Friday, the price of Gold continues to struggle. Gold’s value has come under pressure from more certainty due to the fruitful negotiations on the US debt ceiling and expectations of another 0.25% rate hike. According to the latest US Commodity Futures Trading Commission, the number of positions in gold has significantly decreased over the past week. In addition, the report confirms that the number of sell contracts continues to outnumber the parts of bulls.
NASDAQ - US Economy Shows its Resilience
All three US indices' prices have opened on a bullish price gap this week. However, only the NASDAQ has been able to hold onto the gains. Both the SNP500 and Dow Jones formed a retracement after the opening. Investors are contemplating whether this indicates that the NASDAQ may be mispriced or simply shows the strength of the market’s bulls. The main surprise for investors after NVIDIA’s shock earnings beat is Friday’s bullish trend, regardless of higher inflation. Usually, higher inflation figures tend to point towards a bearish price movement.
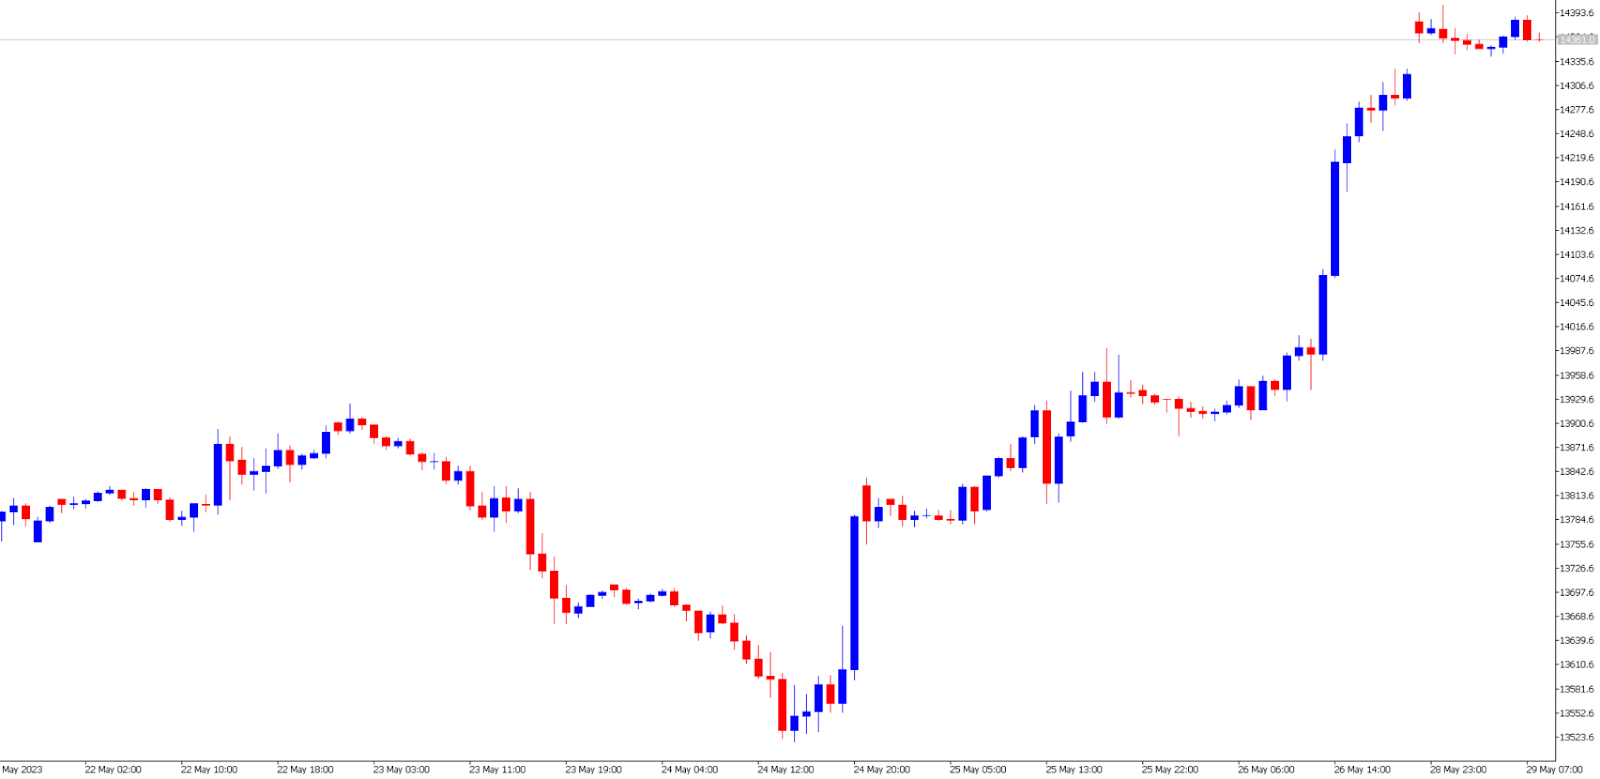
Nonetheless, the index is being influenced by many positive factors. This includes higher economic growth, a resilient employment sector and an extremely strong earnings season. Technical analysis also supports the asset as the index maintains a bullish trend pattern in 2023 without forming any longer-term lower lows. The best-performing stocks within the NASDAQ have been NVIDIA, AMD and Cadence, which have all increased more than 10%. The first performing in the previous week was Dollar Tree Inc, which saw an 11% decline.
This week's most important economic events will be the employment data scheduled to be released on Wednesday, Thursday, and Friday. Investors expect the JOLTS Job Openings figure to decline for a fourth month but remain relatively high. For the event to cause significant pressure on the NASDAQ, the data will need to read less than 9 million. On Friday, the Non-Farm Payroll figure is expected to read 190,000 and the unemployment rate to read 3.5%. This morning, European Indices are in the green, indicating a slightly positive investor sentiment.
GBP/USD
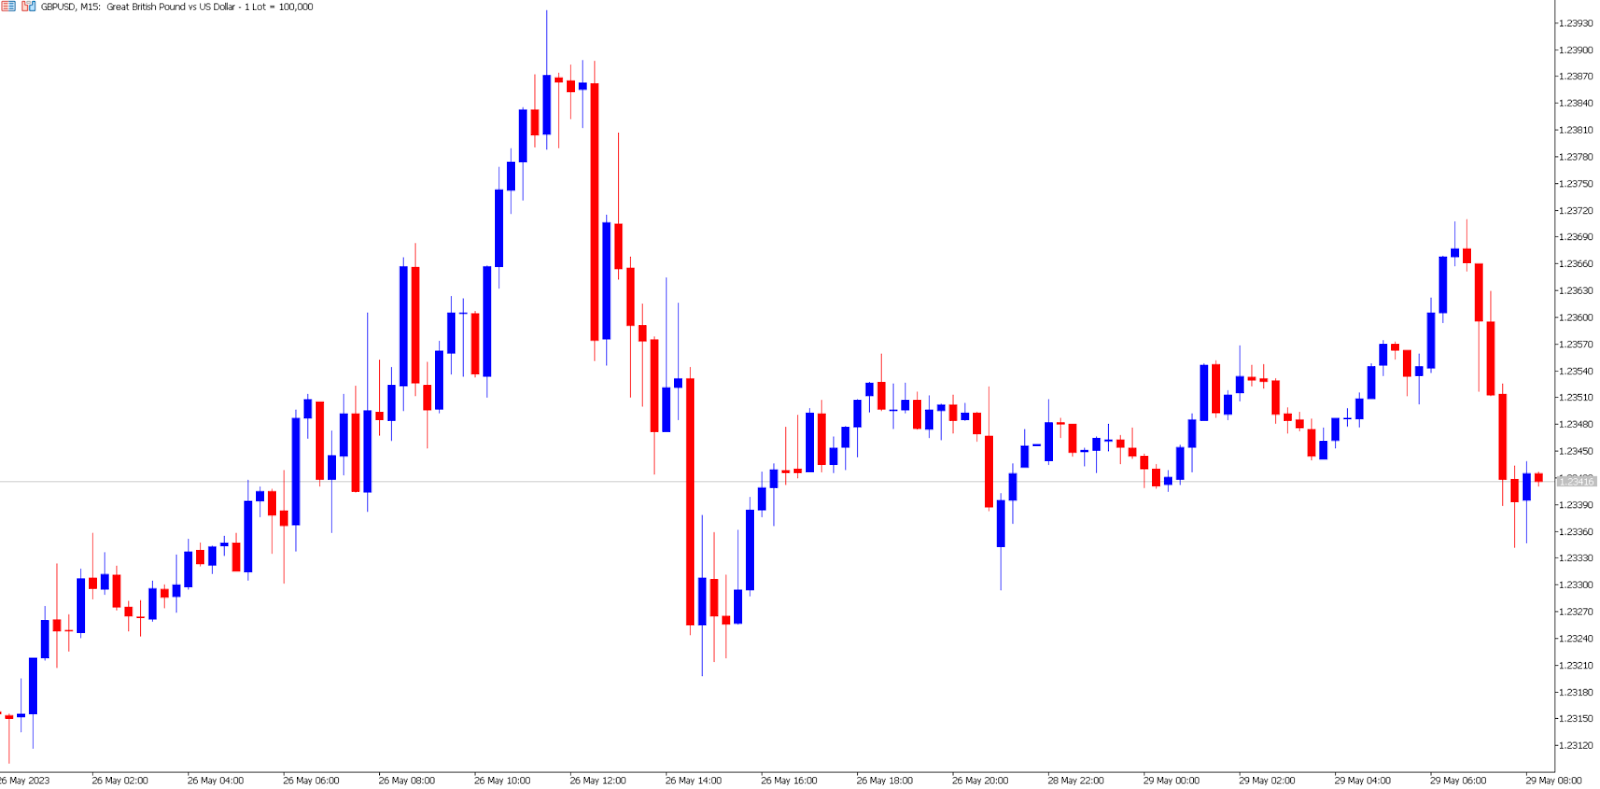
The GBP/USD exchange rate experiences mixed price movement during this morning’s Asian session. The day they started with the Pound increasing in value, followed by strange gains in favour of the Dollar. The Pound’s decline can be seen across all pairs, confirming the decline is related to the Pound and not only the Dollar. On the larger timeframes, the exchange price continues to trade within a downward pattern. However, on smaller timeframes, the price has formed a symmetrical triangle. Symmetrical triangles indicate that the price can swing in either direction as buyers and sellers open similar volumes. If the price can decline below 1.2319, the indicator may ignite further sell signals.
Even though the exchange rate has been in a bearish trend, the Pound has sometimes shown intense bullish price action. This is mainly due to the UK releasing higher-than-expected inflation data and a more hawkish central bank in comparison to the US. This morning, The Prime Minister advised markets that the government aims to bring inflation down to 5% by January 2024. In addition to this, the government has scheduled meetings with UK supermarkets for the companies to fix prices of essential items voluntarily.
Summary:
- The Pound experiences bearish and bullish price movement but eventually gives way to a decline. The UK government is set to meet with UK supermarkets for the companies to fix prices of essential items voluntarily.
- The US Dollar continues to follow a bullish price trend pattern. However, investors should note that Friday’s PCE Price Index recently supported the price of the Dollar.
- Investors saw higher economic growth, lower unemployment claims, and higher-than-expected inflation the previous week. 30% of economists believe the Fed will hike 0.25%.
- The NASDAQ opens on a price gap and sees solid bullish price movement on Friday, regardless of higher inflation data. This morning, European Indices are in the green, indicating a slightly positive investor sentiment.


