Past performance is not indicative of future results. All historical data, including but not limited to returns, volatility, and other performance metrics, should not be construed as a guarantee of future performance.
XAGUSD 30-Min Timeframe, 25 April 2024
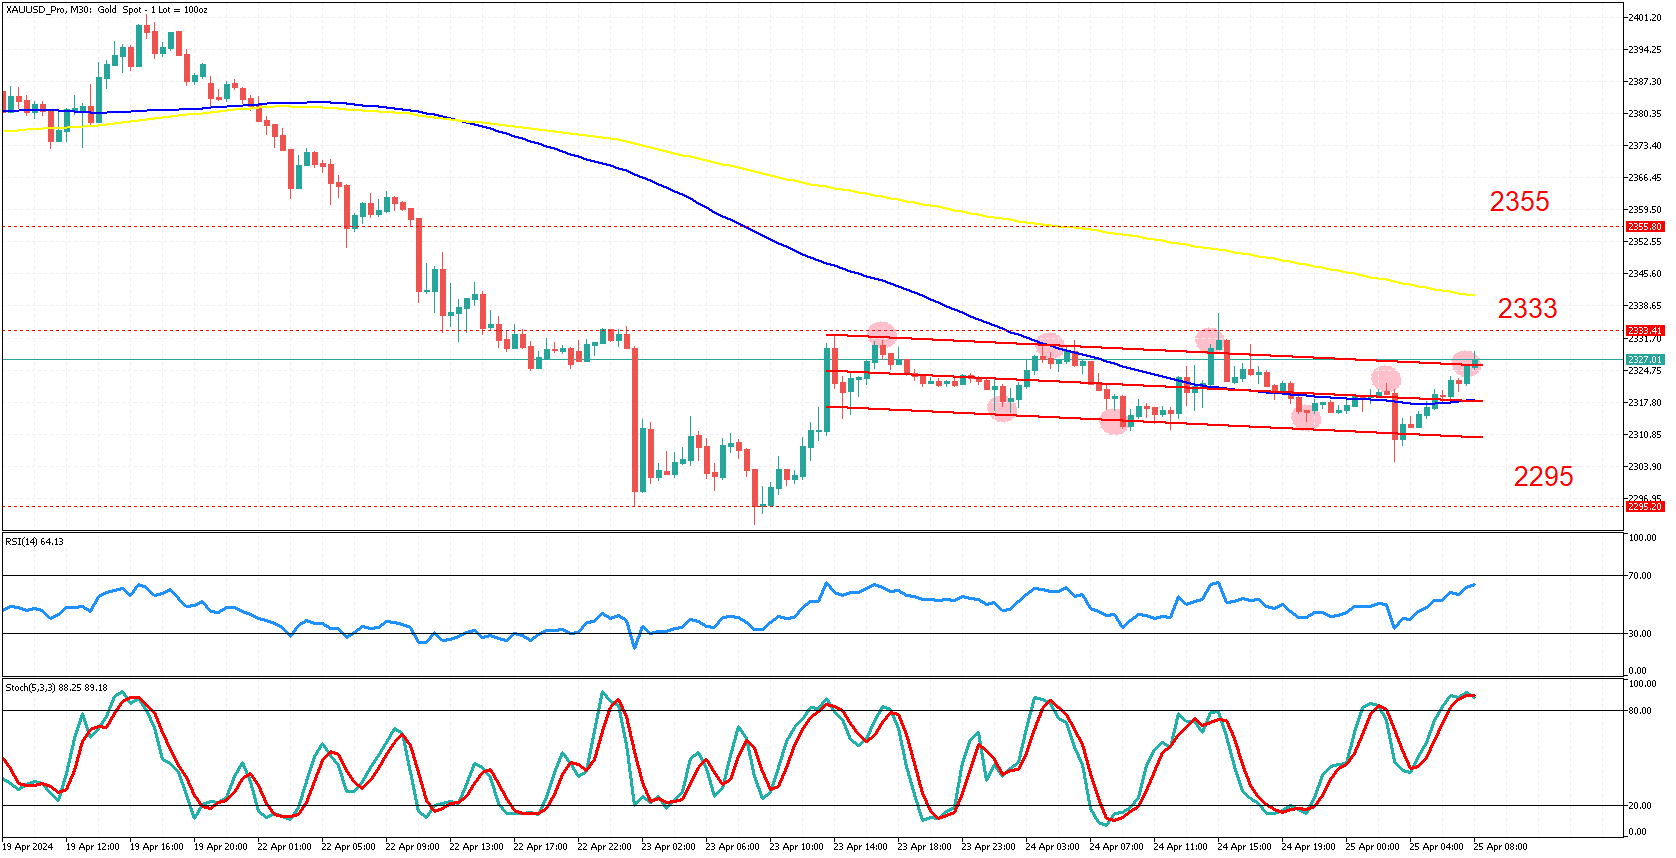
Gold ($XAUUSD) has been trading in a strong uptrend on a 30-minute time frame. On April 12, 2024, it reached an all-time high level of 2430. As per market cycles, prices have since been consolidating in a range. Market cycles usually have strong trending phases followed by consolidations, which are sideways markets characterized by lower volatility. This is then usually followed by strong trends with higher volatility.
After four days of moving sideways, we broke out of the range and started a downtrend that quickly transitioned into the current range, depicted by the price channel.
Ranges are ideal for mean reversion trading strategies. Therefore, oscillators can be very useful in such market conditions. For instance, in the case of gold prices, small swings with low volatility can be observed, which oscillate around a mean. A price channel or Bollinger Bands can be used as the mean, depending on the trader's preference.
The basic setup is to wait for an extreme price, together with a cross of the stochastic signal line. Once these conditions are met (depicted in red circles), the probability of a move back to equilibrium increases.
The conservative approach is to take profit at the center line of the channel and to only take trades in the direction of the slope. That is, if the channel points down, you only take short trades (in line with the trend).
A more aggressive approach is to take all trades (long and short) regardless of the slope. One can also shift the profit target to the opposite trend line of the channel.
Currently, we have two indicators that suggest a higher probability of mean reversion. The price is currently trading at the upper trend line of a downward-sloping channel, and we received a signal from the stochastic oscillator with the signal line crossing in the overbought area. Additionally, some traders may wait for confirming candlestick patterns, such as shooting stars or hammers, which are also frequently seen on the chart.
The first potential target is the center line of the channel. If momentum persists, we can even aim for the bottom line of the channel or the 2295 support level.
The bearish bias will continue as long as the prices remain below the 2333 price level. In case Gold breaches this level with conviction, we should look out for bullish momentum that may carry the price to the 2355 level.
It is important to keep an eye out for any fundamental shifts or changes in sentiment.
Summary:
- Gold traded in a strong uptrend, followed by the current range.
- Ranging markets are favorable for mean reversion trades.
- The market is currently trading at the upper trend line of a downward-sloping channel.
- The stochastic is overbought and has crossed the signal line, reinforcing a downward bias.
- If prices remain below 2333, we should target the center or lower line of the channel.
- Alternatively, should prices breach the 2333 level with conviction, we may look to the 2355 level as a buyers' target.
Keep an eye out for shifting fundamental themes, such as economic data releases or geopolitical events.