


Past performance is not indicative of future results. All historical data, including but not limited to returns, volatility, and other performance metrics, should not be construed as a guarantee of future performance
USD/JPY on a 4-Hour Timeframe
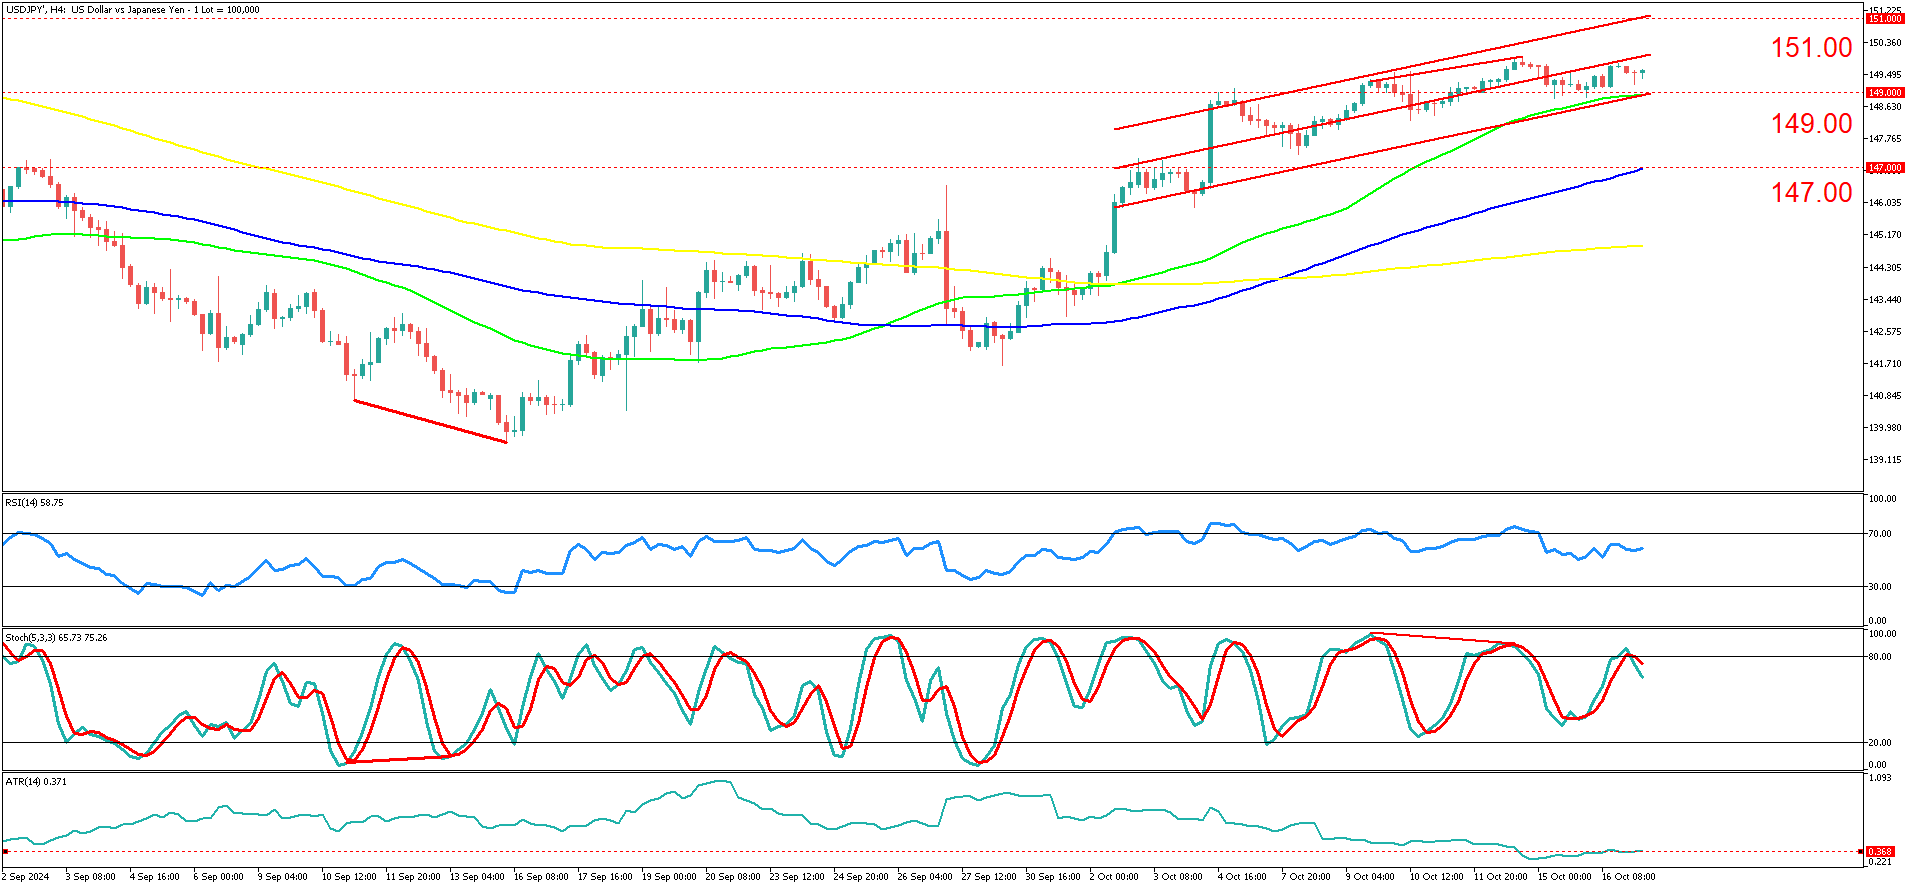
USD/JPY on a 4-hour timeframe has displayed a notable uptrend following the bullish divergence observed in mid-September. The divergence occurred between price action and the Stochastic Oscillator, where price created lower lows, while the Oscillator formed higher lows, signaling weakening bearish momentum and a potential reversal. This led to the current upward trajectory, which has been maintained within a rising regression channel, indicating controlled bullish price action. Currently, the price is consolidating near the lower boundary of this channel, around the 149.00 level, suggesting possible support.
In the short term, price action has remained resilient, testing and respecting key psychological levels such as 149.00. The price structure, supported by the 50-period moving average, reinforces a bullish sentiment. However, the overall price movement has been characterized by low volatility, as evidenced by the Average True Range (ATR), which remains subdued around 0.368.
Historically, periods of low volatility within such regression channels often point toward more stable price action, potentially reducing the likelihood of erratic movements unless spurred by external factors.
From an indicator perspective, the RSI hovers near 59, reflecting moderate bullish momentum, while the Stochastic oscillator is in overbought territory, with a slight bearish crossover. This suggests that some consolidation or pullback might occur in the near term as the market adjusts. The low volatility, combined with overbought conditions, may hint at a temporary pause in the bullish run before any potential breakout beyond 151.00.
The main scenario projection for USD/JPY sees a continuation of the uptrend within the regression channel, provided the price remains above the 149.00 level, with an eventual test of the key resistance at 151.00. A breach above 151.00 could signal further bullish extension toward higher targets.
However, the low volatility may keep price movements orderly, with gradual gains rather than sharp spikes.
An alternative scenario considers a break below 149.00, which could invalidate the current bullish channel and push the price towards 147.00, where the 200-period moving average lies. Such a move could signal a deeper retracement before the market attempts to regain bullish momentum.
Investors should be cautious today as key U.S. economic data is expected to be released at 12:30 GMT, including the Philadelphia Fed Manufacturing Index for October, retail sales figures for September, and the initial jobless claims report.
With all these events carrying high importance, any unexpected outcomes could trigger volatility, particularly if they deviate significantly from expectations. A stronger-than-expected retail sales figure or lower jobless claims could support the USD and push USD/JPY higher, while disappointing data may lead to a pullback from current levels.
Summary
- USD/JPY shows a steady uptrend following the bullish divergence observed in mid-September.
- The price is consolidating near the support level of 149.00 within a rising regression channel.
- Volatility remains low, suggesting stable price action and reducing the likelihood of sharp movements.
- Indicators reflect moderate bullish momentum, but a short-term pullback may occur due to overbought conditions.
- Today's U.S. economic data could trigger increased volatility and influence USD/JPY's further direction.


