


Ethereum’s 2026 is its worst year since 2022, with ETH falling from ~$3,300 to ~$1,550 on June 26—a 44% YTD loss and 69% drawdown from the August 2025 all-time high. The decline accelerated after the Ethereum Foundation confirmed major cuts: 54 positions eliminated, a 40% budget reduction, PSE shut down, and the Client Incentive Program expiring, while nine senior EF figures have departed since January.
Yet the Ethereum price hides a contrary structural story: exchange reserves hit a record low of 14.5 million ETH in June, while 28% of all ETH is staked and earning 3–4%. Just before the cuts, five former EF researchers launched EthLabs with major ecosystem backing, mirroring Standard Chartered’s view that Ethereum resembles “Amazon in 2001: stock crashed, but business metrics improved.” The gap between ETH’s price and its on-chain fundamentals is 2026’s defining tension.
Ethereum Price Prediction 2026 — Key Notes
- Ethereum Price Prediction H2 2026: The path depends on three questions: Does the Glamsterdam upgrade deliver and rebuild the technical investment narrative? Do ETF flows reverse as the macro environment shifts? And can the Ethereum ecosystem close the development funding gap left by the EF's restructuring without losing research momentum?
- BASE CASE ~ 45% ($2,500 – $4,500): Glamsterdam delivers in Q3 2026, the Ethereum Foundation restructuring stabilises, and ETF outflows moderate. ETH recovers toward the $2,500–$4,500 range — consistent with Standard Chartered's $4,000 year-end target, Fundstrat's internal $4,500, and Citi's $3,175 base case. The macro environment remains challenging (hawkish Fed) but not deteriorating further.
- BULL CASE ~ 20% ($4,500 – $12,000): Glamsterdam dramatically outperforms expectations, triggering an infrastructure re-rating. ETF flows reverse strongly as the 3–4% staking yield inside a regulated wrapper attracts pension and insurance capital. Bitcoin's potential recovery toward $100K pulls ETH along, potentially restoring the ETH/BTC ratio toward 0.05–0.06. Tom Lee's $12,000 base case becomes achievable.
- BEAR CASE ~ 35% ($1,000 – $2,000): The Ethereum Foundation's restructuring causes a developer migration to competitor chains (Solana, Sui). Glamsterdam is further delayed. Layer-2 networks continue siphoning fee revenue from mainnet, weakening the deflationary ETH thesis. Citi's recessionary bear case of $1,198 becomes the central scenario rather than the tail. The $1,500 psychological level — which Standard Chartered has flagged as a near-term downside risk — fails to hold.
- Ethereum Price Prediction 2027: The outlook depends on whether the Glamsterdam and Hegotá upgrades (H2 2026) fix L2 fee-siphoning and restore mainnet value accrual. Standard Chartered leads with a $15,000–$18,000 target, driven by $2 trillion in stablecoin and tokenised RWA volume, while Citi's base case is $3,500–$5,000, and algorithmic models cluster at $2,393–$4,555. The consensus sits around $4,000–$6,000, but the wide range reflects uncertainty about Layer 2 competition.
- Ethereum Price Prediction next 5 years: The bull case hinges on it becoming the dominant settlement layer for stablecoins ($2 trillion by 2028), tokenised real-world assets ($2 trillion), and institutional DeFi. Standard Chartered targets $40,000 and argues ETH will outperform Bitcoin, while VanEck's DCF model yields a $22,000 base ($154,000 bull; $360 bear), and Finder's panel averages $12,059. The massive spread ($360–$154,000) reflects uncertainty about Ethereum's competition with Solana, Sui, and other Layer-1 chains.
Whether you want to speculate on ETH near-term price movements, hold Ethereum for the long term, or access it through regulated financial instruments, NAGA offers multiple exposure routes.
Ethereum Fundamental Analysis 2026
Ethereum is fundamentally different from Bitcoin as an investment thesis: its value is not derived from scarcity alone, but from the economic activity that the network generates. Understanding Ethereum's price requires understanding its role as infrastructure — and whether that role is expanding or being eroded.
What Makes Ethereum Different from Bitcoin
Bitcoin's investment thesis is simple: fixed supply of 21 million, store of value, digital gold. Ethereum's thesis is more complex: it is a programmable settlement layer, and its value derives from the fees generated by the activity that runs on it. When DeFi protocols lock billions in TVL, when stablecoin issuers settle trillions in transactions on Ethereum, when tokenised T-bills and money market funds are issued as Ethereum tokens — each of these activities creates demand for ETH as gas (transaction fees) and as staking collateral.
Ethereum currently controls approximately 54% of all stablecoins in circulation and 62% of the tokenised real-world asset market. These are infrastructure metrics, not speculative metrics, and they are what Standard Chartered's Geoff Kendrick means when he compares ETH to "Amazon in 2001" — the business model is working, even when the stock price is not.
The Ethereum Foundation Restructuring — What Actually Happened
On June 23, 2026, the Ethereum Foundation eliminated 54 positions (20% of its 270-person workforce), cut its 2026 budget by 40%, reorganised into five domain clusters, shut down its ZK privacy research unit PSE, and confirmed that the four-year Client Incentive Program — which had funded the client teams maintaining Ethereum's core software — expired in April without replacement. Vitalik Buterin framed the cuts as a deliberate shift to a leaner "endowment model," targeting 5% annual spending by 2030 versus 15% today.
Nine senior leaders have departed since January, including both co-executive directors; Bastian Aue leads as the sole interim head. The day before the announcement, five former EF researchers launched EthLabs — backed by Joe Lubin, BitMine, SharpLink, and 50+ partners — as an independent replacement for key protocol research capacity. The critical open question: whether EthLabs and Protocol Guild can collectively cover the estimated $30 million annual cost of core client development that the EF is stepping back from.
Upgrades — Pectra Done, Glamsterdam Next
Ethereum's upgrade roadmap is the most concrete expression of its long-term value thesis. Pectra (deployed May 2025) and Fusaka (December 2025) significantly improved smart contract interactions and network efficiency. The next major upgrade — Glamsterdam — introduces Proposer-Builder Separation (PBS) at the protocol level, separating block proposal from block construction, increasing effective L1 throughput, and reducing the MEV centralisation that has long been a criticism of Ethereum's architecture.
Historically, major Ethereum upgrades have been strong pre-event price catalysts (The Merge in September 2022, Shapella in April 2023, Dencun in March 2024). Glamsterdam's delay is therefore a meaningful headwind — every week of delay is a week without that catalyst. The Hegotá upgrade (Verkle Trees for state growth management) is expected in late 2026.
Layer-2 and Solana — The Competitive Reality
Two competitive pressures are simultaneously testing Ethereum's market position. First, Ethereum's own Layer-2 ecosystem is succeeding in ways that undermine mainnet fee revenue: median mainnet fees have collapsed from over $2 to under $0.02, while combined Layer-2 networks hit 227 transactions per second in Q1 2026 — but Solana averaged 1,300 TPS over the same period.
More significantly, Solana has captured 58% of decentralised exchange volume versus Ethereum plus its L2S at 40%, a reversal that Standard Chartered's analyst had estimated removed approximately $50 billion from ETH's implied market capitalisation through fee revenue migration. The Glamsterdam upgrade specifically targets the L1 throughput problem through Proposer-Builder Separation, which should improve mainnet competitiveness. Whether it arrives before Solana's lead becomes structural is the key race the Ethereum community is watching.
Staking, Supply Scarcity, and the Deflationary Thesis
Ethereum's transition to proof-of-stake in September 2022 (The Merge) fundamentally altered its supply dynamics. Approximately 28% of all ETH — around 34 million tokens — is now locked in staking, earning validators a yield of 3–4% annually. Since The Merge, Ethereum's annual issuance has fallen to less than 0.5% of total supply, and net issuance has been negative in periods of high network activity (more ETH burned in fees than issued to validators).
Exchange reserves have hit a record low of 14.5 million ETH in June 2026, as coins migrate from trading venues to staking contracts and corporate treasuries. BitMine Immersion alone holds 5.6 million ETH — approximately 4.66% of all circulating ETH — the largest corporate ETH treasury globally. This structural supply reduction means that any sustained increase in demand would likely produce significant price appreciation from current levels.
Stablecoins and Tokenised Real-World Assets — The Infrastructure Play
Ethereum's most compelling long-term fundamental is its dominance as the settlement layer for stablecoins and tokenised assets. More than $147 billion in stablecoins (54% of the global stablecoin supply) currently settle on Ethereum. Tokenised real-world assets — US Treasury bills, money market funds, corporate bonds issued as Ethereum tokens — represent a $62 billion market on Ethereum, with Ethereum holding 62% market share and 68% of active on-chain loans.
JPMorgan launched JLTXX, a tokenised money market fund on Ethereum, creating a new institutional demand source for ETH as the settlement and gas asset. If Standard Chartered's projections prove correct — the stablecoin market growing 6× to $2 trillion and tokenised assets reaching $2 trillion by 2028 — Ethereum's fee revenue and therefore the ETH burn rate would accelerate dramatically, creating the supply-demand dynamic that underpins the $40,000 by 2030 thesis.
Ethereum Outlook: Bullish and Bearish Catalysts
Ethereum’s outlook now depends on whether its structural strengths can outweigh near-term pressure from weaker price action and ecosystem uncertainty. The table below breaks down the main bullish and bearish factors shaping the next phase for ETH.
FACTOR BULLISH READING BEARISH READING Exchange Reserves & Supply 14.5M ETH on exchanges = record low; 28% staked; BitMine holds 4.66% of supply; supply squeeze when demand returns Low reserves reflect selling from L2 revenue migration, not genuine accumulation; staking can be unstaked within days when needed Glamsterdam Upgrade PBS increases L1 throughput, reduces MEV centralisation, attracts institutional validator demand; historically upgrades precede rallies Delayed again; complex implementation risks; even successful delivery may not reverse L2 fee siphoning already underway Ethereum Foundation 20% cuts force leaner operations; EthLabs formation by major stakeholders shows ecosystem self-reliance; decentralising development is long-term positive Short-term developer uncertainty; potential talent exodus to competitors; loss of coordination capacity at a critical protocol development phase Stablecoins & RWA $147B stablecoins on Ethereum; JPMorgan tokenised fund live; $62B in tokenised RWAs; largest infrastructure moat in crypto L2S capture most new stablecoin growth; Solana and other chains gaining stablecoin market share; mainnet fee revenue declining regardless ETF Flows Staking ETF products attract yield-seeking institutional capital (3–4% yield in regulated wrapper); long-term demand channel created in 2024 Spot ETH ETF outflows running in parallel with BTC; institutional capital rotation away from ETH and toward BTC in risk-off environment
Ethereum Technical Analysis 2026
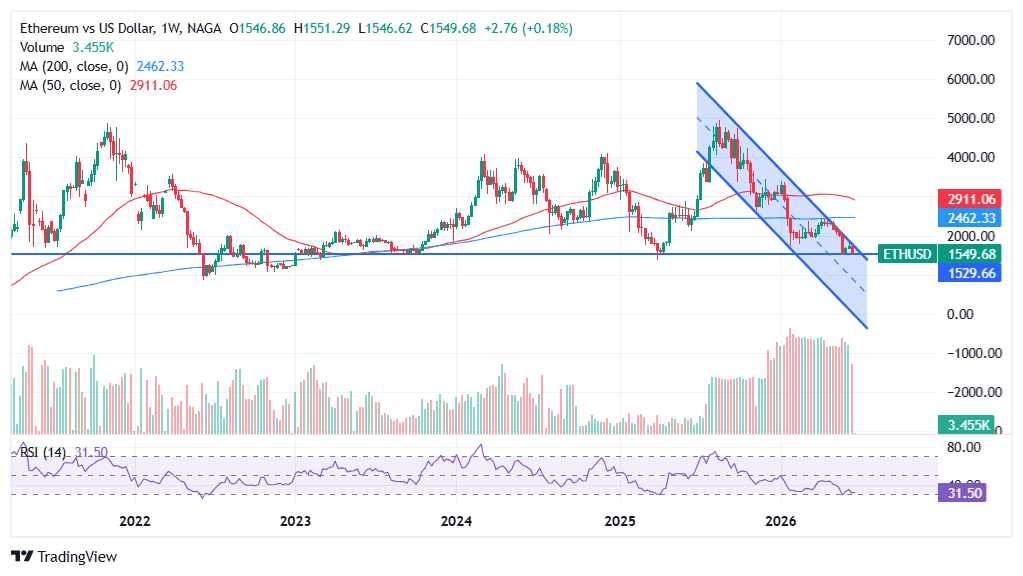
The weekly Ethereum price chart tells the clearest story available now — two converging structures are pressing price toward a single critical level, and the resolution of that level will likely set the direction for the rest of 2026.
Past performance is not a reliable indicator of future results. All historical data, including but not limited to returns, volatility, and other performance metrics, should not be construed as a guarantee of future performance.
- Ethereum's long-term chart pattern is defined by a critical horizontal floor at $1,500, a level that has acted as major support or resistance in every significant move since 2021. Price consolidated near this zone during the 2021–2022 transition, tested it in March 2023 during the banking crisis, and is now approaching it from above for the third time in three years.
- The short-medium term pattern is a bearish descending channel that began at the August 2025 all-time high of $4,946, producing lower highs and lower lows for ten months. Price is pressing against the channel's upper boundary at ~$1,500, converging with the historical floor to create the chart's most critical technical zone.
Weekly RSI is approaching oversold but not yet at exhaustion levels (prior bottoms saw RSI well below 30). Two outcomes define the trajectory: a bounce (weekly close above $2,000 breaks the channel, with $2,5002–$2,900 as the next hurdle) or a break (weekly close below $1,500 triggers forced selling, with $900–$1,200 as next support area).
Ethereum Price Prediction 2026 — Institutional Forecasts
It is essential to note that virtually all institutional targets published for ETH were set when the price was significantly higher — many when ETH was at $2,100–$3,000 in Q1 2026, before the Ethereum Foundation cuts and the macro deterioration of Q2. Even the most conservative published institutional target (Citi's $3,175 base case) implies approximately 95% upside from current levels. This either means the targets will be revised lower, or it represents an extraordinary opportunity — depending on which of the fundamental debates above resolves in favour of Ethereum.
INSTITUTION / ANALYST 2026 TARGET 2027 TARGET 2030 TARGET KEY THESIS Standard Chartered (Geoff Kendrick) $4,000 (revised ↓ from $7,500 in Jan 2026) $15,000–$18,000 $40,000 Stablecoin + RWA tokenisation dominance; ETH/BTC ratio recovery to 0.08; compares ETH to "Amazon in 2001" Tom Lee (Fundstrat / BitMine) $12,000 (base case) $62,000+ — ETH at $3,000 is "severely undervalued"; 60%+ stablecoin settlement share; ETH = 25% of BTC value thesis; backed by 5.6M ETH corporate treasury Citigroup $3,175 (base); $4,488 (bull); $1,198 (bear) $3,500–$5,000 — Most balanced published range; base case requires moderate ETF inflows; bear case assumes recession; explicit $1,198 downside scenario Fundstrat (Sean Farrell, bear-leaning) $1,800–$2,000 (H1 low), $4,500 (year-end) — — Expects H1 2026 pullback before H2 recovery — the most prescient near-term call given current price near $1,630 Arthur Hayes $10,000–$20,000 — — ETH and Solana as the two L1S likely to survive long-term; cycle not over VanEck (Matt Sigel) — — $22,000 base; $154,000 bull; $360 bear DCF-style model on projected ETH free cash flows; unusually rigorous; bear case acknowledges L2 cannibalisation risk Finder Expert Panel (45+ analysts) — — $12,059 avg Aggregated analyst consensus; most conservative credible long-term view
AI-Based Ethereum Forecasts
MODEL 2026 RANGE 2027 2030 SIGNAL Changelly (algorithmic) $2,322–$5,601 (wide range for full year) $2,393–$4,555 Ongoing appreciation Monthly model; revised sharply downward from earlier 2026 forecasts; July 2026 target ~$2,000. Tracks current price action. DigitalCoinPrice $2,322–$5,601 $2,538–$3,895 — Conservative; consistent with "consolidation following upgrades" scenario. Does not model breakout scenarios. Traders Union (statistical) — — $5,161–$5,727 Most conservative credible long-term model; treats ETH as maturing rather than an explosive growth asset by 2030. CryptoNews expert survey $4,500 (mid-year); $7,500 (year-end high) — — Aggregated crypto analyst panel; broadly constructive H2 recovery; consistent with standard Chartered bull case. Benzinga aggregate $1,696–$6,319 (full range) — — The widest published range — the lower bound ($1,696) is close to the current price, the upper ($6,319) requires full bull scenario materialisation.
The AI model consensus is instructive in one specific way: every model except Benzinga's lower bound places ETH significantly above its current level of $1,630 by year-end 2026, even in base or conservative scenarios. This sets up an interesting test: if ETH fails to recover toward $2,500–$3,000 by Q4 2026, it will be the first time in the current cycle that virtually every credible forecasting model — both institutional and algorithmic — proved wrong on the same side simultaneously. That outcome would require either a macro event not currently modelled (a Fed hike in 2026) or an Ethereum-specific breakdown (successful Layer-1 challenger capturing Ethereum's infrastructure role) rather than simply a "slower than expected" recovery.
Ethereum Price History — Key Moments
Ethereum’s price journey reflects the asset’s evolution from ICO speculation to a mature, infrastructure-driven network. The timeline below highlights the key moments that shaped ETH’s major rallies, corrections, and structural transformations.
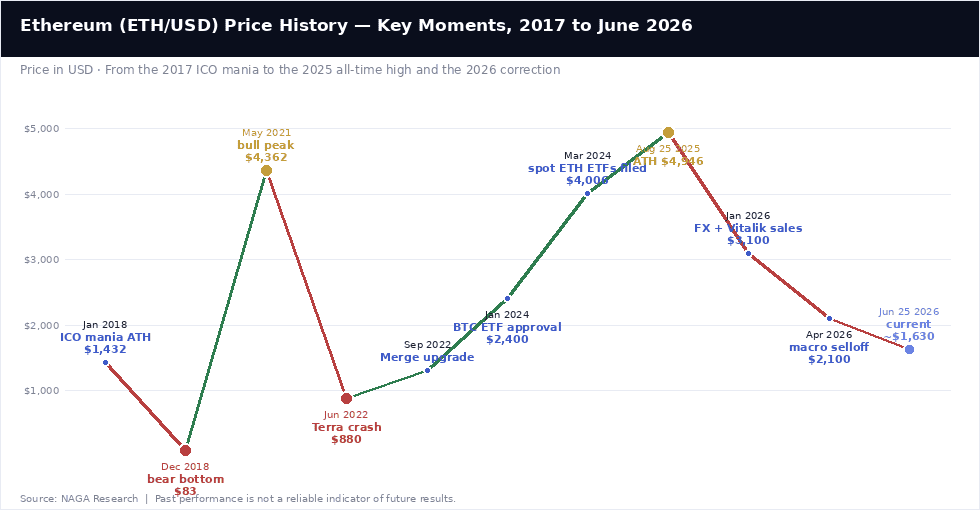
January 2018: ICO Mania Peak — $1,432
Ethereum’s first major all-time high of $1,432 came during the 2018 ICO frenzy, when ETH rose ~10,000% from $10 in under 12 months. The collapse was brutal: ETH fell 94% to $83 by December 2018 as the ICO bubble burst, regulators enforced actions, and the broader market entered a prolonged bear phase.
December 2018: Bear Market Bottom — $83
Ethereum bottomed at ~$83 in December 2018 after a 94% drawdown. Investors who bought this low and held to the May 2021 peak realised a 52× return in under three years. Each bear cycle has repeated this pattern, with drawdowns shrinking as ETH matured (78% in 2022, 67% in 2026).
May 2021: DeFi Bull Peak — $4,362
ETH hit $4,362 in May 2021, driven by the DeFi explosion: DEXs, lending, and yield farming locked tens of billions on Ethereum. This proved Ethereum’s smart contract hypothesis as live economic activity, while NFTs emerged as mainstream, with Ethereum as the settlement layer for all major sales.
June 2022: Terra/Luna Collapse — $880
ETH fell to ~$880 after the Terra/Luna collapse, an algorithmic stablecoin system with $40 billion that imploded in 72 hours. The fallout was systemic across crypto, hitting ETH hard as the de-risking wave coincided with the Fed’s most aggressive rate-hiking cycle since the 1980s.
September 2022: The Merge — Proof-of-Stake
The Merge on September 15, 2022, shifted Ethereum from proof-of-work to proof-of-stake, cutting energy use by ~99.95%. Annual ETH issuance fell from 4.5% to <0.5%, and fee burning made ETH deflationary at high activity. Despite its significance, the Merge had little immediate price impact amid 2022 macro pressure.
January 2024: Bitcoin Spot ETF Approval — $2,400
The January 10, 2024 Bitcoin ETF approval signalled regulators were opening to crypto via traditional finance, with ETH at ~$2,400. Spot Ethereum ETFs followed, creating a new institutional demand channel for ETH through pension, insurance, and wealth management mandates.
August 25, 2025: All-Time High — $4,946
Ethereum reached $4,946 on August 25, 2025, a 5× recovery from 2022 lows, driven by $11.6 billion in ETF inflows, Pectra and Fusaka upgrades, and growing stablecoin/tokenised settlement volume. The August 2025 peak became the cycle high; ETH has not revisited it since.
June 2026: Correction Accelerates — ~$1,550
ETH fell from $4,946 to $1,550, a 69% correction and 44% year-to-date loss, steeper than Bitcoin’s, driven by ETH-specific headwinds: Vitalik’s sales, the Client Incentive Program expiry, and the June 23 EF layoffs (54 cuts, 40% budget cut, PSE closure). Record-low exchange reserves (14.5M ETH) suggest weak hands sold, leaving long-term holders, stakers, and corporate treasuries — conditions that historically precede recoveries.
Ethereum price predictions involve high uncertainty. Institutional forecasts published at higher prices may not reflect current market conditions and have already been revised multiple times in 2026 alone. Cryptocurrency markets are highly volatile; past performance is not a reliable indicator of future results. This article is for informational purposes only and does not constitute investment advice. Never invest more than you can afford to lose.
Other Resources
- Bitcoin price prediction & forecast 2026
- NASDAQ 100 forecast & price predictions 2026
- EUR/USD forecast & price predictions 2026
- Gold forecast & price predictions 2026
- DAX 40 forecast & price predictions 2026
- Silver forecast & price predictions 2026
- How to trade cryptocurrency
- Spot ETFs for Bitcoin and Ethereum explained
- How Ethereum staking works — and what the yield means
- DeFi on Ethereum — what it is and why it matters