


Global stocks attempt a rebound as the US Dollar retreats, but order flow tools show signs of sellers. The best-performing index was the NASDAQ which rose by 1.26% and rose to its highest price since last Wednesday. Higher-than-expected earnings primarily influence the bullish stock market, the discounted price and the upcoming significant Quarterly Earnings Reports. However, investors should note the decline last week resulted from bond yield increases, and yields continue to increase this week. On Monday, the US 10-Year Treasury rose to 4.3420%, a 16-year high.
Interest rate hikes are the leading cause of higher bond yields, and investors are keen to remember that high yields can pressure the stock market. This is also one of the reasons why the Dow Jones and SNP500, which is less related to the tech sector, saw a weaker price movement. The Dow Jones fell by 0.11%, and the SNP500 rose by 0.69%.
The US Dollar Index is trading 0.17% lower during this morning’s Asian session but saw impulse waves in both directions during yesterday’s session. The worst-performing currency on Monday was the Swiss Franc, which declines against all major competitors. The latest economic data, however, support the price of the Swiss Franc. According to a report from the Federal Statistical Office, the number of employed individuals within the country rose to a historical record of 5.303 million.
NASDAQ - High Bond Yields vs. Earnings
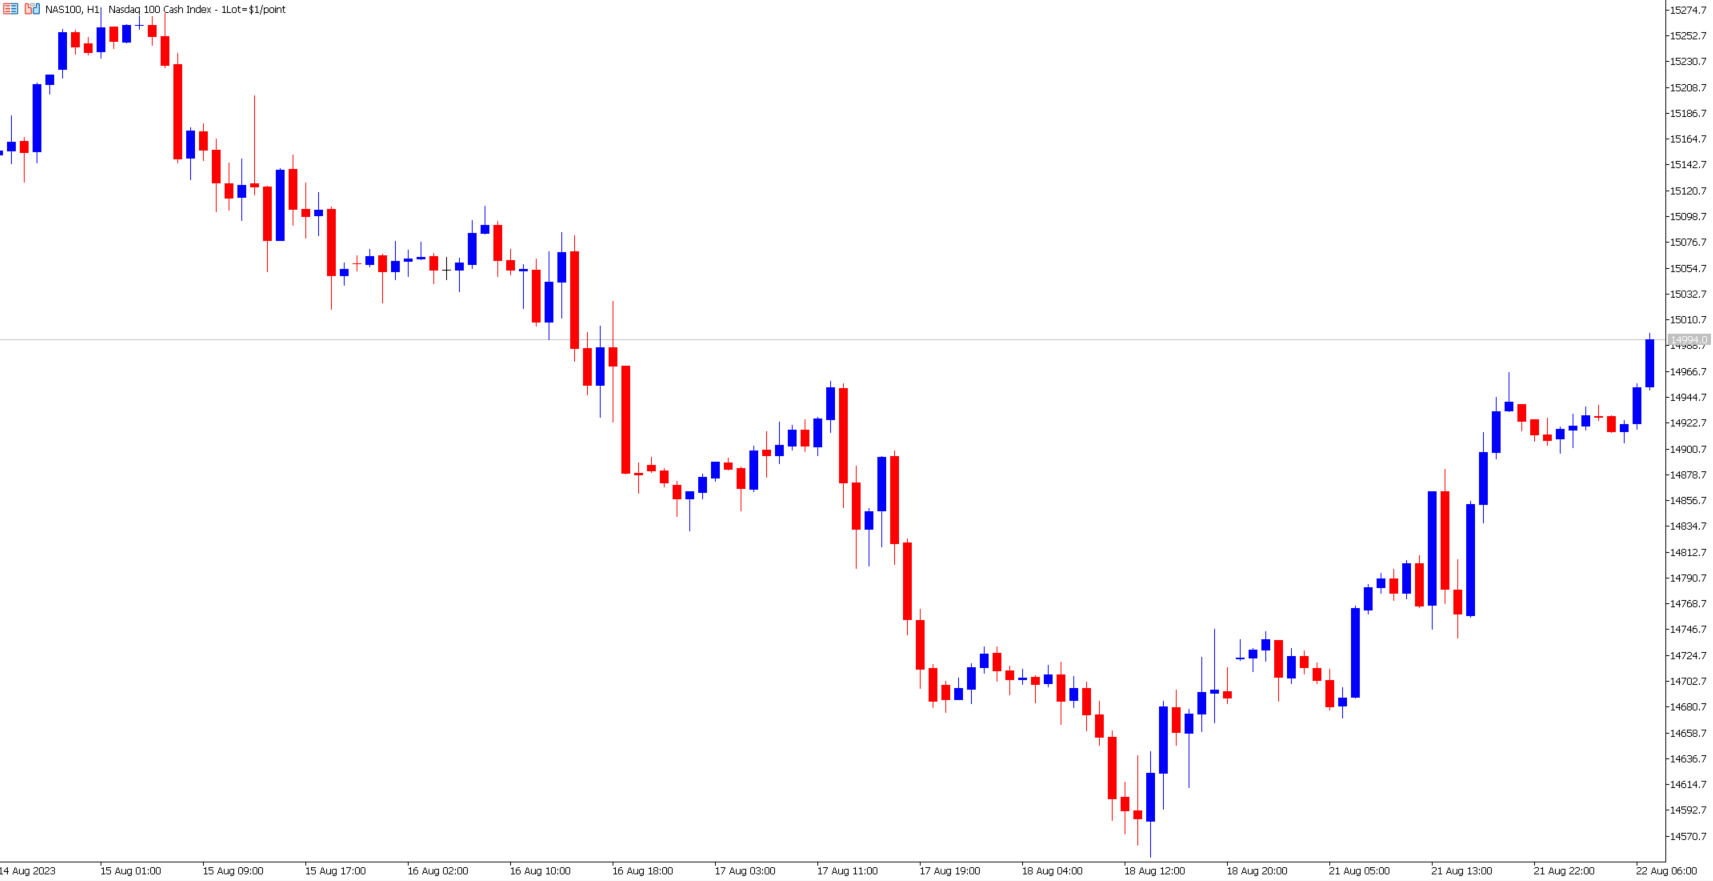
The NASDAQ this morning is rising during this morning’s futures session and adds to gains from Monday. The price of the NASDAQ rose primarily due to earnings data related to the tech sector, and the price trading is almost 9% lower than recent highs. Technical analysis indicates upward price movement on most short and medium-term timeframes. The only concern for investors is that the instrument is yet to surpass the 75-bar Moving Average, acting as a sentiment line. However, crossovers, oscillators and momentum indicators point towards an upward price movement.
However, the bullish price movement may be limited due to the extremely high bond yields and if upcoming earnings data needs to live up to expectations. One of the price drivers was Zoom Communications stocks which rose by 1.50% during the US session and a further 4.40% after the market close. Buyers and significantly low sell orders triggered the 5.90% rise due to the company’s recent quarterly earnings report from Monday evening. Zoom’s earnings read more than 25% higher than expectations and rose by $0.35. The company revenue also rose, reading 2% above Wall Street expectations. The positive data supported the individual stock as well as the NASDAQ. NVIDIA is the forth most influential stock within the NASDAQ composite.
Investors will now turn their attention to NVIDIA and Intuit earnings later this week. NVIDIA stocks rose 8.47% on Monday as investors are optimistic about tomorrow evening’s earnings data. The significant rose as we approach the earnings report indicates shareholder confidence. However, if the data is lower than expected, the stocks can witness significant declines similar to recent gains. Intuit will publish their quarterly earnings report on Thursday evening, and the stock rose by 0.47% on Monday.
Earnings data will be critical to the price action on the asset. However, investors will also monitor the scheduled speeches by bankers later this year. Hawkish central banks paired with super-high bond yields can pressure the stock market regardless of earnings data. Price action shows “sell” signals can arise if the price declines below $14,895.7 and $14,864.5.
CHF/JPY - The Best Performing Currency of 2023
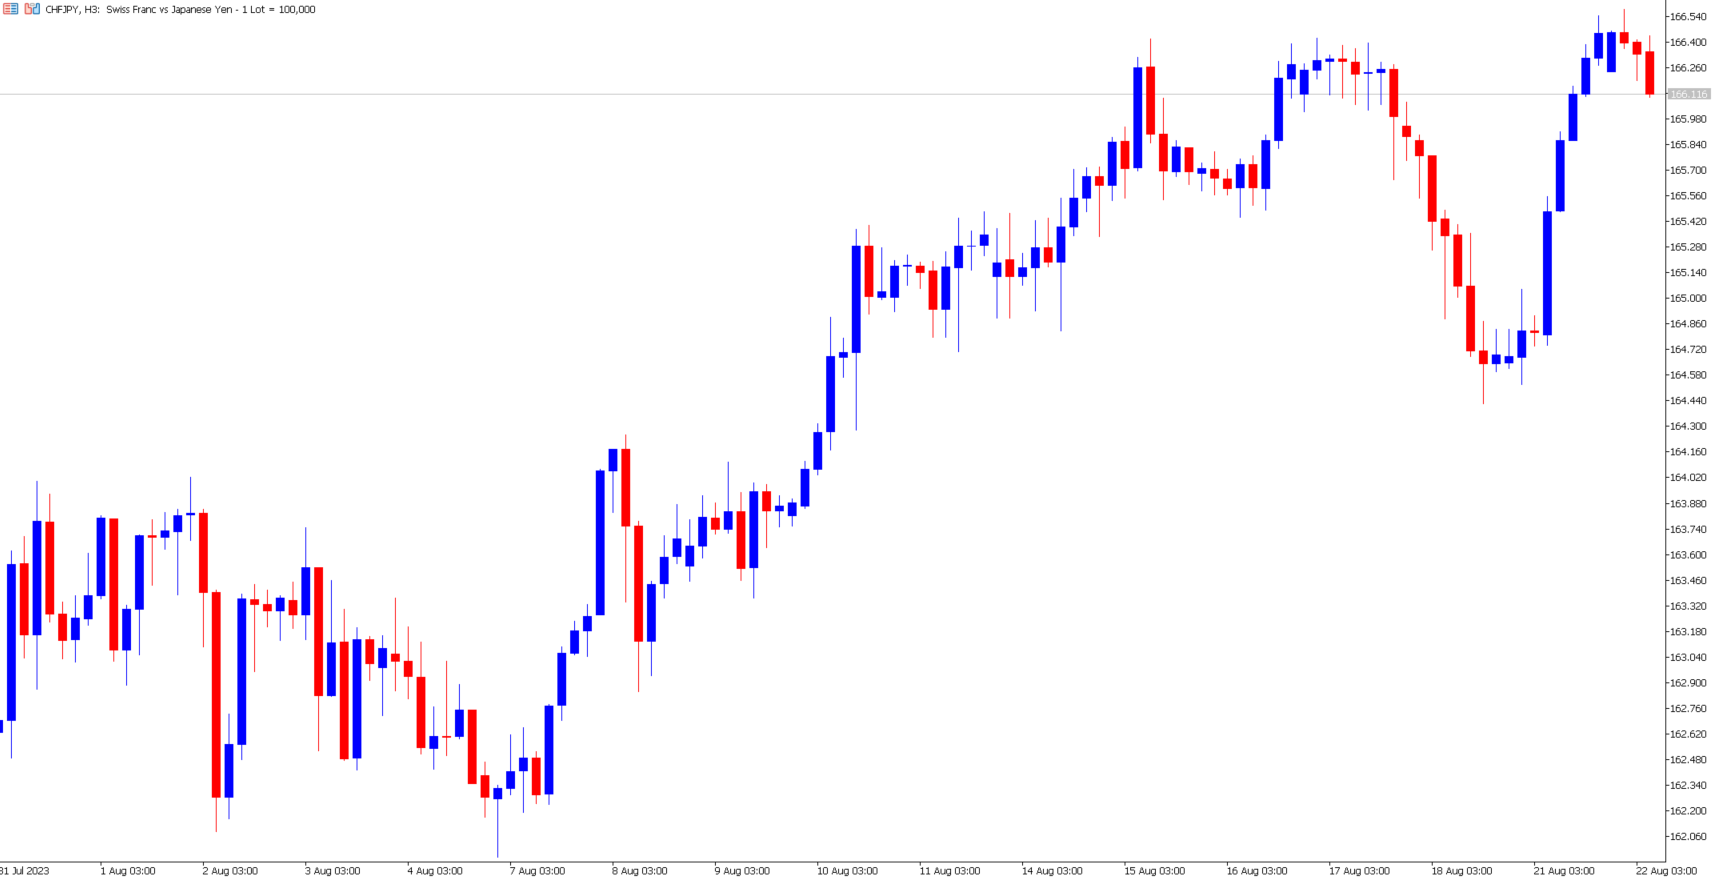
The Swiss Franc has been the best performing of the year so far. The Swiss Franc is seeing the most substantial gains against the Japanese Yen. The CHF/JPY has increased by 17.50% in 2023, adding to the 12.33% from 2022. On average, when monitoring the longer-term price movement, bullish impulse waves are intact for three weeks and retracements for ten days. A concern for longer-term buyers is that the exchange rate trades at an all-time high and is sometimes indicated as overbought on oscillators. However, technical analysts note that oscillators may not accurately indicate more significant downturns. Instead, the currency will require a fundamental reason why holders may sell.
When monitoring price action over the past two weeks, this morning's price has declined at the current resistance level. Sell signals may strengthen if the price declines below 166.015. The primary price drivers are the currency’s safe haven status. In addition, the Swiss National Bank’s rate hikes compared to the ultra-dovish Bank of Japan. If the Bank of Japan continues to remain dovish while its economic conditions improve, the Yen can fall further. During the latest meeting, the SNB raised its interest rate by 0.25% to 1.75% and indicated the possibility of further rate hikes this year to ensure inflation remains checked over the medium term.
Summary:
- The US Dollar and Swiss Franc both declined during this morning’s Asian session. However, both currencies are supported by economic data and monetary policy.
- Many stocks rebound on Monday due to positive earnings and upcoming reports in the technology sector. However, high-interest rates and yield risks remain a major concern.
- On Monday, the US 10-Year Treasury rose to 4.3420%, a 16-year high.
- Investors will now pay attention to NVIDIA and Intuit earnings later this week. NVIDIA stocks rose 8.47% on Monday as investors are optimistic about tomorrow evening’s earnings data.


