


We are now reaching the end of the busiest week of the year, and 90% of economic releases have already been released. Due to the number of news releases, the market has experienced high volatility and plenty of price correction. Currency pairs have specifically witnessed corrections and false breakouts due to the country’s monetary policy changes. However, the stock market has generally formed a clear trend without corrections. This would have been easier to speculate due to the one-sided direction of the price movement.
Economic News and Central Banks
Market participants will now turn their attention to today’s Purchasing Managers’ Index. PMI releases are also deemed to be of high importance and can have a strong influence. This morning the UK and EU will release their PMI reports for the Services and Manufacturing sectors, while the US will release theirs at 14:45 GMT+0.
The EU PMI reports have mainly read higher than the previous month and previously expected figures. So far only the French Service PMI shows a decline. The index reads 48.1 compared to 49.0 which was expected by the market. Germany on the other hand, saw largely positive results.
The 3 main global central banks all took a very similar approach. Most central banks chose to increase interest rates by 50 basis points as expected, but took a more than unanticipated hawkish stance for the next quarter. The European Central Bank had more than 35% of the board voting in favor of a 75 basis point. However, the Bank of England is slightly hawkish with two members of the Monetary Policy Committee voting to halt hikes.
In addition to this, the President advised that rate hikes are far from over. Inflation is also much higher than their US partners across the sea. For this reason, investors are contemplating whether the ECB may hike for at least another 2 months. However, economists have advised that the ECB will stick to 0.50% hikes and not go as high as 0.75%.
UK, EU and US stocks all witnessed significant declines and formed their 3rd bearish candlesticks on the daily timeframe. Many economists had advised that the stock market was overbought and that markets were pricing in a Fed “pivot”, which has not been signaled. This has materialized now that the Central Banks have indeed confirmed no pivot is in sight.
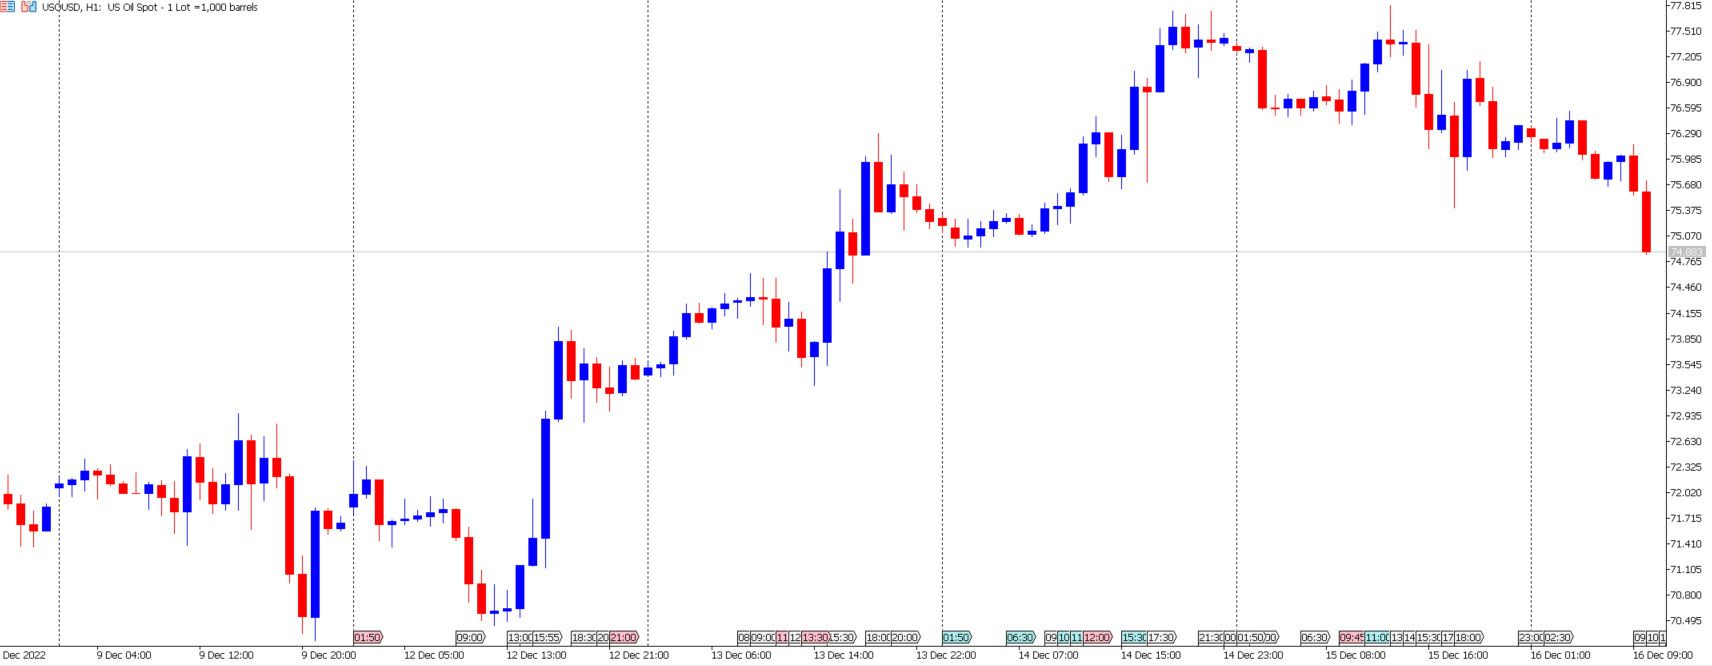
Lastly, an asset that is on track to end the week higher than the weekly open price is Crude Oil. Crude Oil specifically saw strong price movements in the first 3 days of the week. Though traders should note that despite the price being higher this week, the asset still is receiving signals of potential downward price movement. Even though the price is supported by the reopening of China and supply fears, the asset is also under immense pressure from high-interest rates and lower economic growth.
NASDAQ - Strongest Decline since November 2nd
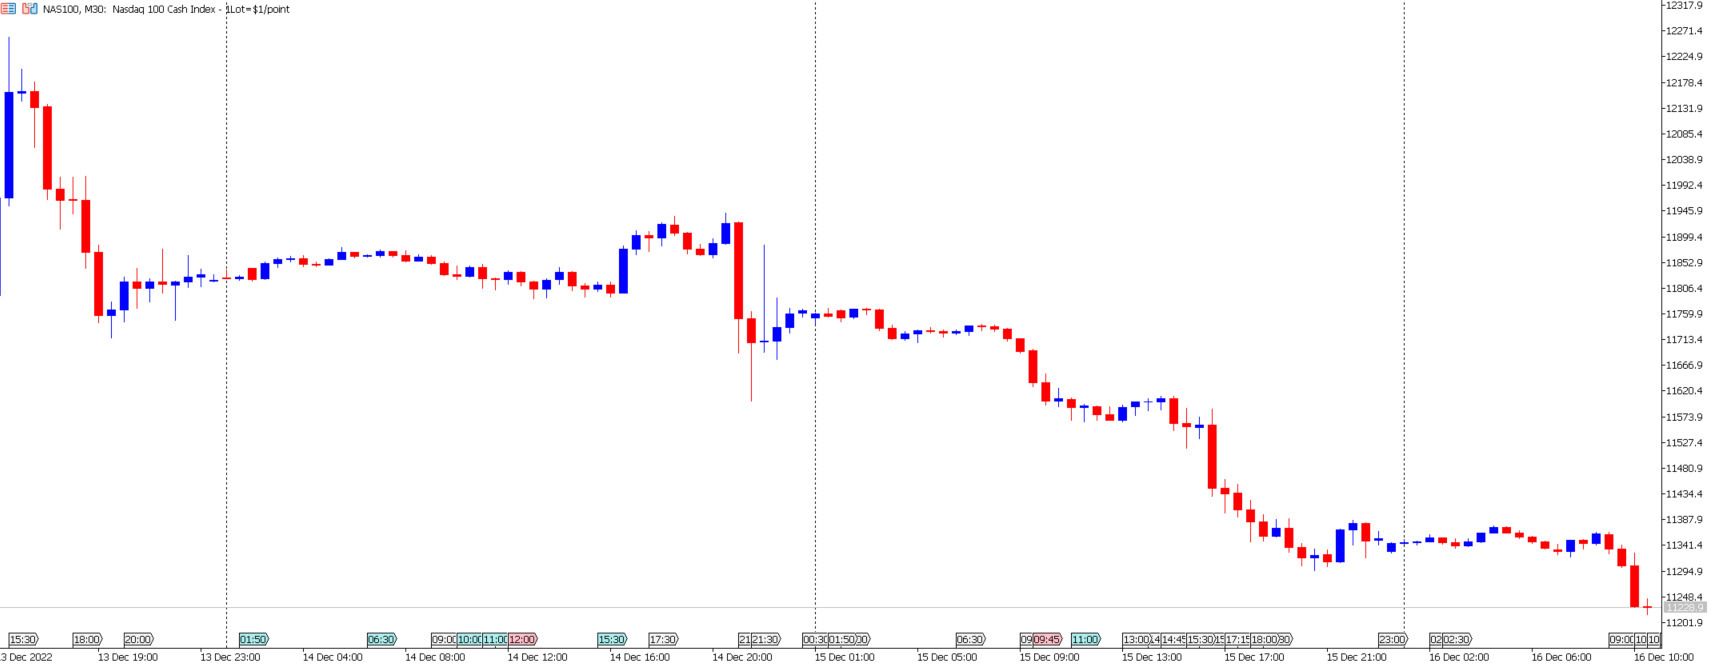
The NASDAQ was the weakest-performing index from the main global stocks. This is due to the correlation between the technology sector and rate hikes. The NASDAQ declined by 3.55% within the day which is significantly higher than the SNP500 that declined by 2.84%.
The NASDAQ has formed clear lower lows and lower highs which is a potential signal for a downward trend. The price has also formed a bearish breakout at the previous support level, which is another bearish sign, and the next support level is significantly lower. The RSI is also showing signs of bearish price movement, but traders should be cautious that the signals do not change throughout the day and over the next week.
The NASDAQ has mainly come under pressure from the hawkish stance being taken by global regulators, but has also struggled after the latest Retail Sales figures. Yesterday’s Retail Sales read -0.6% which is 1.9% lower than the previous month and 0.4% lower than expected. Core Retail Sales also declined by 0.2%. This is an 11-month low and feeds into the bias of higher interest rates equals lower consumer demand.
Only 3 companies saw a price increase from the 100 stocks but increases were mainly related to price factors. The stock which saw the strongest decline was Match Group Inc. which declined by 6.42%.
Lastly, the bond market has seen a considerable spike which is known to pressure the stock market. This also indicates a strong risk-off sentiment as we saw in September and October.
Summary:
- The EU PMI reports have mainly read higher than the previous month and previously expected figures.
- The Fed and ECB are more hawkish than the Bank of England but all opt for a 50 basis point hike.
- The NASDAQ sees its strongest decline since the 2nd of November after a hawkish Fed and poor economic data.
- 35% of the ECB’s members vote for a 75 basis point rate hike.


